
|
市場調査レポート
商品コード
1344289
ATVとUTVの市場:車両タイプ別、排気量別、出力別、燃料タイプ別、最終用途別:世界の機会分析と産業予測、2022-2031年ATV and UTV Market By Vehicle Type, By Displacement, By Power Output, By Fuel Type, By End Use : Global Opportunity Analysis and Industry Forecast, 2022-2031 |
||||||
|
|||||||

| ATVとUTVの市場:車両タイプ別、排気量別、出力別、燃料タイプ別、最終用途別:世界の機会分析と産業予測、2022-2031年 |
|
出版日: 2023年06月01日
発行: Allied Market Research
ページ情報: 英文 370 Pages
納期: 2~3営業日
|

- 全表示
- 概要
- 図表
- 目次
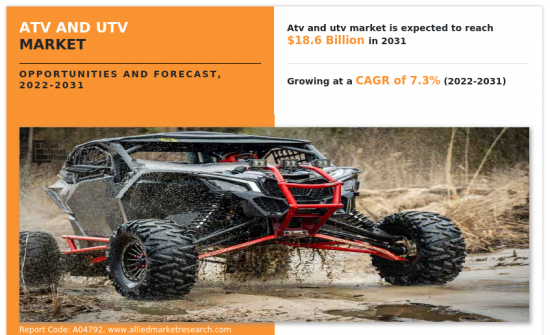
Allied Market Researchが発行した調査レポートによると、ATVとUTV市場は世界中のオフロード車需要の増加により、2022年から2031年にかけて7.3%の大幅な成長率が見込まれています。
世界のATVとUTV市場は、消費者や産業界からの需要増加により急成長しており、主要企業が研究開発に投資して革新的な新製品を投入したり、買収や提携を通じて市場での存在感を拡大したりしており、競争が激しいです。例えば、2021年4月、Arctic Catは、農家が利用できるAlterra 600 EPS四輪車の発売を発表しました。この四輪車は、新しいドライブトレイン、シャーシ、エンジンを搭載し、よりパワフルになり、サービスがしやすいように設計されています。
目次
第1章 イントロダクション
第2章 エグゼクティブサマリー
第3章 市場概要
- 市場の定義と範囲
- 主な調査結果
- 影響要因
- 主な投資機会
- ポーターのファイブフォース分析
- 市場力学
- 促進要因
- 軍事活動におけるATVとUTVの需要増加
- ATVとUTVの公道走行を支援する政府の規則
- レクリエーション活動やアドベンチャースポーツの動向の増加
- 抑制要因
- 地形にダメージを与えるため、野生動物保護区域でのATVとUTVの走行禁止。
- ATVとUTVの高いメンテナンス・コスト
- 機会
- より安全なATVとUTVの生産
- 電気自動車の開発
- 促進要因
- COVID-19による市場への影響分析
第4章 ATVとUTV市場:車両タイプ別
- ATV
- UTV
第5章 ATVとUTV市場:排気量別
- 400CC未満
- 400CC以上800CC未満
- 800CC以上
第6章 ATVとUTV市場:出力別
- 50kW未満
- 50kW以上100kW未満
- 100kW以上
第7章 ATVとUTV市場:燃料タイプ別
- ガソリン駆動
- ディーゼル
- 電動式
- 太陽電池式
第8章 ATVとUTV市場:最終用途別
- 農業
- 軍事
- 登山
- その他
第9章 ATVとUTV市場:地域別
- 北米
- 米国
- カナダ
- メキシコ
- 欧州
- 英国
- ドイツ
- フランス
- イタリア
- その他欧州
- アジア太平洋
- 中国
- 日本
- インド
- 韓国
- その他アジア太平洋地域
- ラテンアメリカ
- ラテンアメリカ
- 中東
- アフリカ
第10章 競合情勢
- イントロダクション
- 主要成功戦略
- 主要10社の製品マッピング
- 競合ダッシュボード
- 競合ヒートマップ
- 主要企業のポジショニング、2021年
第11章 企業プロファイル
- BRP
- CFMOTO
- Deere & Company
- HISUN
- Honda Motor Co., Ltd.
- Kawasaki Heavy Industries
- KUBOTA Corporation.
- KWANG YANG MOTOR CO., LTD.
- POLARIS INDUSTRIES, INC.
- SUZUKI MOTOR CORPORATION
- Textron Inc.
- Yamaha Motor Co Ltd
LIST OF TABLES
- TABLE 01. GLOBAL ATV AND UTV MARKET, BY VEHICLE TYPE, 2021-2031 ($MILLION)
- TABLE 02. ATV AND UTV MARKET FOR ATV, BY REGION, 2021-2031 ($MILLION)
- TABLE 03. ATV AND UTV MARKET FOR UTV, BY REGION, 2021-2031 ($MILLION)
- TABLE 04. GLOBAL ATV AND UTV MARKET, BY DISPLACEMENT, 2021-2031 ($MILLION)
- TABLE 05. ATV AND UTV MARKET FOR LESS THAN 400 CC, BY REGION, 2021-2031 ($MILLION)
- TABLE 06. ATV AND UTV MARKET FOR 400 CC TO 800 CC, BY REGION, 2021-2031 ($MILLION)
- TABLE 07. ATV AND UTV MARKET FOR MORE THAN 800 CC, BY REGION, 2021-2031 ($MILLION)
- TABLE 08. GLOBAL ATV AND UTV MARKET, BY POWER OUTPUT, 2021-2031 ($MILLION)
- TABLE 09. ATV AND UTV MARKET FOR LESS THAN 50KW, BY REGION, 2021-2031 ($MILLION)
- TABLE 10. ATV AND UTV MARKET FOR 50KW TO 100 KW, BY REGION, 2021-2031 ($MILLION)
- TABLE 11. ATV AND UTV MARKET FOR ABOVE 100 KW, BY REGION, 2021-2031 ($MILLION)
- TABLE 12. GLOBAL ATV AND UTV MARKET, BY FUEL TYPE, 2021-2031 ($MILLION)
- TABLE 13. ATV AND UTV MARKET FOR GASOLINE POWERED, BY REGION, 2021-2031 ($MILLION)
- TABLE 14. ATV AND UTV MARKET FOR DIESEL POWERED, BY REGION, 2021-2031 ($MILLION)
- TABLE 15. ATV AND UTV MARKET FOR ELECTRIC POWERED, BY REGION, 2021-2031 ($MILLION)
- TABLE 16. ATV AND UTV MARKET FOR SOLAR POWERED, BY REGION, 2021-2031 ($MILLION)
- TABLE 17. GLOBAL ATV AND UTV MARKET, BY END USE, 2021-2031 ($MILLION)
- TABLE 18. ATV AND UTV MARKET FOR AGRICULTURE, BY REGION, 2021-2031 ($MILLION)
- TABLE 19. ATV AND UTV MARKET FOR MILITARY, BY REGION, 2021-2031 ($MILLION)
- TABLE 20. ATV AND UTV MARKET FOR MOUNTAINEERING, BY REGION, 2021-2031 ($MILLION)
- TABLE 21. ATV AND UTV MARKET FOR OTHERS, BY REGION, 2021-2031 ($MILLION)
- TABLE 22. ATV AND UTV MARKET, BY REGION, 2021-2031 ($MILLION)
- TABLE 23. NORTH AMERICA ATV AND UTV MARKET, BY VEHICLE TYPE, 2021-2031 ($MILLION)
- TABLE 24. NORTH AMERICA ATV AND UTV MARKET, BY DISPLACEMENT, 2021-2031 ($MILLION)
- TABLE 25. NORTH AMERICA ATV AND UTV MARKET, BY POWER OUTPUT, 2021-2031 ($MILLION)
- TABLE 26. NORTH AMERICA ATV AND UTV MARKET, BY FUEL TYPE, 2021-2031 ($MILLION)
- TABLE 27. NORTH AMERICA ATV AND UTV MARKET, BY END USE, 2021-2031 ($MILLION)
- TABLE 28. NORTH AMERICA ATV AND UTV MARKET, BY COUNTRY, 2021-2031 ($MILLION)
- TABLE 29. U.S. ATV AND UTV MARKET, BY VEHICLE TYPE, 2021-2031 ($MILLION)
- TABLE 30. U.S. ATV AND UTV MARKET, BY DISPLACEMENT, 2021-2031 ($MILLION)
- TABLE 31. U.S. ATV AND UTV MARKET, BY POWER OUTPUT, 2021-2031 ($MILLION)
- TABLE 32. U.S. ATV AND UTV MARKET, BY FUEL TYPE, 2021-2031 ($MILLION)
- TABLE 33. U.S. ATV AND UTV MARKET, BY END USE, 2021-2031 ($MILLION)
- TABLE 34. CANADA ATV AND UTV MARKET, BY VEHICLE TYPE, 2021-2031 ($MILLION)
- TABLE 35. CANADA ATV AND UTV MARKET, BY DISPLACEMENT, 2021-2031 ($MILLION)
- TABLE 36. CANADA ATV AND UTV MARKET, BY POWER OUTPUT, 2021-2031 ($MILLION)
- TABLE 37. CANADA ATV AND UTV MARKET, BY FUEL TYPE, 2021-2031 ($MILLION)
- TABLE 38. CANADA ATV AND UTV MARKET, BY END USE, 2021-2031 ($MILLION)
- TABLE 39. MEXICO ATV AND UTV MARKET, BY VEHICLE TYPE, 2021-2031 ($MILLION)
- TABLE 40. MEXICO ATV AND UTV MARKET, BY DISPLACEMENT, 2021-2031 ($MILLION)
- TABLE 41. MEXICO ATV AND UTV MARKET, BY POWER OUTPUT, 2021-2031 ($MILLION)
- TABLE 42. MEXICO ATV AND UTV MARKET, BY FUEL TYPE, 2021-2031 ($MILLION)
- TABLE 43. MEXICO ATV AND UTV MARKET, BY END USE, 2021-2031 ($MILLION)
- TABLE 44. EUROPE ATV AND UTV MARKET, BY VEHICLE TYPE, 2021-2031 ($MILLION)
- TABLE 45. EUROPE ATV AND UTV MARKET, BY DISPLACEMENT, 2021-2031 ($MILLION)
- TABLE 46. EUROPE ATV AND UTV MARKET, BY POWER OUTPUT, 2021-2031 ($MILLION)
- TABLE 47. EUROPE ATV AND UTV MARKET, BY FUEL TYPE, 2021-2031 ($MILLION)
- TABLE 48. EUROPE ATV AND UTV MARKET, BY END USE, 2021-2031 ($MILLION)
- TABLE 49. EUROPE ATV AND UTV MARKET, BY COUNTRY, 2021-2031 ($MILLION)
- TABLE 50. UK ATV AND UTV MARKET, BY VEHICLE TYPE, 2021-2031 ($MILLION)
- TABLE 51. UK ATV AND UTV MARKET, BY DISPLACEMENT, 2021-2031 ($MILLION)
- TABLE 52. UK ATV AND UTV MARKET, BY POWER OUTPUT, 2021-2031 ($MILLION)
- TABLE 53. UK ATV AND UTV MARKET, BY FUEL TYPE, 2021-2031 ($MILLION)
- TABLE 54. UK ATV AND UTV MARKET, BY END USE, 2021-2031 ($MILLION)
- TABLE 55. GERMANY ATV AND UTV MARKET, BY VEHICLE TYPE, 2021-2031 ($MILLION)
- TABLE 56. GERMANY ATV AND UTV MARKET, BY DISPLACEMENT, 2021-2031 ($MILLION)
- TABLE 57. GERMANY ATV AND UTV MARKET, BY POWER OUTPUT, 2021-2031 ($MILLION)
- TABLE 58. GERMANY ATV AND UTV MARKET, BY FUEL TYPE, 2021-2031 ($MILLION)
- TABLE 59. GERMANY ATV AND UTV MARKET, BY END USE, 2021-2031 ($MILLION)
- TABLE 60. FRANCE ATV AND UTV MARKET, BY VEHICLE TYPE, 2021-2031 ($MILLION)
- TABLE 61. FRANCE ATV AND UTV MARKET, BY DISPLACEMENT, 2021-2031 ($MILLION)
- TABLE 62. FRANCE ATV AND UTV MARKET, BY POWER OUTPUT, 2021-2031 ($MILLION)
- TABLE 63. FRANCE ATV AND UTV MARKET, BY FUEL TYPE, 2021-2031 ($MILLION)
- TABLE 64. FRANCE ATV AND UTV MARKET, BY END USE, 2021-2031 ($MILLION)
- TABLE 65. ITALY ATV AND UTV MARKET, BY VEHICLE TYPE, 2021-2031 ($MILLION)
- TABLE 66. ITALY ATV AND UTV MARKET, BY DISPLACEMENT, 2021-2031 ($MILLION)
- TABLE 67. ITALY ATV AND UTV MARKET, BY POWER OUTPUT, 2021-2031 ($MILLION)
- TABLE 68. ITALY ATV AND UTV MARKET, BY FUEL TYPE, 2021-2031 ($MILLION)
- TABLE 69. ITALY ATV AND UTV MARKET, BY END USE, 2021-2031 ($MILLION)
- TABLE 70. REST OF EUROPE ATV AND UTV MARKET, BY VEHICLE TYPE, 2021-2031 ($MILLION)
- TABLE 71. REST OF EUROPE ATV AND UTV MARKET, BY DISPLACEMENT, 2021-2031 ($MILLION)
- TABLE 72. REST OF EUROPE ATV AND UTV MARKET, BY POWER OUTPUT, 2021-2031 ($MILLION)
- TABLE 73. REST OF EUROPE ATV AND UTV MARKET, BY FUEL TYPE, 2021-2031 ($MILLION)
- TABLE 74. REST OF EUROPE ATV AND UTV MARKET, BY END USE, 2021-2031 ($MILLION)
- TABLE 75. ASIA-PACIFIC ATV AND UTV MARKET, BY VEHICLE TYPE, 2021-2031 ($MILLION)
- TABLE 76. ASIA-PACIFIC ATV AND UTV MARKET, BY DISPLACEMENT, 2021-2031 ($MILLION)
- TABLE 77. ASIA-PACIFIC ATV AND UTV MARKET, BY POWER OUTPUT, 2021-2031 ($MILLION)
- TABLE 78. ASIA-PACIFIC ATV AND UTV MARKET, BY FUEL TYPE, 2021-2031 ($MILLION)
- TABLE 79. ASIA-PACIFIC ATV AND UTV MARKET, BY END USE, 2021-2031 ($MILLION)
- TABLE 80. ASIA-PACIFIC ATV AND UTV MARKET, BY COUNTRY, 2021-2031 ($MILLION)
- TABLE 81. CHINA ATV AND UTV MARKET, BY VEHICLE TYPE, 2021-2031 ($MILLION)
- TABLE 82. CHINA ATV AND UTV MARKET, BY DISPLACEMENT, 2021-2031 ($MILLION)
- TABLE 83. CHINA ATV AND UTV MARKET, BY POWER OUTPUT, 2021-2031 ($MILLION)
- TABLE 84. CHINA ATV AND UTV MARKET, BY FUEL TYPE, 2021-2031 ($MILLION)
- TABLE 85. CHINA ATV AND UTV MARKET, BY END USE, 2021-2031 ($MILLION)
- TABLE 86. JAPAN ATV AND UTV MARKET, BY VEHICLE TYPE, 2021-2031 ($MILLION)
- TABLE 87. JAPAN ATV AND UTV MARKET, BY DISPLACEMENT, 2021-2031 ($MILLION)
- TABLE 88. JAPAN ATV AND UTV MARKET, BY POWER OUTPUT, 2021-2031 ($MILLION)
- TABLE 89. JAPAN ATV AND UTV MARKET, BY FUEL TYPE, 2021-2031 ($MILLION)
- TABLE 90. JAPAN ATV AND UTV MARKET, BY END USE, 2021-2031 ($MILLION)
- TABLE 91. INDIA ATV AND UTV MARKET, BY VEHICLE TYPE, 2021-2031 ($MILLION)
- TABLE 92. INDIA ATV AND UTV MARKET, BY DISPLACEMENT, 2021-2031 ($MILLION)
- TABLE 93. INDIA ATV AND UTV MARKET, BY POWER OUTPUT, 2021-2031 ($MILLION)
- TABLE 94. INDIA ATV AND UTV MARKET, BY FUEL TYPE, 2021-2031 ($MILLION)
- TABLE 95. INDIA ATV AND UTV MARKET, BY END USE, 2021-2031 ($MILLION)
- TABLE 96. SOUTH KOREA ATV AND UTV MARKET, BY VEHICLE TYPE, 2021-2031 ($MILLION)
- TABLE 97. SOUTH KOREA ATV AND UTV MARKET, BY DISPLACEMENT, 2021-2031 ($MILLION)
- TABLE 98. SOUTH KOREA ATV AND UTV MARKET, BY POWER OUTPUT, 2021-2031 ($MILLION)
- TABLE 99. SOUTH KOREA ATV AND UTV MARKET, BY FUEL TYPE, 2021-2031 ($MILLION)
- TABLE 100. SOUTH KOREA ATV AND UTV MARKET, BY END USE, 2021-2031 ($MILLION)
- TABLE 101. REST OF ASIA-PACIFIC ATV AND UTV MARKET, BY VEHICLE TYPE, 2021-2031 ($MILLION)
- TABLE 102. REST OF ASIA-PACIFIC ATV AND UTV MARKET, BY DISPLACEMENT, 2021-2031 ($MILLION)
- TABLE 103. REST OF ASIA-PACIFIC ATV AND UTV MARKET, BY POWER OUTPUT, 2021-2031 ($MILLION)
- TABLE 104. REST OF ASIA-PACIFIC ATV AND UTV MARKET, BY FUEL TYPE, 2021-2031 ($MILLION)
- TABLE 105. REST OF ASIA-PACIFIC ATV AND UTV MARKET, BY END USE, 2021-2031 ($MILLION)
- TABLE 106. LAMEA ATV AND UTV MARKET, BY VEHICLE TYPE, 2021-2031 ($MILLION)
- TABLE 107. LAMEA ATV AND UTV MARKET, BY DISPLACEMENT, 2021-2031 ($MILLION)
- TABLE 108. LAMEA ATV AND UTV MARKET, BY POWER OUTPUT, 2021-2031 ($MILLION)
- TABLE 109. LAMEA ATV AND UTV MARKET, BY FUEL TYPE, 2021-2031 ($MILLION)
- TABLE 110. LAMEA ATV AND UTV MARKET, BY END USE, 2021-2031 ($MILLION)
- TABLE 111. LAMEA ATV AND UTV MARKET, BY COUNTRY, 2021-2031 ($MILLION)
- TABLE 112. LATIN AMERICA ATV AND UTV MARKET, BY VEHICLE TYPE, 2021-2031 ($MILLION)
- TABLE 113. LATIN AMERICA ATV AND UTV MARKET, BY DISPLACEMENT, 2021-2031 ($MILLION)
- TABLE 114. LATIN AMERICA ATV AND UTV MARKET, BY POWER OUTPUT, 2021-2031 ($MILLION)
- TABLE 115. LATIN AMERICA ATV AND UTV MARKET, BY FUEL TYPE, 2021-2031 ($MILLION)
- TABLE 116. LATIN AMERICA ATV AND UTV MARKET, BY END USE, 2021-2031 ($MILLION)
- TABLE 117. MIDDLE EAST ATV AND UTV MARKET, BY VEHICLE TYPE, 2021-2031 ($MILLION)
- TABLE 118. MIDDLE EAST ATV AND UTV MARKET, BY DISPLACEMENT, 2021-2031 ($MILLION)
- TABLE 119. MIDDLE EAST ATV AND UTV MARKET, BY POWER OUTPUT, 2021-2031 ($MILLION)
- TABLE 120. MIDDLE EAST ATV AND UTV MARKET, BY FUEL TYPE, 2021-2031 ($MILLION)
- TABLE 121. MIDDLE EAST ATV AND UTV MARKET, BY END USE, 2021-2031 ($MILLION)
- TABLE 122. AFRICA ATV AND UTV MARKET, BY VEHICLE TYPE, 2021-2031 ($MILLION)
- TABLE 123. AFRICA ATV AND UTV MARKET, BY DISPLACEMENT, 2021-2031 ($MILLION)
- TABLE 124. AFRICA ATV AND UTV MARKET, BY POWER OUTPUT, 2021-2031 ($MILLION)
- TABLE 125. AFRICA ATV AND UTV MARKET, BY FUEL TYPE, 2021-2031 ($MILLION)
- TABLE 126. AFRICA ATV AND UTV MARKET, BY END USE, 2021-2031 ($MILLION)
- TABLE 127. BRP: KEY EXECUTIVES
- TABLE 128. BRP: COMPANY SNAPSHOT
- TABLE 129. BRP: PRODUCT SEGMENTS
- TABLE 130. BRP: PRODUCT PORTFOLIO
- TABLE 131. BRP: KEY STRATERGIES
- TABLE 132. CFMOTO: KEY EXECUTIVES
- TABLE 133. CFMOTO: COMPANY SNAPSHOT
- TABLE 134. CFMOTO: PRODUCT SEGMENTS
- TABLE 135. CFMOTO: PRODUCT PORTFOLIO
- TABLE 136. CFMOTO: KEY STRATERGIES
- TABLE 137. DEERE & COMPANY: KEY EXECUTIVES
- TABLE 138. DEERE & COMPANY: COMPANY SNAPSHOT
- TABLE 139. DEERE & COMPANY: PRODUCT SEGMENTS
- TABLE 140. DEERE & COMPANY: PRODUCT PORTFOLIO
- TABLE 141. DEERE & COMPANY: KEY STRATERGIES
- TABLE 142. HISUN: KEY EXECUTIVES
- TABLE 143. HISUN: COMPANY SNAPSHOT
- TABLE 144. HISUN: PRODUCT SEGMENTS
- TABLE 145. HISUN: PRODUCT PORTFOLIO
- TABLE 146. HISUN: KEY STRATERGIES
- TABLE 147. HONDA MOTOR CO., LTD.: KEY EXECUTIVES
- TABLE 148. HONDA MOTOR CO., LTD.: COMPANY SNAPSHOT
- TABLE 149. HONDA MOTOR CO., LTD.: PRODUCT SEGMENTS
- TABLE 150. HONDA MOTOR CO., LTD.: PRODUCT PORTFOLIO
- TABLE 151. HONDA MOTOR CO., LTD.: KEY STRATERGIES
- TABLE 152. KAWASAKI HEAVY INDUSTRIES: KEY EXECUTIVES
- TABLE 153. KAWASAKI HEAVY INDUSTRIES: COMPANY SNAPSHOT
- TABLE 154. KAWASAKI HEAVY INDUSTRIES: PRODUCT SEGMENTS
- TABLE 155. KAWASAKI HEAVY INDUSTRIES: PRODUCT PORTFOLIO
- TABLE 156. KAWASAKI HEAVY INDUSTRIES: KEY STRATERGIES
- TABLE 157. KUBOTA CORPORATION.: KEY EXECUTIVES
- TABLE 158. KUBOTA CORPORATION.: COMPANY SNAPSHOT
- TABLE 159. KUBOTA CORPORATION.: PRODUCT SEGMENTS
- TABLE 160. KUBOTA CORPORATION.: PRODUCT PORTFOLIO
- TABLE 161. KUBOTA CORPORATION.: KEY STRATERGIES
- TABLE 162. KWANG YANG MOTOR CO., LTD.: KEY EXECUTIVES
- TABLE 163. KWANG YANG MOTOR CO., LTD.: COMPANY SNAPSHOT
- TABLE 164. KWANG YANG MOTOR CO., LTD.: PRODUCT SEGMENTS
- TABLE 165. KWANG YANG MOTOR CO., LTD.: PRODUCT PORTFOLIO
- TABLE 166. POLARIS INDUSTRIES, INC.: KEY EXECUTIVES
- TABLE 167. POLARIS INDUSTRIES, INC.: COMPANY SNAPSHOT
- TABLE 168. POLARIS INDUSTRIES, INC.: PRODUCT SEGMENTS
- TABLE 169. POLARIS INDUSTRIES, INC.: PRODUCT PORTFOLIO
- TABLE 170. POLARIS INDUSTRIES, INC.: KEY STRATERGIES
- TABLE 171. SUZUKI MOTOR CORPORATION: KEY EXECUTIVES
- TABLE 172. SUZUKI MOTOR CORPORATION: COMPANY SNAPSHOT
- TABLE 173. SUZUKI MOTOR CORPORATION: PRODUCT SEGMENTS
- TABLE 174. SUZUKI MOTOR CORPORATION: PRODUCT PORTFOLIO
- TABLE 175. SUZUKI MOTOR CORPORATION: KEY STRATERGIES
- TABLE 176. TEXTRON INC.: KEY EXECUTIVES
- TABLE 177. TEXTRON INC.: COMPANY SNAPSHOT
- TABLE 178. TEXTRON INC.: PRODUCT SEGMENTS
- TABLE 179. TEXTRON INC.: PRODUCT PORTFOLIO
- TABLE 180. TEXTRON INC.: KEY STRATERGIES
- TABLE 181. YAMAHA MOTOR CO LTD: KEY EXECUTIVES
- TABLE 182. YAMAHA MOTOR CO LTD: COMPANY SNAPSHOT
- TABLE 183. YAMAHA MOTOR CO LTD: PRODUCT SEGMENTS
- TABLE 184. YAMAHA MOTOR CO LTD: PRODUCT PORTFOLIO
- TABLE 185. YAMAHA MOTOR CO LTD: KEY STRATERGIES
LIST OF FIGURES
- FIGURE 01. ATV AND UTV MARKET, 2021-2031
- FIGURE 02. SEGMENTATION OF ATV AND UTV MARKET, 2021-2031
- FIGURE 03. TOP INVESTMENT POCKETS IN ATV AND UTV MARKET (2022-2031)
- FIGURE 04. LOW BARGAINING POWER OF SUPPLIERS
- FIGURE 05. LOW BARGAINING POWER OF BUYERS
- FIGURE 06. LOW THREAT OF SUBSTITUTES
- FIGURE 07. LOW THREAT OF NEW ENTRANTS
- FIGURE 08. LOW INTENSITY OF RIVALRY
- FIGURE 09. DRIVERS, RESTRAINTS AND OPPORTUNITIES: GLOBALATV AND UTV MARKET
- FIGURE 10. ATV AND UTV MARKET, BY VEHICLE TYPE, 2021(%)
- FIGURE 11. COMPARATIVE SHARE ANALYSIS OF ATV AND UTV MARKET FOR ATV, BY COUNTRY 2021 AND 2031(%)
- FIGURE 12. COMPARATIVE SHARE ANALYSIS OF ATV AND UTV MARKET FOR UTV, BY COUNTRY 2021 AND 2031(%)
- FIGURE 13. ATV AND UTV MARKET, BY DISPLACEMENT, 2021(%)
- FIGURE 14. COMPARATIVE SHARE ANALYSIS OF ATV AND UTV MARKET FOR LESS THAN 400 CC, BY COUNTRY 2021 AND 2031(%)
- FIGURE 15. COMPARATIVE SHARE ANALYSIS OF ATV AND UTV MARKET FOR 400 CC TO 800 CC, BY COUNTRY 2021 AND 2031(%)
- FIGURE 16. COMPARATIVE SHARE ANALYSIS OF ATV AND UTV MARKET FOR MORE THAN 800 CC, BY COUNTRY 2021 AND 2031(%)
- FIGURE 17. ATV AND UTV MARKET, BY POWER OUTPUT, 2021(%)
- FIGURE 18. COMPARATIVE SHARE ANALYSIS OF ATV AND UTV MARKET FOR LESS THAN 50KW, BY COUNTRY 2021 AND 2031(%)
- FIGURE 19. COMPARATIVE SHARE ANALYSIS OF ATV AND UTV MARKET FOR 50KW TO 100 KW, BY COUNTRY 2021 AND 2031(%)
- FIGURE 20. COMPARATIVE SHARE ANALYSIS OF ATV AND UTV MARKET FOR ABOVE 100 KW, BY COUNTRY 2021 AND 2031(%)
- FIGURE 21. ATV AND UTV MARKET, BY FUEL TYPE, 2021(%)
- FIGURE 22. COMPARATIVE SHARE ANALYSIS OF ATV AND UTV MARKET FOR GASOLINE POWERED, BY COUNTRY 2021 AND 2031(%)
- FIGURE 23. COMPARATIVE SHARE ANALYSIS OF ATV AND UTV MARKET FOR DIESEL POWERED, BY COUNTRY 2021 AND 2031(%)
- FIGURE 24. COMPARATIVE SHARE ANALYSIS OF ATV AND UTV MARKET FOR ELECTRIC POWERED, BY COUNTRY 2021 AND 2031(%)
- FIGURE 25. COMPARATIVE SHARE ANALYSIS OF ATV AND UTV MARKET FOR SOLAR POWERED, BY COUNTRY 2021 AND 2031(%)
- FIGURE 26. ATV AND UTV MARKET, BY END USE, 2021(%)
- FIGURE 27. COMPARATIVE SHARE ANALYSIS OF ATV AND UTV MARKET FOR AGRICULTURE, BY COUNTRY 2021 AND 2031(%)
- FIGURE 28. COMPARATIVE SHARE ANALYSIS OF ATV AND UTV MARKET FOR MILITARY, BY COUNTRY 2021 AND 2031(%)
- FIGURE 29. COMPARATIVE SHARE ANALYSIS OF ATV AND UTV MARKET FOR MOUNTAINEERING, BY COUNTRY 2021 AND 2031(%)
- FIGURE 30. COMPARATIVE SHARE ANALYSIS OF ATV AND UTV MARKET FOR OTHERS, BY COUNTRY 2021 AND 2031(%)
- FIGURE 31. ATV AND UTV MARKET BY REGION, 2021
- FIGURE 32. U.S. ATV AND UTV MARKET, 2021-2031 ($MILLION)
- FIGURE 33. CANADA ATV AND UTV MARKET, 2021-2031 ($MILLION)
- FIGURE 34. MEXICO ATV AND UTV MARKET, 2021-2031 ($MILLION)
- FIGURE 35. UK ATV AND UTV MARKET, 2021-2031 ($MILLION)
- FIGURE 36. GERMANY ATV AND UTV MARKET, 2021-2031 ($MILLION)
- FIGURE 37. FRANCE ATV AND UTV MARKET, 2021-2031 ($MILLION)
- FIGURE 38. ITALY ATV AND UTV MARKET, 2021-2031 ($MILLION)
- FIGURE 39. REST OF EUROPE ATV AND UTV MARKET, 2021-2031 ($MILLION)
- FIGURE 40. CHINA ATV AND UTV MARKET, 2021-2031 ($MILLION)
- FIGURE 41. JAPAN ATV AND UTV MARKET, 2021-2031 ($MILLION)
- FIGURE 42. INDIA ATV AND UTV MARKET, 2021-2031 ($MILLION)
- FIGURE 43. SOUTH KOREA ATV AND UTV MARKET, 2021-2031 ($MILLION)
- FIGURE 44. REST OF ASIA-PACIFIC ATV AND UTV MARKET, 2021-2031 ($MILLION)
- FIGURE 45. LATIN AMERICA ATV AND UTV MARKET, 2021-2031 ($MILLION)
- FIGURE 46. MIDDLE EAST ATV AND UTV MARKET, 2021-2031 ($MILLION)
- FIGURE 47. AFRICA ATV AND UTV MARKET, 2021-2031 ($MILLION)
- FIGURE 48. TOP WINNING STRATEGIES, BY YEAR
- FIGURE 49. TOP WINNING STRATEGIES, BY DEVELOPMENT
- FIGURE 50. TOP WINNING STRATEGIES, BY COMPANY
- FIGURE 51. PRODUCT MAPPING OF TOP 10 PLAYERS
- FIGURE 52. COMPETITIVE DASHBOARD
- FIGURE 53. COMPETITIVE HEATMAP: ATV AND UTV MARKET
- FIGURE 54. TOP PLAYER POSITIONING, 2021
- FIGURE 55. BRP: NET REVENUE, 2020-2022 ($MILLION)
- FIGURE 56. BRP: REVENUE SHARE BY SEGMENT, 2022 (%)
- FIGURE 57. BRP: REVENUE SHARE BY REGION, 2022 (%)
- FIGURE 58. DEERE & COMPANY: NET SALES, 2020-2022 ($MILLION)
- FIGURE 59. DEERE & COMPANY: RESEARCH & DEVELOPMENT EXPENDITURE, 2020-2022 ($MILLION)
- FIGURE 60. DEERE & COMPANY: REVENUE SHARE BY SEGMENT, 2022 (%)
- FIGURE 61. DEERE & COMPANY: REVENUE SHARE BY REGION, 2022 (%)
- FIGURE 62. HONDA MOTOR CO., LTD.: RESEARCH & DEVELOPMENT EXPENDITURE, 2019-2021 ($MILLION)
- FIGURE 63. HONDA MOTOR CO., LTD.: NET SALES, 2019-2021 ($MILLION)
- FIGURE 64. HONDA MOTOR CO., LTD.: REVENUE SHARE BY SEGMENT, 2021 (%)
- FIGURE 65. HONDA MOTOR CO., LTD.: REVENUE SHARE BY REGION, 2021 (%)
- FIGURE 66. KAWASAKI HEAVY INDUSTRIES: NET SALES, 2019-2021 ($MILLION)
- FIGURE 67. KAWASAKI HEAVY INDUSTRIES: RESEARCH & DEVELOPMENT EXPENDITURE, 2019-2021 ($MILLION)
- FIGURE 68. KAWASAKI HEAVY INDUSTRIES: REVENUE SHARE BY SEGMENT, 2021 (%)
- FIGURE 69. KAWASAKI HEAVY INDUSTRIES: REVENUE SHARE BY REGION, 2021 (%)
- FIGURE 70. KUBOTA CORPORATION.: NET REVENUE, 2020-2022 ($MILLION)
- FIGURE 71. KUBOTA CORPORATION.: RESEARCH & DEVELOPMENT EXPENDITURE, 2020-2022 ($MILLION)
- FIGURE 72. KUBOTA CORPORATION.: REVENUE SHARE BY SEGMENT, 2022 (%)
- FIGURE 73. KUBOTA CORPORATION.: REVENUE SHARE BY REGION, 2022 (%)
- FIGURE 74. POLARIS INDUSTRIES, INC.: NET SALES, 2020-2022 ($MILLION)
- FIGURE 75. POLARIS INDUSTRIES, INC.: RESEARCH & DEVELOPMENT EXPENDITURE, 2020-2022 ($MILLION)
- FIGURE 76. POLARIS INDUSTRIES, INC.: REVENUE SHARE BY SEGMENT, 2022 (%)
- FIGURE 77. POLARIS INDUSTRIES, INC.: REVENUE SHARE BY REGION, 2022 (%)
- FIGURE 78. SUZUKI MOTOR CORPORATION: NET SALES, 2019-2021 ($MILLION)
- FIGURE 79. SUZUKI MOTOR CORPORATION: RESEARCH & DEVELOPMENT EXPENDITURE, 2019-2021 ($MILLION)
- FIGURE 80. SUZUKI MOTOR CORPORATION: REVENUE SHARE BY SEGMENT, 2021 (%)
- FIGURE 81. SUZUKI MOTOR CORPORATION: REVENUE SHARE BY REGION, 2021 (%)
- FIGURE 82. TEXTRON INC.: NET REVENUE, 2020-2022 ($MILLION)
- FIGURE 83. TEXTRON INC.: RESEARCH & DEVELOPMENT EXPENDITURE, 2020-2022 ($MILLION)
- FIGURE 84. TEXTRON INC.: REVENUE SHARE BY SEGMENT, 2022 (%)
- FIGURE 85. TEXTRON INC.: REVENUE SHARE BY REGION, 2022 (%)
- FIGURE 86. YAMAHA MOTOR CO LTD: RESEARCH & DEVELOPMENT EXPENDITURE, 2020-2022 ($MILLION)
- FIGURE 87. YAMAHA MOTOR CO LTD: NET SALES, 2020-2022 ($MILLION)
- FIGURE 88. YAMAHA MOTOR CO LTD: REVENUE SHARE BY SEGMENT, 2022 (%)
- FIGURE 89. YAMAHA MOTOR CO LTD: REVENUE SHARE BY REGION, 2022 (%)
The ATV and UTV market is expected to experience a significant growth rate of 7.3% from 2022 to 2031 owing to increased demand for off-road vehicles across the globe - Allied Market Research
The global ATV and UTV market are growing rapidly due to increasing demand from consumers and industries and is highly competitive with key players investing in research and development to introduce new and innovative products and expanding their market presence through acquisitions and partnerships. For instance, in April 2021, Arctic Cat announced the launch of Alterra 600 EPS four-wheeler available to farmers, which equipped with new drivetrain, chassis, and engine for more power, and was designed to be easier for service.
The ATV and UTV market is segmented on the basis of vehicle type, displacement, power output, fuel type, end use, and region. By vehicle type, the market is bifurcated into ATV and UTV. By displacement, it is categorized into less than 400 cc, 400 - 800 cc, and more than 800 cc. By power output, it is classified into less than 50KW, 50kW to 100 KW, and above 100 KW. By fuel type, it is divided into gasoline powered, diesel powered, electric powered, and solar powered. By end use, it is segregated into agriculture, military, mountaineering, and others.
By region, the ATV and UTV market has been studied across North America, Europe, Asia-Pacific and LAMEA. Key players operating in the global ATV and UTV market are BRP Inc, CFmoto, Deere Company, Hisun Motors Corporation, Honda Motor Company, Ltd., Kawasaki Heavy Industries Ltd, Kwang Yang Motor Co., Ltd., Kubota Corporation, Polaris Industries, Inc., Suzuki Motor Corporation, Textron Inc, and Yamaha Motor Co., Ltd.
Key Benefits For Stakeholders
- This report provides a quantitative analysis of the market segments, current trends, estimations, and dynamics of the ATV and UTV market analysis from 2021 to 2031 to identify the prevailing ATV and UTV market opportunities.
- The market research is offered along with information related to key drivers, restraints, and opportunities.
- Porter's five forces analysis highlights the potency of buyers and suppliers to enable stakeholders make profit-oriented business decisions and strengthen their supplier-buyer network.
- In-depth analysis of the ATV and UTV market segmentation assists to determine the prevailing market opportunities.
- Major countries in each region are mapped according to their revenue contribution to the global market.
- Market player positioning facilitates benchmarking and provides a clear understanding of the present position of the market players.
- The report includes the analysis of the regional as well as global ATV and UTV market trends, key players, market segments, application areas, and market growth strategies.
Key Market Segments
By Vehicle Type
- ATV
- UTV
By Displacement
- Less Than 400 CC
- 400 CC To 800 CC
- More Than 800 CC
By Power Output
- Less Than 50kW
- 50kW To 100 kW
- Above 100 kW
By Fuel Type
- Gasoline Powered
- Diesel Powered
- Electric Powered
- Solar Powered
By End Use
- Agriculture
- Military
- Mountaineering
- Others
By Region
- North America
- U.S.
- Canada
- Mexico
- Europe
- UK
- Germany
- France
- Italy
- Rest of Europe
- Asia-Pacific
- China
- Japan
- India
- South Korea
- Rest of Asia-Pacific
- LAMEA
- Latin America
- Middle East
- Africa
Key Market Players:
- BRP
- CFMOTO
- Deere & Company
- HISUN
- Honda Motor Co., Ltd.
- Kawasaki Heavy Industries
- KUBOTA Corporation.
- KWANG YANG MOTOR CO., LTD.
- POLARIS INDUSTRIES, INC.
- SUZUKI MOTOR CORPORATION
- Textron Inc.
- Yamaha Motor Co Ltd
TABLE OF CONTENTS
CHAPTER 1: INTRODUCTION
- 1.1. Report description
- 1.2. Key market segments
- 1.3. Key benefits to the stakeholders
- 1.4. Research Methodology
- 1.4.1. Primary research
- 1.4.2. Secondary research
- 1.4.3. Analyst tools and models
CHAPTER 2: EXECUTIVE SUMMARY
- 2.1. CXO Perspective
CHAPTER 3: MARKET OVERVIEW
- 3.1. Market definition and scope
- 3.2. Key findings
- 3.2.1. Top impacting factors
- 3.2.2. Top investment pockets
- 3.3. Porter's five forces analysis
- 3.3.1. Bargaining power of suppliers
- 3.3.2. Bargaining power of buyers
- 3.3.3. Threat of substitutes
- 3.3.4. Threat of new entrants
- 3.3.5. Intensity of rivalry
- 3.4. Market dynamics
- 3.4.1. Drivers
- 3.4.1.1. Rise in demand for ATV & UTV in military activities
- 3.4.1.2. Government rules to support driving ATVs & UTVs on road
- 3.4.1.3. Increase in trend of recreational activities & adventure sports
- 3.4.1. Drivers
- 3.4.2. Restraints
- 3.4.2.1. Ban on ATV & UTV driving in wildlife area due to terrain damage
- 3.4.2.2. High maintenance cost of ATVs & UTVs
- 3.4.3. Opportunities
- 3.4.3.1. Production of safer ATVs & UTVs
- 3.4.3.2. Development of electric vehicles
- 3.5. COVID-19 Impact Analysis on the market
CHAPTER 4: ATV AND UTV MARKET, BY VEHICLE TYPE
- 4.1. Overview
- 4.1.1. Market size and forecast
- 4.2. ATV
- 4.2.1. Key market trends, growth factors and opportunities
- 4.2.2. Market size and forecast, by region
- 4.2.3. Market share analysis by country
- 4.3. UTV
- 4.3.1. Key market trends, growth factors and opportunities
- 4.3.2. Market size and forecast, by region
- 4.3.3. Market share analysis by country
CHAPTER 5: ATV AND UTV MARKET, BY DISPLACEMENT
- 5.1. Overview
- 5.1.1. Market size and forecast
- 5.2. Less Than 400 CC
- 5.2.1. Key market trends, growth factors and opportunities
- 5.2.2. Market size and forecast, by region
- 5.2.3. Market share analysis by country
- 5.3. 400 CC To 800 CC
- 5.3.1. Key market trends, growth factors and opportunities
- 5.3.2. Market size and forecast, by region
- 5.3.3. Market share analysis by country
- 5.4. More Than 800 CC
- 5.4.1. Key market trends, growth factors and opportunities
- 5.4.2. Market size and forecast, by region
- 5.4.3. Market share analysis by country
CHAPTER 6: ATV AND UTV MARKET, BY POWER OUTPUT
- 6.1. Overview
- 6.1.1. Market size and forecast
- 6.2. Less Than 50kW
- 6.2.1. Key market trends, growth factors and opportunities
- 6.2.2. Market size and forecast, by region
- 6.2.3. Market share analysis by country
- 6.3. 50kW To 100 kW
- 6.3.1. Key market trends, growth factors and opportunities
- 6.3.2. Market size and forecast, by region
- 6.3.3. Market share analysis by country
- 6.4. Above 100 kW
- 6.4.1. Key market trends, growth factors and opportunities
- 6.4.2. Market size and forecast, by region
- 6.4.3. Market share analysis by country
CHAPTER 7: ATV AND UTV MARKET, BY FUEL TYPE
- 7.1. Overview
- 7.1.1. Market size and forecast
- 7.2. Gasoline Powered
- 7.2.1. Key market trends, growth factors and opportunities
- 7.2.2. Market size and forecast, by region
- 7.2.3. Market share analysis by country
- 7.3. Diesel Powered
- 7.3.1. Key market trends, growth factors and opportunities
- 7.3.2. Market size and forecast, by region
- 7.3.3. Market share analysis by country
- 7.4. Electric Powered
- 7.4.1. Key market trends, growth factors and opportunities
- 7.4.2. Market size and forecast, by region
- 7.4.3. Market share analysis by country
- 7.5. Solar Powered
- 7.5.1. Key market trends, growth factors and opportunities
- 7.5.2. Market size and forecast, by region
- 7.5.3. Market share analysis by country
CHAPTER 8: ATV AND UTV MARKET, BY END USE
- 8.1. Overview
- 8.1.1. Market size and forecast
- 8.2. Agriculture
- 8.2.1. Key market trends, growth factors and opportunities
- 8.2.2. Market size and forecast, by region
- 8.2.3. Market share analysis by country
- 8.3. Military
- 8.3.1. Key market trends, growth factors and opportunities
- 8.3.2. Market size and forecast, by region
- 8.3.3. Market share analysis by country
- 8.4. Mountaineering
- 8.4.1. Key market trends, growth factors and opportunities
- 8.4.2. Market size and forecast, by region
- 8.4.3. Market share analysis by country
- 8.5. Others
- 8.5.1. Key market trends, growth factors and opportunities
- 8.5.2. Market size and forecast, by region
- 8.5.3. Market share analysis by country
CHAPTER 9: ATV AND UTV MARKET, BY REGION
- 9.1. Overview
- 9.1.1. Market size and forecast By Region
- 9.2. North America
- 9.2.1. Key trends and opportunities
- 9.2.2. Market size and forecast, by Vehicle Type
- 9.2.3. Market size and forecast, by Displacement
- 9.2.4. Market size and forecast, by Power Output
- 9.2.5. Market size and forecast, by Fuel Type
- 9.2.6. Market size and forecast, by End Use
- 9.2.7. Market size and forecast, by country
- 9.2.7.1. U.S.
- 9.2.7.1.1. Key market trends, growth factors and opportunities
- 9.2.7.1.2. Market size and forecast, by Vehicle Type
- 9.2.7.1.3. Market size and forecast, by Displacement
- 9.2.7.1.4. Market size and forecast, by Power Output
- 9.2.7.1.5. Market size and forecast, by Fuel Type
- 9.2.7.1.6. Market size and forecast, by End Use
- 9.2.7.2. Canada
- 9.2.7.2.1. Key market trends, growth factors and opportunities
- 9.2.7.2.2. Market size and forecast, by Vehicle Type
- 9.2.7.2.3. Market size and forecast, by Displacement
- 9.2.7.2.4. Market size and forecast, by Power Output
- 9.2.7.2.5. Market size and forecast, by Fuel Type
- 9.2.7.2.6. Market size and forecast, by End Use
- 9.2.7.3. Mexico
- 9.2.7.3.1. Key market trends, growth factors and opportunities
- 9.2.7.3.2. Market size and forecast, by Vehicle Type
- 9.2.7.3.3. Market size and forecast, by Displacement
- 9.2.7.3.4. Market size and forecast, by Power Output
- 9.2.7.3.5. Market size and forecast, by Fuel Type
- 9.2.7.3.6. Market size and forecast, by End Use
- 9.3. Europe
- 9.3.1. Key trends and opportunities
- 9.3.2. Market size and forecast, by Vehicle Type
- 9.3.3. Market size and forecast, by Displacement
- 9.3.4. Market size and forecast, by Power Output
- 9.3.5. Market size and forecast, by Fuel Type
- 9.3.6. Market size and forecast, by End Use
- 9.3.7. Market size and forecast, by country
- 9.3.7.1. UK
- 9.3.7.1.1. Key market trends, growth factors and opportunities
- 9.3.7.1.2. Market size and forecast, by Vehicle Type
- 9.3.7.1.3. Market size and forecast, by Displacement
- 9.3.7.1.4. Market size and forecast, by Power Output
- 9.3.7.1.5. Market size and forecast, by Fuel Type
- 9.3.7.1.6. Market size and forecast, by End Use
- 9.3.7.2. Germany
- 9.3.7.2.1. Key market trends, growth factors and opportunities
- 9.3.7.2.2. Market size and forecast, by Vehicle Type
- 9.3.7.2.3. Market size and forecast, by Displacement
- 9.3.7.2.4. Market size and forecast, by Power Output
- 9.3.7.2.5. Market size and forecast, by Fuel Type
- 9.3.7.2.6. Market size and forecast, by End Use
- 9.3.7.3. France
- 9.3.7.3.1. Key market trends, growth factors and opportunities
- 9.3.7.3.2. Market size and forecast, by Vehicle Type
- 9.3.7.3.3. Market size and forecast, by Displacement
- 9.3.7.3.4. Market size and forecast, by Power Output
- 9.3.7.3.5. Market size and forecast, by Fuel Type
- 9.3.7.3.6. Market size and forecast, by End Use
- 9.3.7.4. Italy
- 9.3.7.4.1. Key market trends, growth factors and opportunities
- 9.3.7.4.2. Market size and forecast, by Vehicle Type
- 9.3.7.4.3. Market size and forecast, by Displacement
- 9.3.7.4.4. Market size and forecast, by Power Output
- 9.3.7.4.5. Market size and forecast, by Fuel Type
- 9.3.7.4.6. Market size and forecast, by End Use
- 9.3.7.5. Rest of Europe
- 9.3.7.5.1. Key market trends, growth factors and opportunities
- 9.3.7.5.2. Market size and forecast, by Vehicle Type
- 9.3.7.5.3. Market size and forecast, by Displacement
- 9.3.7.5.4. Market size and forecast, by Power Output
- 9.3.7.5.5. Market size and forecast, by Fuel Type
- 9.3.7.5.6. Market size and forecast, by End Use
- 9.4. Asia-Pacific
- 9.4.1. Key trends and opportunities
- 9.4.2. Market size and forecast, by Vehicle Type
- 9.4.3. Market size and forecast, by Displacement
- 9.4.4. Market size and forecast, by Power Output
- 9.4.5. Market size and forecast, by Fuel Type
- 9.4.6. Market size and forecast, by End Use
- 9.4.7. Market size and forecast, by country
- 9.4.7.1. China
- 9.4.7.1.1. Key market trends, growth factors and opportunities
- 9.4.7.1.2. Market size and forecast, by Vehicle Type
- 9.4.7.1.3. Market size and forecast, by Displacement
- 9.4.7.1.4. Market size and forecast, by Power Output
- 9.4.7.1.5. Market size and forecast, by Fuel Type
- 9.4.7.1.6. Market size and forecast, by End Use
- 9.4.7.2. Japan
- 9.4.7.2.1. Key market trends, growth factors and opportunities
- 9.4.7.2.2. Market size and forecast, by Vehicle Type
- 9.4.7.2.3. Market size and forecast, by Displacement
- 9.4.7.2.4. Market size and forecast, by Power Output
- 9.4.7.2.5. Market size and forecast, by Fuel Type
- 9.4.7.2.6. Market size and forecast, by End Use
- 9.4.7.3. India
- 9.4.7.3.1. Key market trends, growth factors and opportunities
- 9.4.7.3.2. Market size and forecast, by Vehicle Type
- 9.4.7.3.3. Market size and forecast, by Displacement
- 9.4.7.3.4. Market size and forecast, by Power Output
- 9.4.7.3.5. Market size and forecast, by Fuel Type
- 9.4.7.3.6. Market size and forecast, by End Use
- 9.4.7.4. South Korea
- 9.4.7.4.1. Key market trends, growth factors and opportunities
- 9.4.7.4.2. Market size and forecast, by Vehicle Type
- 9.4.7.4.3. Market size and forecast, by Displacement
- 9.4.7.4.4. Market size and forecast, by Power Output
- 9.4.7.4.5. Market size and forecast, by Fuel Type
- 9.4.7.4.6. Market size and forecast, by End Use
- 9.4.7.5. Rest of Asia-Pacific
- 9.4.7.5.1. Key market trends, growth factors and opportunities
- 9.4.7.5.2. Market size and forecast, by Vehicle Type
- 9.4.7.5.3. Market size and forecast, by Displacement
- 9.4.7.5.4. Market size and forecast, by Power Output
- 9.4.7.5.5. Market size and forecast, by Fuel Type
- 9.4.7.5.6. Market size and forecast, by End Use
- 9.5. LAMEA
- 9.5.1. Key trends and opportunities
- 9.5.2. Market size and forecast, by Vehicle Type
- 9.5.3. Market size and forecast, by Displacement
- 9.5.4. Market size and forecast, by Power Output
- 9.5.5. Market size and forecast, by Fuel Type
- 9.5.6. Market size and forecast, by End Use
- 9.5.7. Market size and forecast, by country
- 9.5.7.1. Latin America
- 9.5.7.1.1. Key market trends, growth factors and opportunities
- 9.5.7.1.2. Market size and forecast, by Vehicle Type
- 9.5.7.1.3. Market size and forecast, by Displacement
- 9.5.7.1.4. Market size and forecast, by Power Output
- 9.5.7.1.5. Market size and forecast, by Fuel Type
- 9.5.7.1.6. Market size and forecast, by End Use
- 9.5.7.2. Middle East
- 9.5.7.2.1. Key market trends, growth factors and opportunities
- 9.5.7.2.2. Market size and forecast, by Vehicle Type
- 9.5.7.2.3. Market size and forecast, by Displacement
- 9.5.7.2.4. Market size and forecast, by Power Output
- 9.5.7.2.5. Market size and forecast, by Fuel Type
- 9.5.7.2.6. Market size and forecast, by End Use
- 9.5.7.3. Africa
- 9.5.7.3.1. Key market trends, growth factors and opportunities
- 9.5.7.3.2. Market size and forecast, by Vehicle Type
- 9.5.7.3.3. Market size and forecast, by Displacement
- 9.5.7.3.4. Market size and forecast, by Power Output
- 9.5.7.3.5. Market size and forecast, by Fuel Type
- 9.5.7.3.6. Market size and forecast, by End Use
CHAPTER 10: COMPETITIVE LANDSCAPE
- 10.1. Introduction
- 10.2. Top winning strategies
- 10.3. Product Mapping of Top 10 Player
- 10.4. Competitive Dashboard
- 10.5. Competitive Heatmap
- 10.6. Top player positioning, 2021
CHAPTER 11: COMPANY PROFILES
- 11.1. BRP
- 11.1.1. Company overview
- 11.1.2. Key Executives
- 11.1.3. Company snapshot
- 11.1.4. Operating business segments
- 11.1.5. Product portfolio
- 11.1.6. Business performance
- 11.1.7. Key strategic moves and developments
- 11.2. CFMOTO
- 11.2.1. Company overview
- 11.2.2. Key Executives
- 11.2.3. Company snapshot
- 11.2.4. Operating business segments
- 11.2.5. Product portfolio
- 11.2.6. Key strategic moves and developments
- 11.3. Deere & Company
- 11.3.1. Company overview
- 11.3.2. Key Executives
- 11.3.3. Company snapshot
- 11.3.4. Operating business segments
- 11.3.5. Product portfolio
- 11.3.6. Business performance
- 11.3.7. Key strategic moves and developments
- 11.4. HISUN
- 11.4.1. Company overview
- 11.4.2. Key Executives
- 11.4.3. Company snapshot
- 11.4.4. Operating business segments
- 11.4.5. Product portfolio
- 11.4.6. Key strategic moves and developments
- 11.5. Honda Motor Co., Ltd.
- 11.5.1. Company overview
- 11.5.2. Key Executives
- 11.5.3. Company snapshot
- 11.5.4. Operating business segments
- 11.5.5. Product portfolio
- 11.5.6. Business performance
- 11.5.7. Key strategic moves and developments
- 11.6. Kawasaki Heavy Industries
- 11.6.1. Company overview
- 11.6.2. Key Executives
- 11.6.3. Company snapshot
- 11.6.4. Operating business segments
- 11.6.5. Product portfolio
- 11.6.6. Business performance
- 11.6.7. Key strategic moves and developments
- 11.7. KUBOTA Corporation.
- 11.7.1. Company overview
- 11.7.2. Key Executives
- 11.7.3. Company snapshot
- 11.7.4. Operating business segments
- 11.7.5. Product portfolio
- 11.7.6. Business performance
- 11.7.7. Key strategic moves and developments
- 11.8. KWANG YANG MOTOR CO., LTD.
- 11.8.1. Company overview
- 11.8.2. Key Executives
- 11.8.3. Company snapshot
- 11.8.4. Operating business segments
- 11.8.5. Product portfolio
- 11.9. POLARIS INDUSTRIES, INC.
- 11.9.1. Company overview
- 11.9.2. Key Executives
- 11.9.3. Company snapshot
- 11.9.4. Operating business segments
- 11.9.5. Product portfolio
- 11.9.6. Business performance
- 11.9.7. Key strategic moves and developments
- 11.10. SUZUKI MOTOR CORPORATION
- 11.10.1. Company overview
- 11.10.2. Key Executives
- 11.10.3. Company snapshot
- 11.10.4. Operating business segments
- 11.10.5. Product portfolio
- 11.10.6. Business performance
- 11.10.7. Key strategic moves and developments
- 11.11. Textron Inc.
- 11.11.1. Company overview
- 11.11.2. Key Executives
- 11.11.3. Company snapshot
- 11.11.4. Operating business segments
- 11.11.5. Product portfolio
- 11.11.6. Business performance
- 11.11.7. Key strategic moves and developments
- 11.12. Yamaha Motor Co Ltd
- 11.12.1. Company overview
- 11.12.2. Key Executives
- 11.12.3. Company snapshot
- 11.12.4. Operating business segments
- 11.12.5. Product portfolio
- 11.12.6. Business performance
- 11.12.7. Key strategic moves and developments