 |
市場調査レポート
商品コード
1298389
インテントベースネットワーキング(IBN)市場:コンポーネント別、デプロイメントモデル別、企業規模別、業界別 - 世界の機会分析と産業予測、2023-2032年Intent-Based Networking Market By Component, By Deployment model, By Enterprise Size, By Industry Vertical : Global Opportunity Analysis and Industry Forecast, 2023-2032 |
||||||

| インテントベースネットワーキング(IBN)市場:コンポーネント別、デプロイメントモデル別、企業規模別、業界別 - 世界の機会分析と産業予測、2023-2032年 |
|
出版日: 2023年04月01日
発行: Allied Market Research
ページ情報: 英文 405 Pages
納期: 2~3営業日
|
- 全表示
- 概要
- 図表
- 目次
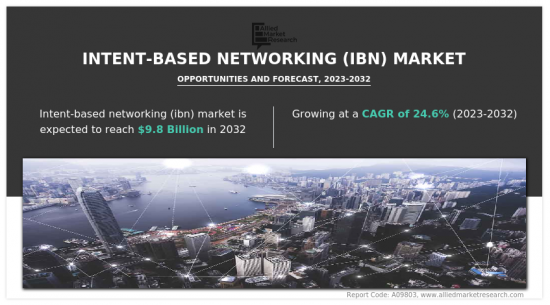
インテントベースネットワーキング(IBN)は、インテリジェンス、アナリティクス、オーケストレーションを組み合わせることで、ネットワーク運用とアップタイムを改善するソフトウェア対応の自動化技術です。
IBNは、プロセスの大部分を自動化し、低コストで拡張性の高いアルゴリズムを使用して、エンドユーザーのサービス品質を最適化する柔軟で俊敏なネットワーク設計を可能にします。ネットワーク管理に対する従来のアプローチは、あるポイントまではスケールアップできますが、ネットワークが大きくなるとすぐに問題に直面します。IBNは、意図に基づいてプロセスを自動化することでこれらの問題に対処し、大規模ネットワークの管理を容易にするツールをネットワーク管理者に提供します。
デジタル化の進展や、世界中でIoTやクラウドベースのサービスなど先端技術の採用が増加していることなどが、IBN市場の成長にプラスの影響を与えています。また、運用性と生産性を向上させるために、企業全体でインテントベースネットワーキング(IBN)ソリューションの採用が増加していることも、今後の市場成長を促進すると予想されます。さらに、BFSI、ヘルスケアなど様々な分野への投資の増加は、予測期間中に市場に有利な成長機会を提供すると期待されています。さらに、IBNソリューションは、AIとMLアルゴリズムの助けを借りて、コストを削減し、アプリケーションに高いセキュリティを提供するのに役立ちます。このような利点は、今後数年間で市場成長のための数多くの機会を生み出すと予測されています。しかし、IBNシステムは複数のオペレーティングシステム、環境、ネットワークコンポーネントの組み合わせであるため設計が複雑であり、投資コストが高いことが市場成長の妨げになると予測されます。
目次
第1章 イントロダクション
第2章 エグゼクティブサマリー
第3章 市場概要
- 市場の定義と範囲
- 主な調査結果
- 影響要因
- 主な投資機会
- ポーターのファイブフォース分析
- 供給企業の交渉力
- 買い手の交渉力
- 代替品の脅威
- 新規参入業者の脅威
- 競合の激しさ
- 市場力学
- 促進要因
- ソフトウェアによる自動化プロセスに対する需要の高まり
- クラウドベースのサービス導入の増加
- コネクテッドデバイスの使用の増加
- 阻害要因
- インテント型ネットワーキング・システムの複雑な設計
- 技術革新にかかるコストの高さと予算の制約
- 機会
- AI、ML、IoTなどの先端技術の採用が進む
- ネットワークセキュリティ強化に対する需要の急増
- 促進要因
- COVID-19市場への影響分析
第4章 インテントベースネットワーキング(IBN)市場:コンポーネント別
- 概要
- 市場規模と予測
- ソリューション
- 主要市場動向、成長要因、機会
- 市場規模・予測:地域別
- 市場シェア分析:国別
- サービス
- 主な市場動向、成長要因、機会
- 市場規模・予測:地域別
- 市場シェア分析:国別
第5章 インテントベースネットワーキング(IBN)市場:デプロイメントモデル別
- 概要
- 市場規模と予測
- クラウド
- 主な市場動向、成長要因、機会
- 市場規模・予測:地域別
- 市場シェア分析:国別
- オンプレミス
- 主な市場動向、成長要因、機会
- 市場規模・予測:地域別
- 市場シェア分析:国別
第6章 インテントベースネットワーキング(IBN)市場:企業規模別
- 概要
- 市場規模と予測
- 大企業
- 主な市場動向、成長要因、機会
- 市場規模・予測:地域別
- 市場シェア分析:国別
- 中小企業
- 主な市場動向、成長要因、機会
- 市場規模・予測:地域別
- 市場シェア分析:国別
第7章 インテントベースネットワーキング(IBN)市場:業界別
- 概要
- 市場規模と予測
- BFSI
- 主要市場動向、成長要因、機会
- 市場規模・予測:地域別
- 市場シェア分析:国別
- IT・通信
- 主な市場動向、成長要因、機会
- 市場規模・予測:地域別
- 市場シェア分析:国別
- ヘルスケア
- 主要市場動向、成長要因、機会
- 市場規模・予測:地域別
- 市場シェア分析:国別
- 小売・消費財
- 主要市場動向、成長要因、機会
- 市場規模・予測:地域別
- 市場シェア分析:国別
- 政府・防衛
- 主要市場動向、成長要因、機会
- 市場規模・予測:地域別
- 市場シェア分析:国別
- 製造
- 主要市場動向、成長要因、機会
- 市場規模・予測:地域別
- 市場シェア分析:国別
- その他
- 主な市場動向、成長要因、機会
- 市場規模・予測:地域別
- 市場シェア分析:国別
第8章 インテントベースネットワーキング(IBN)市場:地域別
- 概要
- 市場規模・予測:地域別
- 北米
- 主な動向と機会
- 市場規模・予測:コンポーネント別
- 市場規模・予測:デプロイメントモデル別
- 市場規模・予測:企業規模別
- 市場規模・予測:業界別
- 市場規模・予測:国別
- 米国
- 主要市場動向、成長要因、機会
- 市場規模・予測:コンポーネント別
- 市場規模・予測:デプロイメントモデル別
- 市場規模・予測:企業規模別
- 市場規模・予測:業界別
- カナダ
- 主要市場動向、成長要因、機会
- 市場規模・予測:コンポーネント別
- 市場規模・予測:デプロイメントモデル別
- 市場規模・予測:企業規模別
- 市場規模・予測:業界別
- 欧州
- 主要動向と機会
- 市場規模・予測:コンポーネント別
- 市場規模・予測:デプロイメントモデル別
- 市場規模・予測:企業規模別
- 市場規模・予測:業界別
- 市場規模・予測:国別
- 英国
- 主要市場動向、成長要因、機会
- 市場規模・予測:コンポーネント別
- 市場規模・予測:デプロイメントモデル別
- 市場規模・予測:企業規模別
- 市場規模・予測:業界別
- ドイツ
- 主要市場動向、成長要因、機会
- 市場規模・予測:コンポーネント別
- 市場規模・予測:デプロイメントモデル別
- 市場規模・予測:企業規模別
- 市場規模・予測:業界別
- フランス
- 主要市場動向、成長要因、機会
- 市場規模・予測:コンポーネント別
- 市場規模・予測:デプロイメントモデル別
- 市場規模・予測:企業規模別
- 市場規模・予測:業界別
- イタリア
- 主要市場動向、成長要因、機会
- 市場規模・予測:コンポーネント別
- 市場規模・予測:デプロイメントモデル別
- 市場規模・予測:企業規模別
- 市場規模・予測:業界別
- スペイン
- 主要市場動向、成長要因、機会
- 市場規模・予測:コンポーネント別
- 市場規模・予測:デプロイメントモデル別
- 市場規模・予測:企業規模別
- 市場規模・予測:業界別
- その他欧州
- 主要市場動向、成長要因、機会
- 市場規模・予測:コンポーネント別
- 市場規模・予測:デプロイメントモデル別
- 市場規模・予測:企業規模別
- 市場規模・予測:業界別
- アジア太平洋地域
- 主な動向と機会
- 市場規模・予測:コンポーネント別
- 市場規模・予測:デプロイメントモデル別
- 市場規模・予測:企業規模別
- 市場規模・予測:業界別
- 市場規模・予測:国別
- 中国市場
- 主要市場動向、成長要因、機会
- 市場規模・予測:コンポーネント別
- 市場規模・予測:デプロイメントモデル別
- 市場規模・予測:企業規模別
- 市場規模・予測:業界別
- インド
- 主要市場動向、成長要因、機会
- 市場規模・予測:コンポーネント別
- 市場規模・予測:デプロイメントモデル別
- 市場規模・予測:企業規模別
- 市場規模・予測:業界別
- 日本
- 主要市場動向、成長要因、機会
- 市場規模・予測:コンポーネント別
- 市場規模・予測:デプロイメントモデル別
- 市場規模・予測:企業規模別
- 市場規模・予測:業界別
- オーストラリア
- 主要市場動向、成長要因、機会
- 市場規模・予測:コンポーネント別
- 市場規模・予測:デプロイメントモデル別
- 市場規模・予測:企業規模別
- 市場規模・予測:業界別
- 韓国
- 主要市場動向、成長要因、機会
- 市場規模・予測:コンポーネント別
- 市場規模・予測:デプロイメントモデル別
- 市場規模・予測:企業規模別
- 市場規模・予測:業界別
- その他アジア太平洋地域
- 主要市場動向、成長要因、機会
- 市場規模・予測:コンポーネント別
- 市場規模・予測:デプロイメントモデル別
- 市場規模・予測:企業規模別
- 市場規模・予測:業界別
- ラテンアメリカ・中東・アフリカ
- 主な動向と機会
- 市場規模・予測:コンポーネント別
- 市場規模・予測:デプロイメントモデル別
- 市場規模・予測:企業規模別
- 市場規模・予測:業界別
- 市場規模・予測:国別
- ラテンアメリカ
- 主要市場動向、成長要因、機会
- 市場規模・予測:コンポーネント別
- 市場規模・予測:デプロイメントモデル別
- 市場規模・予測:企業規模別
- 市場規模・予測:業界別
- 中東
- 主要市場動向、成長要因、機会
- 市場規模・予測:コンポーネント別
- 市場規模・予測:デプロイメントモデル別
- 市場規模・予測:企業規模別
- 市場規模・予測:業界別
- アフリカ市場
- 主要市場動向、成長要因、機会
- 市場規模・予測:コンポーネント別
- 市場規模・予測:デプロイメントモデル別
- 市場規模・予測:企業規模別
- 市場規模・予測:業界別
第9章 競合情勢
- イントロダクション
- 主要成功戦略
- 主要10社の製品マッピング
- 競合ダッシュボード
- 競合ヒートマップ
- トップ企業のポジショニング、2022年
第10章 企業プロファイル
- Cisco Systems Inc.
- Juniper Networks, Inc.
- IBM Corporation
- Huawei Technologies Co., Ltd.
- Hewlett Packard Enterprise Development LP
- Nokia
- wipro
- Gluware
- Forward Networks, Inc.
- NetBrain Technologies
LIST OF TABLES
- TABLE 01. GLOBAL INTENT-BASED NETWORKING (IBN) MARKET, BY COMPONENT, 2022-2032 ($MILLION)
- TABLE 02. INTENT-BASED NETWORKING (IBN) MARKET FOR SOLUTION, BY REGION, 2022-2032 ($MILLION)
- TABLE 03. INTENT-BASED NETWORKING (IBN) MARKET FOR SERVICE, BY REGION, 2022-2032 ($MILLION)
- TABLE 04. GLOBAL INTENT-BASED NETWORKING (IBN) MARKET, BY DEPLOYMENT MODEL, 2022-2032 ($MILLION)
- TABLE 05. INTENT-BASED NETWORKING (IBN) MARKET FOR CLOUD, BY REGION, 2022-2032 ($MILLION)
- TABLE 06. INTENT-BASED NETWORKING (IBN) MARKET FOR ON-PREMISE, BY REGION, 2022-2032 ($MILLION)
- TABLE 07. GLOBAL INTENT-BASED NETWORKING (IBN) MARKET, BY ENTERPRISE SIZE, 2022-2032 ($MILLION)
- TABLE 08. INTENT-BASED NETWORKING (IBN) MARKET FOR LARGE ENTERPRISE, BY REGION, 2022-2032 ($MILLION)
- TABLE 09. INTENT-BASED NETWORKING (IBN) MARKET FOR SMALL AND MEDIUM-SIZED ENTERPRISE, BY REGION, 2022-2032 ($MILLION)
- TABLE 10. GLOBAL INTENT-BASED NETWORKING (IBN) MARKET, BY INDUSTRY VERTICAL, 2022-2032 ($MILLION)
- TABLE 11. INTENT-BASED NETWORKING (IBN) MARKET FOR BFSI, BY REGION, 2022-2032 ($MILLION)
- TABLE 12. INTENT-BASED NETWORKING (IBN) MARKET FOR IT AND TELECOM, BY REGION, 2022-2032 ($MILLION)
- TABLE 13. INTENT-BASED NETWORKING (IBN) MARKET FOR HEALTHCARE, BY REGION, 2022-2032 ($MILLION)
- TABLE 14. INTENT-BASED NETWORKING (IBN) MARKET FOR RETAIL AND CONSUMER GOODS, BY REGION, 2022-2032 ($MILLION)
- TABLE 15. INTENT-BASED NETWORKING (IBN) MARKET FOR GOVERNMENT AND DEFENSE, BY REGION, 2022-2032 ($MILLION)
- TABLE 16. INTENT-BASED NETWORKING (IBN) MARKET FOR MANUFACTURING, BY REGION, 2022-2032 ($MILLION)
- TABLE 17. INTENT-BASED NETWORKING (IBN) MARKET FOR OTHERS, BY REGION, 2022-2032 ($MILLION)
- TABLE 18. INTENT-BASED NETWORKING (IBN) MARKET, BY REGION, 2022-2032 ($MILLION)
- TABLE 19. NORTH AMERICA INTENT-BASED NETWORKING (IBN) MARKET, BY COMPONENT, 2022-2032 ($MILLION)
- TABLE 20. NORTH AMERICA INTENT-BASED NETWORKING (IBN) MARKET, BY DEPLOYMENT MODEL, 2022-2032 ($MILLION)
- TABLE 21. NORTH AMERICA INTENT-BASED NETWORKING (IBN) MARKET, BY ENTERPRISE SIZE, 2022-2032 ($MILLION)
- TABLE 22. NORTH AMERICA INTENT-BASED NETWORKING (IBN) MARKET, BY INDUSTRY VERTICAL, 2022-2032 ($MILLION)
- TABLE 23. NORTH AMERICA INTENT-BASED NETWORKING (IBN) MARKET, BY COUNTRY, 2022-2032 ($MILLION)
- TABLE 24. U.S. INTENT-BASED NETWORKING (IBN) MARKET, BY COMPONENT, 2022-2032 ($MILLION)
- TABLE 25. U.S. INTENT-BASED NETWORKING (IBN) MARKET, BY DEPLOYMENT MODEL, 2022-2032 ($MILLION)
- TABLE 26. U.S. INTENT-BASED NETWORKING (IBN) MARKET, BY ENTERPRISE SIZE, 2022-2032 ($MILLION)
- TABLE 27. U.S. INTENT-BASED NETWORKING (IBN) MARKET, BY INDUSTRY VERTICAL, 2022-2032 ($MILLION)
- TABLE 28. CANADA INTENT-BASED NETWORKING (IBN) MARKET, BY COMPONENT, 2022-2032 ($MILLION)
- TABLE 29. CANADA INTENT-BASED NETWORKING (IBN) MARKET, BY DEPLOYMENT MODEL, 2022-2032 ($MILLION)
- TABLE 30. CANADA INTENT-BASED NETWORKING (IBN) MARKET, BY ENTERPRISE SIZE, 2022-2032 ($MILLION)
- TABLE 31. CANADA INTENT-BASED NETWORKING (IBN) MARKET, BY INDUSTRY VERTICAL, 2022-2032 ($MILLION)
- TABLE 32. EUROPE INTENT-BASED NETWORKING (IBN) MARKET, BY COMPONENT, 2022-2032 ($MILLION)
- TABLE 33. EUROPE INTENT-BASED NETWORKING (IBN) MARKET, BY DEPLOYMENT MODEL, 2022-2032 ($MILLION)
- TABLE 34. EUROPE INTENT-BASED NETWORKING (IBN) MARKET, BY ENTERPRISE SIZE, 2022-2032 ($MILLION)
- TABLE 35. EUROPE INTENT-BASED NETWORKING (IBN) MARKET, BY INDUSTRY VERTICAL, 2022-2032 ($MILLION)
- TABLE 36. EUROPE INTENT-BASED NETWORKING (IBN) MARKET, BY COUNTRY, 2022-2032 ($MILLION)
- TABLE 37. UK INTENT-BASED NETWORKING (IBN) MARKET, BY COMPONENT, 2022-2032 ($MILLION)
- TABLE 38. UK INTENT-BASED NETWORKING (IBN) MARKET, BY DEPLOYMENT MODEL, 2022-2032 ($MILLION)
- TABLE 39. UK INTENT-BASED NETWORKING (IBN) MARKET, BY ENTERPRISE SIZE, 2022-2032 ($MILLION)
- TABLE 40. UK INTENT-BASED NETWORKING (IBN) MARKET, BY INDUSTRY VERTICAL, 2022-2032 ($MILLION)
- TABLE 41. GERMANY INTENT-BASED NETWORKING (IBN) MARKET, BY COMPONENT, 2022-2032 ($MILLION)
- TABLE 42. GERMANY INTENT-BASED NETWORKING (IBN) MARKET, BY DEPLOYMENT MODEL, 2022-2032 ($MILLION)
- TABLE 43. GERMANY INTENT-BASED NETWORKING (IBN) MARKET, BY ENTERPRISE SIZE, 2022-2032 ($MILLION)
- TABLE 44. GERMANY INTENT-BASED NETWORKING (IBN) MARKET, BY INDUSTRY VERTICAL, 2022-2032 ($MILLION)
- TABLE 45. FRANCE INTENT-BASED NETWORKING (IBN) MARKET, BY COMPONENT, 2022-2032 ($MILLION)
- TABLE 46. FRANCE INTENT-BASED NETWORKING (IBN) MARKET, BY DEPLOYMENT MODEL, 2022-2032 ($MILLION)
- TABLE 47. FRANCE INTENT-BASED NETWORKING (IBN) MARKET, BY ENTERPRISE SIZE, 2022-2032 ($MILLION)
- TABLE 48. FRANCE INTENT-BASED NETWORKING (IBN) MARKET, BY INDUSTRY VERTICAL, 2022-2032 ($MILLION)
- TABLE 49. ITALY INTENT-BASED NETWORKING (IBN) MARKET, BY COMPONENT, 2022-2032 ($MILLION)
- TABLE 50. ITALY INTENT-BASED NETWORKING (IBN) MARKET, BY DEPLOYMENT MODEL, 2022-2032 ($MILLION)
- TABLE 51. ITALY INTENT-BASED NETWORKING (IBN) MARKET, BY ENTERPRISE SIZE, 2022-2032 ($MILLION)
- TABLE 52. ITALY INTENT-BASED NETWORKING (IBN) MARKET, BY INDUSTRY VERTICAL, 2022-2032 ($MILLION)
- TABLE 53. SPAIN INTENT-BASED NETWORKING (IBN) MARKET, BY COMPONENT, 2022-2032 ($MILLION)
- TABLE 54. SPAIN INTENT-BASED NETWORKING (IBN) MARKET, BY DEPLOYMENT MODEL, 2022-2032 ($MILLION)
- TABLE 55. SPAIN INTENT-BASED NETWORKING (IBN) MARKET, BY ENTERPRISE SIZE, 2022-2032 ($MILLION)
- TABLE 56. SPAIN INTENT-BASED NETWORKING (IBN) MARKET, BY INDUSTRY VERTICAL, 2022-2032 ($MILLION)
- TABLE 57. REST OF EUROPE INTENT-BASED NETWORKING (IBN) MARKET, BY COMPONENT, 2022-2032 ($MILLION)
- TABLE 58. REST OF EUROPE INTENT-BASED NETWORKING (IBN) MARKET, BY DEPLOYMENT MODEL, 2022-2032 ($MILLION)
- TABLE 59. REST OF EUROPE INTENT-BASED NETWORKING (IBN) MARKET, BY ENTERPRISE SIZE, 2022-2032 ($MILLION)
- TABLE 60. REST OF EUROPE INTENT-BASED NETWORKING (IBN) MARKET, BY INDUSTRY VERTICAL, 2022-2032 ($MILLION)
- TABLE 61. ASIA-PACIFIC INTENT-BASED NETWORKING (IBN) MARKET, BY COMPONENT, 2022-2032 ($MILLION)
- TABLE 62. ASIA-PACIFIC INTENT-BASED NETWORKING (IBN) MARKET, BY DEPLOYMENT MODEL, 2022-2032 ($MILLION)
- TABLE 63. ASIA-PACIFIC INTENT-BASED NETWORKING (IBN) MARKET, BY ENTERPRISE SIZE, 2022-2032 ($MILLION)
- TABLE 64. ASIA-PACIFIC INTENT-BASED NETWORKING (IBN) MARKET, BY INDUSTRY VERTICAL, 2022-2032 ($MILLION)
- TABLE 65. ASIA-PACIFIC INTENT-BASED NETWORKING (IBN) MARKET, BY COUNTRY, 2022-2032 ($MILLION)
- TABLE 66. CHINA INTENT-BASED NETWORKING (IBN) MARKET, BY COMPONENT, 2022-2032 ($MILLION)
- TABLE 67. CHINA INTENT-BASED NETWORKING (IBN) MARKET, BY DEPLOYMENT MODEL, 2022-2032 ($MILLION)
- TABLE 68. CHINA INTENT-BASED NETWORKING (IBN) MARKET, BY ENTERPRISE SIZE, 2022-2032 ($MILLION)
- TABLE 69. CHINA INTENT-BASED NETWORKING (IBN) MARKET, BY INDUSTRY VERTICAL, 2022-2032 ($MILLION)
- TABLE 70. INDIA INTENT-BASED NETWORKING (IBN) MARKET, BY COMPONENT, 2022-2032 ($MILLION)
- TABLE 71. INDIA INTENT-BASED NETWORKING (IBN) MARKET, BY DEPLOYMENT MODEL, 2022-2032 ($MILLION)
- TABLE 72. INDIA INTENT-BASED NETWORKING (IBN) MARKET, BY ENTERPRISE SIZE, 2022-2032 ($MILLION)
- TABLE 73. INDIA INTENT-BASED NETWORKING (IBN) MARKET, BY INDUSTRY VERTICAL, 2022-2032 ($MILLION)
- TABLE 74. JAPAN INTENT-BASED NETWORKING (IBN) MARKET, BY COMPONENT, 2022-2032 ($MILLION)
- TABLE 75. JAPAN INTENT-BASED NETWORKING (IBN) MARKET, BY DEPLOYMENT MODEL, 2022-2032 ($MILLION)
- TABLE 76. JAPAN INTENT-BASED NETWORKING (IBN) MARKET, BY ENTERPRISE SIZE, 2022-2032 ($MILLION)
- TABLE 77. JAPAN INTENT-BASED NETWORKING (IBN) MARKET, BY INDUSTRY VERTICAL, 2022-2032 ($MILLION)
- TABLE 78. AUSTRALIA INTENT-BASED NETWORKING (IBN) MARKET, BY COMPONENT, 2022-2032 ($MILLION)
- TABLE 79. AUSTRALIA INTENT-BASED NETWORKING (IBN) MARKET, BY DEPLOYMENT MODEL, 2022-2032 ($MILLION)
- TABLE 80. AUSTRALIA INTENT-BASED NETWORKING (IBN) MARKET, BY ENTERPRISE SIZE, 2022-2032 ($MILLION)
- TABLE 81. AUSTRALIA INTENT-BASED NETWORKING (IBN) MARKET, BY INDUSTRY VERTICAL, 2022-2032 ($MILLION)
- TABLE 82. SOUTH KOREA INTENT-BASED NETWORKING (IBN) MARKET, BY COMPONENT, 2022-2032 ($MILLION)
- TABLE 83. SOUTH KOREA INTENT-BASED NETWORKING (IBN) MARKET, BY DEPLOYMENT MODEL, 2022-2032 ($MILLION)
- TABLE 84. SOUTH KOREA INTENT-BASED NETWORKING (IBN) MARKET, BY ENTERPRISE SIZE, 2022-2032 ($MILLION)
- TABLE 85. SOUTH KOREA INTENT-BASED NETWORKING (IBN) MARKET, BY INDUSTRY VERTICAL, 2022-2032 ($MILLION)
- TABLE 86. REST OF ASIA-PACIFIC INTENT-BASED NETWORKING (IBN) MARKET, BY COMPONENT, 2022-2032 ($MILLION)
- TABLE 87. REST OF ASIA-PACIFIC INTENT-BASED NETWORKING (IBN) MARKET, BY DEPLOYMENT MODEL, 2022-2032 ($MILLION)
- TABLE 88. REST OF ASIA-PACIFIC INTENT-BASED NETWORKING (IBN) MARKET, BY ENTERPRISE SIZE, 2022-2032 ($MILLION)
- TABLE 89. REST OF ASIA-PACIFIC INTENT-BASED NETWORKING (IBN) MARKET, BY INDUSTRY VERTICAL, 2022-2032 ($MILLION)
- TABLE 90. LAMEA INTENT-BASED NETWORKING (IBN) MARKET, BY COMPONENT, 2022-2032 ($MILLION)
- TABLE 91. LAMEA INTENT-BASED NETWORKING (IBN) MARKET, BY DEPLOYMENT MODEL, 2022-2032 ($MILLION)
- TABLE 92. LAMEA INTENT-BASED NETWORKING (IBN) MARKET, BY ENTERPRISE SIZE, 2022-2032 ($MILLION)
- TABLE 93. LAMEA INTENT-BASED NETWORKING (IBN) MARKET, BY INDUSTRY VERTICAL, 2022-2032 ($MILLION)
- TABLE 94. LAMEA INTENT-BASED NETWORKING (IBN) MARKET, BY COUNTRY, 2022-2032 ($MILLION)
- TABLE 95. LATIN AMERICA INTENT-BASED NETWORKING (IBN) MARKET, BY COMPONENT, 2022-2032 ($MILLION)
- TABLE 96. LATIN AMERICA INTENT-BASED NETWORKING (IBN) MARKET, BY DEPLOYMENT MODEL, 2022-2032 ($MILLION)
- TABLE 97. LATIN AMERICA INTENT-BASED NETWORKING (IBN) MARKET, BY ENTERPRISE SIZE, 2022-2032 ($MILLION)
- TABLE 98. LATIN AMERICA INTENT-BASED NETWORKING (IBN) MARKET, BY INDUSTRY VERTICAL, 2022-2032 ($MILLION)
- TABLE 99. MIDDLE EAST INTENT-BASED NETWORKING (IBN) MARKET, BY COMPONENT, 2022-2032 ($MILLION)
- TABLE 100. MIDDLE EAST INTENT-BASED NETWORKING (IBN) MARKET, BY DEPLOYMENT MODEL, 2022-2032 ($MILLION)
- TABLE 101. MIDDLE EAST INTENT-BASED NETWORKING (IBN) MARKET, BY ENTERPRISE SIZE, 2022-2032 ($MILLION)
- TABLE 102. MIDDLE EAST INTENT-BASED NETWORKING (IBN) MARKET, BY INDUSTRY VERTICAL, 2022-2032 ($MILLION)
- TABLE 103. AFRICA INTENT-BASED NETWORKING (IBN) MARKET, BY COMPONENT, 2022-2032 ($MILLION)
- TABLE 104. AFRICA INTENT-BASED NETWORKING (IBN) MARKET, BY DEPLOYMENT MODEL, 2022-2032 ($MILLION)
- TABLE 105. AFRICA INTENT-BASED NETWORKING (IBN) MARKET, BY ENTERPRISE SIZE, 2022-2032 ($MILLION)
- TABLE 106. AFRICA INTENT-BASED NETWORKING (IBN) MARKET, BY INDUSTRY VERTICAL, 2022-2032 ($MILLION)
- TABLE 107. CISCO SYSTEMS INC.: KEY EXECUTIVES
- TABLE 108. CISCO SYSTEMS INC.: COMPANY SNAPSHOT
- TABLE 109. CISCO SYSTEMS INC.: PRODUCT SEGMENTS
- TABLE 110. CISCO SYSTEMS INC.: PRODUCT PORTFOLIO
- TABLE 111. CISCO SYSTEMS INC.: KEY STRATERGIES
- TABLE 112. JUNIPER NETWORKS, INC.: KEY EXECUTIVES
- TABLE 113. JUNIPER NETWORKS, INC.: COMPANY SNAPSHOT
- TABLE 114. JUNIPER NETWORKS, INC.: PRODUCT SEGMENTS
- TABLE 115. JUNIPER NETWORKS, INC.: PRODUCT PORTFOLIO
- TABLE 116. JUNIPER NETWORKS, INC.: KEY STRATERGIES
- TABLE 117. IBM CORPORATION: KEY EXECUTIVES
- TABLE 118. IBM CORPORATION: COMPANY SNAPSHOT
- TABLE 119. IBM CORPORATION: SERVICE SEGMENTS
- TABLE 120. IBM CORPORATION: PRODUCT PORTFOLIO
- TABLE 121. IBM CORPORATION: KEY STRATERGIES
- TABLE 122. HUAWEI TECHNOLOGIES CO., LTD.: KEY EXECUTIVES
- TABLE 123. HUAWEI TECHNOLOGIES CO., LTD.: COMPANY SNAPSHOT
- TABLE 124. HUAWEI TECHNOLOGIES CO., LTD.: SERVICE SEGMENTS
- TABLE 125. HUAWEI TECHNOLOGIES CO., LTD.: PRODUCT PORTFOLIO
- TABLE 126. HUAWEI TECHNOLOGIES CO., LTD.: KEY STRATERGIES
- TABLE 127. HEWLETT PACKARD ENTERPRISE DEVELOPMENT LP: KEY EXECUTIVES
- TABLE 128. HEWLETT PACKARD ENTERPRISE DEVELOPMENT LP: COMPANY SNAPSHOT
- TABLE 129. HEWLETT PACKARD ENTERPRISE DEVELOPMENT LP: SERVICE SEGMENTS
- TABLE 130. HEWLETT PACKARD ENTERPRISE DEVELOPMENT LP: PRODUCT PORTFOLIO
- TABLE 131. HEWLETT PACKARD ENTERPRISE DEVELOPMENT LP: KEY STRATERGIES
- TABLE 132. NOKIA: KEY EXECUTIVES
- TABLE 133. NOKIA: COMPANY SNAPSHOT
- TABLE 134. NOKIA: SERVICE SEGMENTS
- TABLE 135. NOKIA: PRODUCT PORTFOLIO
- TABLE 136. NOKIA: KEY STRATERGIES
- TABLE 137. WIPRO: KEY EXECUTIVES
- TABLE 138. WIPRO: COMPANY SNAPSHOT
- TABLE 139. WIPRO: SERVICE SEGMENTS
- TABLE 140. WIPRO: PRODUCT PORTFOLIO
- TABLE 141. WIPRO: KEY STRATERGIES
- TABLE 142. GLUWARE: KEY EXECUTIVES
- TABLE 143. GLUWARE: COMPANY SNAPSHOT
- TABLE 144. GLUWARE: SERVICE SEGMENTS
- TABLE 145. GLUWARE: PRODUCT PORTFOLIO
- TABLE 146. GLUWARE: KEY STRATERGIES
- TABLE 147. FORWARD NETWORKS, INC.: KEY EXECUTIVES
- TABLE 148. FORWARD NETWORKS, INC.: COMPANY SNAPSHOT
- TABLE 149. FORWARD NETWORKS, INC.: SERVICE SEGMENTS
- TABLE 150. FORWARD NETWORKS, INC.: PRODUCT PORTFOLIO
- TABLE 151. FORWARD NETWORKS, INC.: KEY STRATERGIES
- TABLE 152. NETBRAIN TECHNOLOGIES: KEY EXECUTIVES
- TABLE 153. NETBRAIN TECHNOLOGIES: COMPANY SNAPSHOT
- TABLE 154. NETBRAIN TECHNOLOGIES: SERVICE SEGMENTS
- TABLE 155. NETBRAIN TECHNOLOGIES: PRODUCT PORTFOLIO
- TABLE 156. NETBRAIN TECHNOLOGIES: KEY STRATERGIES
LIST OF FIGURES
- FIGURE 01. INTENT-BASED NETWORKING (IBN) MARKET, 2022-2032
- FIGURE 02. SEGMENTATION OF INTENT-BASED NETWORKING (IBN) MARKET, 2022-2032
- FIGURE 03. TOP INVESTMENT POCKETS IN INTENT-BASED NETWORKING (IBN) MARKET (2023-2032)
- FIGURE 04. LOW BARGAINING POWER OF SUPPLIERS
- FIGURE 05. LOW BARGAINING POWER OF BUYERS
- FIGURE 06. LOW THREAT OF SUBSTITUTES
- FIGURE 07. LOW THREAT OF NEW ENTRANTS
- FIGURE 08. LOW INTENSITY OF RIVALRY
- FIGURE 09. DRIVERS, RESTRAINTS AND OPPORTUNITIES: GLOBALINTENT-BASED NETWORKING (IBN) MARKET
- FIGURE 10. INTENT-BASED NETWORKING (IBN) MARKET, BY COMPONENT, 2022(%)
- FIGURE 11. COMPARATIVE SHARE ANALYSIS OF INTENT-BASED NETWORKING (IBN) MARKET FOR SOLUTION, BY COUNTRY 2022 AND 2032(%)
- FIGURE 12. COMPARATIVE SHARE ANALYSIS OF INTENT-BASED NETWORKING (IBN) MARKET FOR SERVICE, BY COUNTRY 2022 AND 2032(%)
- FIGURE 13. INTENT-BASED NETWORKING (IBN) MARKET, BY DEPLOYMENT MODEL, 2022(%)
- FIGURE 14. COMPARATIVE SHARE ANALYSIS OF INTENT-BASED NETWORKING (IBN) MARKET FOR CLOUD, BY COUNTRY 2022 AND 2032(%)
- FIGURE 15. COMPARATIVE SHARE ANALYSIS OF INTENT-BASED NETWORKING (IBN) MARKET FOR ON-PREMISE, BY COUNTRY 2022 AND 2032(%)
- FIGURE 16. INTENT-BASED NETWORKING (IBN) MARKET, BY ENTERPRISE SIZE, 2022(%)
- FIGURE 17. COMPARATIVE SHARE ANALYSIS OF INTENT-BASED NETWORKING (IBN) MARKET FOR LARGE ENTERPRISE, BY COUNTRY 2022 AND 2032(%)
- FIGURE 18. COMPARATIVE SHARE ANALYSIS OF INTENT-BASED NETWORKING (IBN) MARKET FOR SMALL AND MEDIUM-SIZED ENTERPRISE, BY COUNTRY 2022 AND 2032(%)
- FIGURE 19. INTENT-BASED NETWORKING (IBN) MARKET, BY INDUSTRY VERTICAL, 2022(%)
- FIGURE 20. COMPARATIVE SHARE ANALYSIS OF INTENT-BASED NETWORKING (IBN) MARKET FOR BFSI, BY COUNTRY 2022 AND 2032(%)
- FIGURE 21. COMPARATIVE SHARE ANALYSIS OF INTENT-BASED NETWORKING (IBN) MARKET FOR IT AND TELECOM, BY COUNTRY 2022 AND 2032(%)
- FIGURE 22. COMPARATIVE SHARE ANALYSIS OF INTENT-BASED NETWORKING (IBN) MARKET FOR HEALTHCARE, BY COUNTRY 2022 AND 2032(%)
- FIGURE 23. COMPARATIVE SHARE ANALYSIS OF INTENT-BASED NETWORKING (IBN) MARKET FOR RETAIL AND CONSUMER GOODS, BY COUNTRY 2022 AND 2032(%)
- FIGURE 24. COMPARATIVE SHARE ANALYSIS OF INTENT-BASED NETWORKING (IBN) MARKET FOR GOVERNMENT AND DEFENSE, BY COUNTRY 2022 AND 2032(%)
- FIGURE 25. COMPARATIVE SHARE ANALYSIS OF INTENT-BASED NETWORKING (IBN) MARKET FOR MANUFACTURING, BY COUNTRY 2022 AND 2032(%)
- FIGURE 26. COMPARATIVE SHARE ANALYSIS OF INTENT-BASED NETWORKING (IBN) MARKET FOR OTHERS, BY COUNTRY 2022 AND 2032(%)
- FIGURE 27. INTENT-BASED NETWORKING (IBN) MARKET BY REGION, 2022
- FIGURE 28. U.S. INTENT-BASED NETWORKING (IBN) MARKET, 2022-2032 ($MILLION)
- FIGURE 29. CANADA INTENT-BASED NETWORKING (IBN) MARKET, 2022-2032 ($MILLION)
- FIGURE 30. UK INTENT-BASED NETWORKING (IBN) MARKET, 2022-2032 ($MILLION)
- FIGURE 31. GERMANY INTENT-BASED NETWORKING (IBN) MARKET, 2022-2032 ($MILLION)
- FIGURE 32. FRANCE INTENT-BASED NETWORKING (IBN) MARKET, 2022-2032 ($MILLION)
- FIGURE 33. ITALY INTENT-BASED NETWORKING (IBN) MARKET, 2022-2032 ($MILLION)
- FIGURE 34. SPAIN INTENT-BASED NETWORKING (IBN) MARKET, 2022-2032 ($MILLION)
- FIGURE 35. REST OF EUROPE INTENT-BASED NETWORKING (IBN) MARKET, 2022-2032 ($MILLION)
- FIGURE 36. CHINA INTENT-BASED NETWORKING (IBN) MARKET, 2022-2032 ($MILLION)
- FIGURE 37. INDIA INTENT-BASED NETWORKING (IBN) MARKET, 2022-2032 ($MILLION)
- FIGURE 38. JAPAN INTENT-BASED NETWORKING (IBN) MARKET, 2022-2032 ($MILLION)
- FIGURE 39. AUSTRALIA INTENT-BASED NETWORKING (IBN) MARKET, 2022-2032 ($MILLION)
- FIGURE 40. SOUTH KOREA INTENT-BASED NETWORKING (IBN) MARKET, 2022-2032 ($MILLION)
- FIGURE 41. REST OF ASIA-PACIFIC INTENT-BASED NETWORKING (IBN) MARKET, 2022-2032 ($MILLION)
- FIGURE 42. LATIN AMERICA INTENT-BASED NETWORKING (IBN) MARKET, 2022-2032 ($MILLION)
- FIGURE 43. MIDDLE EAST INTENT-BASED NETWORKING (IBN) MARKET, 2022-2032 ($MILLION)
- FIGURE 44. AFRICA INTENT-BASED NETWORKING (IBN) MARKET, 2022-2032 ($MILLION)
- FIGURE 45. TOP WINNING STRATEGIES, BY YEAR
- FIGURE 46. TOP WINNING STRATEGIES, BY DEVELOPMENT
- FIGURE 47. TOP WINNING STRATEGIES, BY COMPANY
- FIGURE 48. PRODUCT MAPPING OF TOP 10 PLAYERS
- FIGURE 49. COMPETITIVE DASHBOARD
- FIGURE 50. COMPETITIVE HEATMAP: INTENT-BASED NETWORKING (IBN) MARKET
- FIGURE 51. TOP PLAYER POSITIONING, 2022
- FIGURE 52. CISCO SYSTEMS INC.: RESEARCH & DEVELOPMENT EXPENDITURE, 2020-2022 ($MILLION)
- FIGURE 53. CISCO SYSTEMS INC.: NET SALES, 2020-2022 ($MILLION)
- FIGURE 54. CISCO SYSTEMS INC.: REVENUE SHARE BY SEGMENT, 2022 (%)
- FIGURE 55. CISCO SYSTEMS INC.: REVENUE SHARE BY REGION, 2022 (%)
- FIGURE 56. JUNIPER NETWORKS, INC.: NET REVENUE, 2019-2021 ($MILLION)
- FIGURE 57. JUNIPER NETWORKS, INC.: RESEARCH & DEVELOPMENT EXPENDITURE, 2019-2021 ($MILLION)
- FIGURE 58. JUNIPER NETWORKS, INC.: REVENUE SHARE BY REGION, 2021 (%)
- FIGURE 59. IBM CORPORATION: NET REVENUE, 2020-2022 ($MILLION)
- FIGURE 60. IBM CORPORATION: REVENUE SHARE BY SEGMENT, 2022 (%)
- FIGURE 61. IBM CORPORATION: REVENUE SHARE BY REGION, 2021 (%)
- FIGURE 62. HUAWEI TECHNOLOGIES CO., LTD.: NET REVENUE, 2019-2021 ($MILLION)
- FIGURE 63. HUAWEI TECHNOLOGIES CO., LTD.: RESEARCH & DEVELOPMENT EXPENDITURE, 2019-2021 ($MILLION)
- FIGURE 64. HUAWEI TECHNOLOGIES CO., LTD.: REVENUE SHARE BY SEGMENT, 2021 (%)
- FIGURE 65. HUAWEI TECHNOLOGIES CO., LTD.: REVENUE SHARE BY REGION, 2021 (%)
- FIGURE 66. HEWLETT PACKARD ENTERPRISE DEVELOPMENT LP: NET REVENUE, 2019-2021 ($MILLION)
- FIGURE 67. HEWLETT PACKARD ENTERPRISE DEVELOPMENT LP: RESEARCH & DEVELOPMENT EXPENDITURE, 2019-2021
- FIGURE 68. HEWLETT PACKARD ENTERPRISE DEVELOPMENT LP: REVENUE SHARE BY SEGMENT, 2021 (%)
- FIGURE 69. HEWLETT PACKARD ENTERPRISE DEVELOPMENT LP: REVENUE SHARE BY REGION, 2021 (%)
- FIGURE 70. NOKIA: NET SALES, 2020-2022 ($MILLION)
- FIGURE 71. NOKIA: REVENUE SHARE BY SEGMENT, 2021 (%)
- FIGURE 72. NOKIA: REVENUE SHARE BY REGION, 2021 (%)
- FIGURE 73. WIPRO: NET REVENUE, 2020-2022 ($MILLION)
Intent-based networking (IBN) is a software-enabled automation technique that improves network operations and uptime by combining intelligence, analytics, and orchestration. IBN allows for flexible and agile network design that optimizes the quality of service for end-users, using an algorithm that automates much of the process and scales well at a low cost. While traditional approaches to network management can scale up to a certain point, they quickly run into problems as a network grows larger. IBN addresses these issues by automating processes based on intent, providing network administrators tools that make it easier to manage large networks.
Factors such as growing digitalization and increasing adoption of advanced technology such as IoT and cloud-based services across the world are positively impacting the growth of the IBN market. In addition, the increase in adoption of intent-based networking (IBN) solution across businesses to enhance operation & productivity, is anticipated to propel the growth of the market in future. Furthermore, increase in investments in various sectors such as BFSI, healthcare and other sectors is expected to provide lucrative growth opportunities for the market during the forecast period. Moreover, IBN solution helps reduce costs and provide high security to the application with the help of AI and ML algorithms. Such benefits are predicted to create numerous opportunities for market growth in the upcoming years. However, the IBN system has a complex design as it is a combination of several operating systems, environments, and network components, and high investment cost, are expected to hamper the growth of the market.
The intent-based networking (IBN) market is segmented into component, deployment mode, enterprise size, industry vertical, and region. By component, it is bifurcated into solution and service. By deployment mode, it is divided into on-premise and cloud. By enterprise size, the market is segregated into small & medium-sized enterprises and large enterprises. By industry vertical, the market is classified into BFSI, IT and telecom, healthcare, retail & consumer goods, government & defense, manufacturing, and others. Region wise, the market is analyzed across North America, Europe, Asia-Pacific, and LAMEA.
The market players operating in the intent-based networking (IBN) market are: Cisco Systems, Inc., Juniper Networks, Inc., Huawei Technologies Co., Ltd., Hewlett Packard Enterprise Development LP, NetBrain Technologies, IBM Corporation, Gluware, Wipro, Forward Networks, Inc. and Nokia Corporation. These major players have adopted various key development strategies such as business expansion, new product launches, and partnerships, which help to drive the growth of the intent-based networking (IBN) market globally.
KEY BENEFITS FOR STAKEHOLDERS
- The study provides an in-depth analysis of the global intent-based networking market forecast along with the current & future trends to explain the imminent investment pockets.
- Information about key drivers, restraints, & opportunities and their impact analysis on global intent-based networking control market trends is provided in the report.
- Porter's five forces analysis illustrates the potency of the buyers and suppliers operating in the industry.
- The quantitative analysis of the market from 2022 to 2032 is provided to determine the market potential.
Key Market Segments
By Component
- Solution
- Service
By Deployment model
- Cloud
- On-Premise
By Enterprise Size
- Large Enterprise
- Small and Medium-sized Enterprise
By Industry Vertical
- BFSI
- IT and Telecom
- Healthcare
- Retail and Consumer Goods
- Government and Defense
- Manufacturing
- Others
By Region
- North America
- U.S.
- Canada
- Europe
- UK
- Germany
- France
- Italy
- Spain
- Rest of Europe
- Asia-Pacific
- China
- India
- Japan
- Australia
- South Korea
- Rest of Asia-Pacific
- LAMEA
- Latin America
- Middle East
- Africa
Key Market Players:
- Cisco Systems Inc.
- Forward Networks, Inc.
- Gluware
- Hewlett Packard Enterprise Development LP
- Huawei Technologies Co., Ltd.
- IBM Corporation
- Juniper Networks, Inc.
- NetBrain Technologies
- Nokia
- wipro
TABLE OF CONTENTS
CHAPTER 1: INTRODUCTION
- 1.1. Report description
- 1.2. Key market segments
- 1.3. Key benefits to the stakeholders
- 1.4. Research Methodology
- 1.4.1. Primary research
- 1.4.2. Secondary research
- 1.4.3. Analyst tools and models
CHAPTER 2: EXECUTIVE SUMMARY
- 2.1. CXO Perspective
CHAPTER 3: MARKET OVERVIEW
- 3.1. Market definition and scope
- 3.2. Key findings
- 3.2.1. Top impacting factors
- 3.2.2. Top investment pockets
- 3.3. Porter's five forces analysis
- 3.3.1. Bargaining power of suppliers
- 3.3.2. Bargaining power of buyers
- 3.3.3. Threat of substitutes
- 3.3.4. Threat of new entrants
- 3.3.5. Intensity of rivalry
- 3.4. Market dynamics
- 3.4.1. Drivers
- 3.4.1.1. Rise in demand for software-enabled automation process
- 3.4.1.2. Increase in adoption of cloud-based services
- 3.4.1.3. Increase in use of connected devices
- 3.4.1. Drivers
- 3.4.2. Restraints
- 3.4.2.1. Complex design of an intent-based networking system
- 3.4.2.2. High cost of innovation and budget constraints
- 3.4.3. Opportunities
- 3.4.3.1. Growing adaptation of advanced technologies such as AI, ML, IoT
- 3.4.3.2. Surge in demand for enhanced network security
- 3.5. COVID-19 Impact Analysis on the market
CHAPTER 4: INTENT-BASED NETWORKING (IBN) MARKET, BY COMPONENT
- 4.1. Overview
- 4.1.1. Market size and forecast
- 4.2. Solution
- 4.2.1. Key market trends, growth factors and opportunities
- 4.2.2. Market size and forecast, by region
- 4.2.3. Market share analysis by country
- 4.3. Service
- 4.3.1. Key market trends, growth factors and opportunities
- 4.3.2. Market size and forecast, by region
- 4.3.3. Market share analysis by country
CHAPTER 5: INTENT-BASED NETWORKING (IBN) MARKET, BY DEPLOYMENT MODEL
- 5.1. Overview
- 5.1.1. Market size and forecast
- 5.2. Cloud
- 5.2.1. Key market trends, growth factors and opportunities
- 5.2.2. Market size and forecast, by region
- 5.2.3. Market share analysis by country
- 5.3. On-Premise
- 5.3.1. Key market trends, growth factors and opportunities
- 5.3.2. Market size and forecast, by region
- 5.3.3. Market share analysis by country
CHAPTER 6: INTENT-BASED NETWORKING (IBN) MARKET, BY ENTERPRISE SIZE
- 6.1. Overview
- 6.1.1. Market size and forecast
- 6.2. Large Enterprise
- 6.2.1. Key market trends, growth factors and opportunities
- 6.2.2. Market size and forecast, by region
- 6.2.3. Market share analysis by country
- 6.3. Small and Medium-sized Enterprise
- 6.3.1. Key market trends, growth factors and opportunities
- 6.3.2. Market size and forecast, by region
- 6.3.3. Market share analysis by country
CHAPTER 7: INTENT-BASED NETWORKING (IBN) MARKET, BY INDUSTRY VERTICAL
- 7.1. Overview
- 7.1.1. Market size and forecast
- 7.2. BFSI
- 7.2.1. Key market trends, growth factors and opportunities
- 7.2.2. Market size and forecast, by region
- 7.2.3. Market share analysis by country
- 7.3. IT and Telecom
- 7.3.1. Key market trends, growth factors and opportunities
- 7.3.2. Market size and forecast, by region
- 7.3.3. Market share analysis by country
- 7.4. Healthcare
- 7.4.1. Key market trends, growth factors and opportunities
- 7.4.2. Market size and forecast, by region
- 7.4.3. Market share analysis by country
- 7.5. Retail and Consumer Goods
- 7.5.1. Key market trends, growth factors and opportunities
- 7.5.2. Market size and forecast, by region
- 7.5.3. Market share analysis by country
- 7.6. Government and Defense
- 7.6.1. Key market trends, growth factors and opportunities
- 7.6.2. Market size and forecast, by region
- 7.6.3. Market share analysis by country
- 7.7. Manufacturing
- 7.7.1. Key market trends, growth factors and opportunities
- 7.7.2. Market size and forecast, by region
- 7.7.3. Market share analysis by country
- 7.8. Others
- 7.8.1. Key market trends, growth factors and opportunities
- 7.8.2. Market size and forecast, by region
- 7.8.3. Market share analysis by country
CHAPTER 8: INTENT-BASED NETWORKING (IBN) MARKET, BY REGION
- 8.1. Overview
- 8.1.1. Market size and forecast By Region
- 8.2. North America
- 8.2.1. Key trends and opportunities
- 8.2.2. Market size and forecast, by Component
- 8.2.3. Market size and forecast, by Deployment model
- 8.2.4. Market size and forecast, by Enterprise Size
- 8.2.5. Market size and forecast, by Industry Vertical
- 8.2.6. Market size and forecast, by country
- 8.2.6.1. U.S.
- 8.2.6.1.1. Key market trends, growth factors and opportunities
- 8.2.6.1.2. Market size and forecast, by Component
- 8.2.6.1.3. Market size and forecast, by Deployment model
- 8.2.6.1.4. Market size and forecast, by Enterprise Size
- 8.2.6.1.5. Market size and forecast, by Industry Vertical
- 8.2.6.2. Canada
- 8.2.6.2.1. Key market trends, growth factors and opportunities
- 8.2.6.2.2. Market size and forecast, by Component
- 8.2.6.2.3. Market size and forecast, by Deployment model
- 8.2.6.2.4. Market size and forecast, by Enterprise Size
- 8.2.6.2.5. Market size and forecast, by Industry Vertical
- 8.3. Europe
- 8.3.1. Key trends and opportunities
- 8.3.2. Market size and forecast, by Component
- 8.3.3. Market size and forecast, by Deployment model
- 8.3.4. Market size and forecast, by Enterprise Size
- 8.3.5. Market size and forecast, by Industry Vertical
- 8.3.6. Market size and forecast, by country
- 8.3.6.1. UK
- 8.3.6.1.1. Key market trends, growth factors and opportunities
- 8.3.6.1.2. Market size and forecast, by Component
- 8.3.6.1.3. Market size and forecast, by Deployment model
- 8.3.6.1.4. Market size and forecast, by Enterprise Size
- 8.3.6.1.5. Market size and forecast, by Industry Vertical
- 8.3.6.2. Germany
- 8.3.6.2.1. Key market trends, growth factors and opportunities
- 8.3.6.2.2. Market size and forecast, by Component
- 8.3.6.2.3. Market size and forecast, by Deployment model
- 8.3.6.2.4. Market size and forecast, by Enterprise Size
- 8.3.6.2.5. Market size and forecast, by Industry Vertical
- 8.3.6.3. France
- 8.3.6.3.1. Key market trends, growth factors and opportunities
- 8.3.6.3.2. Market size and forecast, by Component
- 8.3.6.3.3. Market size and forecast, by Deployment model
- 8.3.6.3.4. Market size and forecast, by Enterprise Size
- 8.3.6.3.5. Market size and forecast, by Industry Vertical
- 8.3.6.4. Italy
- 8.3.6.4.1. Key market trends, growth factors and opportunities
- 8.3.6.4.2. Market size and forecast, by Component
- 8.3.6.4.3. Market size and forecast, by Deployment model
- 8.3.6.4.4. Market size and forecast, by Enterprise Size
- 8.3.6.4.5. Market size and forecast, by Industry Vertical
- 8.3.6.5. Spain
- 8.3.6.5.1. Key market trends, growth factors and opportunities
- 8.3.6.5.2. Market size and forecast, by Component
- 8.3.6.5.3. Market size and forecast, by Deployment model
- 8.3.6.5.4. Market size and forecast, by Enterprise Size
- 8.3.6.5.5. Market size and forecast, by Industry Vertical
- 8.3.6.6. Rest of Europe
- 8.3.6.6.1. Key market trends, growth factors and opportunities
- 8.3.6.6.2. Market size and forecast, by Component
- 8.3.6.6.3. Market size and forecast, by Deployment model
- 8.3.6.6.4. Market size and forecast, by Enterprise Size
- 8.3.6.6.5. Market size and forecast, by Industry Vertical
- 8.4. Asia-Pacific
- 8.4.1. Key trends and opportunities
- 8.4.2. Market size and forecast, by Component
- 8.4.3. Market size and forecast, by Deployment model
- 8.4.4. Market size and forecast, by Enterprise Size
- 8.4.5. Market size and forecast, by Industry Vertical
- 8.4.6. Market size and forecast, by country
- 8.4.6.1. China
- 8.4.6.1.1. Key market trends, growth factors and opportunities
- 8.4.6.1.2. Market size and forecast, by Component
- 8.4.6.1.3. Market size and forecast, by Deployment model
- 8.4.6.1.4. Market size and forecast, by Enterprise Size
- 8.4.6.1.5. Market size and forecast, by Industry Vertical
- 8.4.6.2. India
- 8.4.6.2.1. Key market trends, growth factors and opportunities
- 8.4.6.2.2. Market size and forecast, by Component
- 8.4.6.2.3. Market size and forecast, by Deployment model
- 8.4.6.2.4. Market size and forecast, by Enterprise Size
- 8.4.6.2.5. Market size and forecast, by Industry Vertical
- 8.4.6.3. Japan
- 8.4.6.3.1. Key market trends, growth factors and opportunities
- 8.4.6.3.2. Market size and forecast, by Component
- 8.4.6.3.3. Market size and forecast, by Deployment model
- 8.4.6.3.4. Market size and forecast, by Enterprise Size
- 8.4.6.3.5. Market size and forecast, by Industry Vertical
- 8.4.6.4. Australia
- 8.4.6.4.1. Key market trends, growth factors and opportunities
- 8.4.6.4.2. Market size and forecast, by Component
- 8.4.6.4.3. Market size and forecast, by Deployment model
- 8.4.6.4.4. Market size and forecast, by Enterprise Size
- 8.4.6.4.5. Market size and forecast, by Industry Vertical
- 8.4.6.5. South Korea
- 8.4.6.5.1. Key market trends, growth factors and opportunities
- 8.4.6.5.2. Market size and forecast, by Component
- 8.4.6.5.3. Market size and forecast, by Deployment model
- 8.4.6.5.4. Market size and forecast, by Enterprise Size
- 8.4.6.5.5. Market size and forecast, by Industry Vertical
- 8.4.6.6. Rest of Asia-Pacific
- 8.4.6.6.1. Key market trends, growth factors and opportunities
- 8.4.6.6.2. Market size and forecast, by Component
- 8.4.6.6.3. Market size and forecast, by Deployment model
- 8.4.6.6.4. Market size and forecast, by Enterprise Size
- 8.4.6.6.5. Market size and forecast, by Industry Vertical
- 8.5. LAMEA
- 8.5.1. Key trends and opportunities
- 8.5.2. Market size and forecast, by Component
- 8.5.3. Market size and forecast, by Deployment model
- 8.5.4. Market size and forecast, by Enterprise Size
- 8.5.5. Market size and forecast, by Industry Vertical
- 8.5.6. Market size and forecast, by country
- 8.5.6.1. Latin America
- 8.5.6.1.1. Key market trends, growth factors and opportunities
- 8.5.6.1.2. Market size and forecast, by Component
- 8.5.6.1.3. Market size and forecast, by Deployment model
- 8.5.6.1.4. Market size and forecast, by Enterprise Size
- 8.5.6.1.5. Market size and forecast, by Industry Vertical
- 8.5.6.2. Middle East
- 8.5.6.2.1. Key market trends, growth factors and opportunities
- 8.5.6.2.2. Market size and forecast, by Component
- 8.5.6.2.3. Market size and forecast, by Deployment model
- 8.5.6.2.4. Market size and forecast, by Enterprise Size
- 8.5.6.2.5. Market size and forecast, by Industry Vertical
- 8.5.6.3. Africa
- 8.5.6.3.1. Key market trends, growth factors and opportunities
- 8.5.6.3.2. Market size and forecast, by Component
- 8.5.6.3.3. Market size and forecast, by Deployment model
- 8.5.6.3.4. Market size and forecast, by Enterprise Size
- 8.5.6.3.5. Market size and forecast, by Industry Vertical
CHAPTER 9: COMPETITIVE LANDSCAPE
- 9.1. Introduction
- 9.2. Top winning strategies
- 9.3. Product Mapping of Top 10 Player
- 9.4. Competitive Dashboard
- 9.5. Competitive Heatmap
- 9.6. Top player positioning, 2022
CHAPTER 10: COMPANY PROFILES
- 10.1. Cisco Systems Inc.
- 10.1.1. Company overview
- 10.1.2. Key Executives
- 10.1.3. Company snapshot
- 10.1.4. Operating business segments
- 10.1.5. Product portfolio
- 10.1.6. Business performance
- 10.1.7. Key strategic moves and developments
- 10.2. Juniper Networks, Inc.
- 10.2.1. Company overview
- 10.2.2. Key Executives
- 10.2.3. Company snapshot
- 10.2.4. Operating business segments
- 10.2.5. Product portfolio
- 10.2.6. Business performance
- 10.2.7. Key strategic moves and developments
- 10.3. IBM Corporation
- 10.3.1. Company overview
- 10.3.2. Key Executives
- 10.3.3. Company snapshot
- 10.3.4. Operating business segments
- 10.3.5. Product portfolio
- 10.3.6. Business performance
- 10.3.7. Key strategic moves and developments
- 10.4. Huawei Technologies Co., Ltd.
- 10.4.1. Company overview
- 10.4.2. Key Executives
- 10.4.3. Company snapshot
- 10.4.4. Operating business segments
- 10.4.5. Product portfolio
- 10.4.6. Business performance
- 10.4.7. Key strategic moves and developments
- 10.5. Hewlett Packard Enterprise Development LP
- 10.5.1. Company overview
- 10.5.2. Key Executives
- 10.5.3. Company snapshot
- 10.5.4. Operating business segments
- 10.5.5. Product portfolio
- 10.5.6. Business performance
- 10.5.7. Key strategic moves and developments
- 10.6. Nokia
- 10.6.1. Company overview
- 10.6.2. Key Executives
- 10.6.3. Company snapshot
- 10.6.4. Operating business segments
- 10.6.5. Product portfolio
- 10.6.6. Business performance
- 10.6.7. Key strategic moves and developments
- 10.7. wipro
- 10.7.1. Company overview
- 10.7.2. Key Executives
- 10.7.3. Company snapshot
- 10.7.4. Operating business segments
- 10.7.5. Product portfolio
- 10.7.6. Business performance
- 10.7.7. Key strategic moves and developments
- 10.8. Gluware
- 10.8.1. Company overview
- 10.8.2. Key Executives
- 10.8.3. Company snapshot
- 10.8.4. Operating business segments
- 10.8.5. Product portfolio
- 10.8.6. Key strategic moves and developments
- 10.9. Forward Networks, Inc.
- 10.9.1. Company overview
- 10.9.2. Key Executives
- 10.9.3. Company snapshot
- 10.9.4. Operating business segments
- 10.9.5. Product portfolio
- 10.9.6. Key strategic moves and developments
- 10.10. NetBrain Technologies
- 10.10.1. Company overview
- 10.10.2. Key Executives
- 10.10.3. Company snapshot
- 10.10.4. Operating business segments
- 10.10.5. Product portfolio
- 10.10.6. Key strategic moves and developments