|
|
市場調査レポート
商品コード
1239562
核融合エネルギー市場:技術別(慣性閉じ込め、磁気閉じ込め)、燃料別(重水素トリチウム、重水素、重水素ヘリウム3、プロトン-ボロン):世界の機会分析と産業予測、2030-2040年Fusion Energy Market By Technology (Inertial Confinement, Magnetic Confinement), By Fuels (Deuterium tritium, Deuterium, Deuterium helium 3, Proton Boron): Global Opportunity Analysis and Industry Forecast, 2030-2040 |
||||||
|
|
|||||||


| 核融合エネルギー市場:技術別(慣性閉じ込め、磁気閉じ込め)、燃料別(重水素トリチウム、重水素、重水素ヘリウム3、プロトン-ボロン):世界の機会分析と産業予測、2030-2040年 |
|
出版日: 2023年01月01日
発行: Allied Market Research
ページ情報: 英文 182 Pages
納期: 2~3営業日
|
- 全表示
- 概要
- 図表
- 目次
核融合エネルギー市場は、2030年に4,296億米ドルと推定され、2040年には8,403億米ドルに達すると予測されています。
2031年から2040年までのCAGRは6.9%で成長すると予測されています。
核融合エネルギーは、炭素排出量が正味ゼロであり、自然の救世主になると予言されています。核融合エネルギーは実験段階にあり、異なるアプローチ(主に2つのアプローチ)でエネルギー生成が行われます。核融合エネルギーは実験段階にあり、さまざまなアプローチ(主に2つのアプローチ)でエネルギーが生成されます。主に適用されるいくつかの技術は、トカマクとステラレータをベースにしています。現在、約60台のトカマクと10台のステラレータが、連続的な核融合エネルギー生成のために稼働しています。核融合エネルギー市場は黎明期です。天然ガスの埋蔵量が世界的に偏在しているため、供給者にとっては非常に有利な市場です。市場の抑制要因が大きいため、主要プレーヤー間の製品差別化が低いです。このように、前述の要因を分析すると、供給企業の交渉力は高いです。さらに、核融合エネルギー市場では、限られた民間企業や機関が、化石燃料や他の再生可能・非再生可能燃料のエネルギー源と競争しなければならないため、市場の競争は激しくなっています。既存の特性を強化するための研究開発への設備投資が高いです。設備投資が多いため、核融合エネルギー市場の技術革新が進み、競争力が高いです。したがって、この市場では競争企業間の敵対関係は高いです。
研究会社や研究機関は、磁気閉じ込め核融合で大きな進歩を遂げ、非常に高い温度のプラズマを容易に実現しました。プラズマを扱うための強力な磁石や、原子炉容器の厳しい条件に耐えられる新素材の開拓は、核融合エネルギー市場の成長を後押ししています。実験、理論、モデリング、シミュレーションの進歩により、プラズマの挙動がより深く理解され、トカマクやステラレータの実験装置は、核融合エネルギー生産の科学的・技術的実現可能性を証明するための中心的存在となるでしょう。最近の資金調達ラウンドでは、多くの企業が2025年までに核融合エネルギーが商業的に利用できるようになると主張しています。エネルギー省プリンストンプラズマ物理研究所のスティーブ・カウリー所長によると、2021年は核融合エネルギー産業にとって驚くべき年であったと指摘しました。また、実験中に燃料を約1億度に保つためのエネルギーを、初めて核融合燃焼が提供したことにも触れました。
慣性閉じ込め方式は、水爆に使われているものと似ています。これは、少量の燃料を連続的に圧縮して加熱するものです。これにより、燃料の圧力が高くなります。高圧のため、燃料は分解して爆発します。しかし、燃料の慣性力によって燃料が逃げないため、慣性閉じ込めと呼ばれます。磁気閉じ込め方式は、核融合エネルギー業界のプレーヤーによって高度に採用されています。トカマクとステラレータは、核融合エネルギーという1つのソリューションに対して2つの方法、またはアプローチシステムであり、実験中の2つの異なる原子炉です。
核融合エネルギー市場は、技術、燃料、地域によって区分されます。技術によって、市場は慣性閉じ込めと磁気閉じ込めに分けられます。燃料によって、重水素トリチウム、重水素、重水素ヘリウム3、陽子ホウ素に分けられます。地域別に見ると、核融合エネルギー市場は、北米、欧州、アジア太平洋、LAMEA(中南米、中東・アフリカ)で分析されています。
市場促進要因、抑制要因、市場機会については、市場力学をより理解するために本レポートで説明しています。さらに本レポートでは、主要な投資分野を紹介しています。さらに、業界の競合シナリオと各ステークホルダーの役割を理解するためのポーターのファイブフォース分析も含まれています。本レポートでは、主要な市場関係者が市場での足場を維持するために採用した戦略を特集しています。さらに、市場シェアを拡大し、業界内の激しい競争を維持するために、主要企業の競合情勢をハイライトしています。
目次
第1章 イントロダクション
第2章 エグゼクティブサマリー
第3章 市場の概要
- 市場の定義と範囲
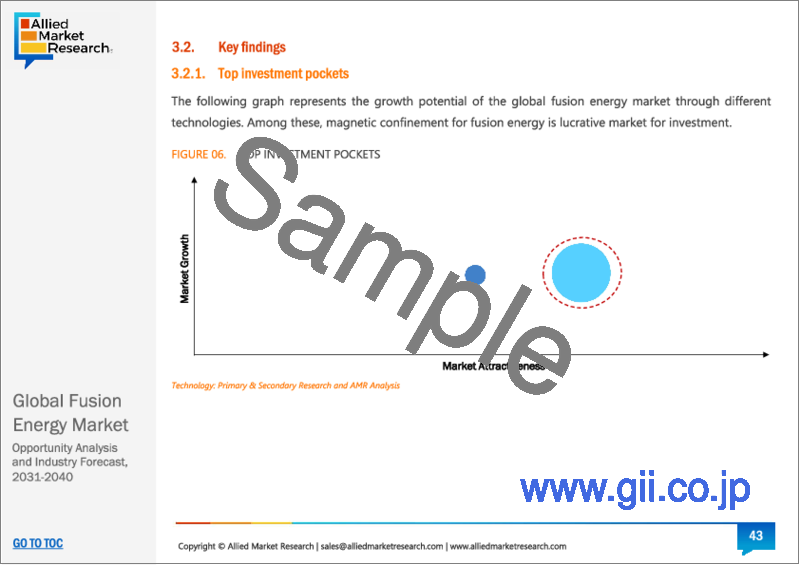
- 主な調査結果
- トップインパクトファクター
- トップインベストメントポケット
- ポーターのファイブフォース分析
- 供給企業の交渉力
- 買い手の交渉力
- 代替品の脅威
- 新規参入業者の脅威
- ライバルの強さ
- 市場力学
- 促進要因
- サステイナビリティ
- 豊かなエネルギー
- コスト競争力のあるエネルギー
- 抑制要因
- 核融合反応の持続を保証するアプローチはない
- 放射性廃棄物
- 機会
- エネルギー再生可能な資源へのシフト
- 促進要因
- COVID-19市場への影響度分析
- 主要レギュレーション分析
- 特許の情勢
- バリューチェーン分析
第4章 核融合エネルギー市場:技術別
- 概要
- 市場規模・予測
- 慣性閉じ込め
- 主な市場動向、成長要因、機会について
- 市場規模・予測:地域別
- 市場シェア分析:国別分析
- 磁気閉じ込め
- 主な市場動向、成長要因、機会について
- 市場規模・予測:地域別
- 市場シェア分析:国別分析
第5章 核融合エネルギー市場:燃料別
- 概要
- 市場規模・予測
- 重水素トリチウム
- 主な市場動向、成長要因、機会について
- 市場規模・予測:地域別
- 市場シェア分析:国別分析
- 重水素
- 主な市場動向、成長要因、機会について
- 市場規模・予測:地域別
- 市場シェア分析:国別分析
- 重水素ヘリウム3
- 主な市場動向、成長要因、機会について
- 市場規模・予測:地域別
- 市場シェア分析:国別分析
- プロトンボロン
- 主な市場動向、成長要因、機会について
- 市場規模・予測:地域別
- 市場シェア分析:国別分析
第6章 核融合エネルギー市場:地域別
- 概要
- 市場規模・予測:地域別
- 北米
- 主な動向と機会
- 市場規模・予測:技術別
- 市場規模・予測:燃料別
- 市場規模・予測:国別
- 米国
- 主な市場動向、成長要因、機会について
- 市場規模・予測:技術別
- 市場規模・予測:燃料別
- カナダ
- 主な市場動向、成長要因、機会について
- 市場規模・予測:技術別
- 市場規模・予測:燃料別
- メキシコ
- 主な市場動向、成長要因、機会について
- 市場規模・予測:技術別
- 市場規模・予測:燃料別
- 欧州
- 主な動向と機会
- 市場規模・予測:技術別
- 市場規模・予測:燃料別
- 市場規模・予測:国別
- ドイツ
- 主な市場動向、成長要因、機会について
- 市場規模・予測:技術別
- 市場規模・予測:燃料別
- 英国
- 主な市場動向、成長要因、機会について
- 市場規模・予測:技術別
- 市場規模・予測:燃料別
- フランス
- 主な市場動向、成長要因、機会について
- 市場規模・予測:技術別
- 市場規模・予測:燃料別
- イタリア
- 主な市場動向、成長要因、機会について
- 市場規模・予測:技術別
- 市場規模・予測:燃料別
- スペイン
- 主な市場動向、成長要因、機会について
- 市場規模・予測:技術別
- 市場規模・予測:燃料別
- その他欧州
- 主な市場動向、成長要因、機会について
- 市場規模・予測:技術別
- 市場規模・予測:燃料別
- アジア太平洋地域
- 主な動向と機会
- 市場規模・予測:技術別
- 市場規模・予測:燃料別
- 市場規模・予測:国別
- 中国
- 主な市場動向、成長要因、機会について
- 市場規模・予測:技術別
- 市場規模・予測:燃料別
- 日本
- 主な市場動向、成長要因、機会について
- 市場規模・予測:技術別
- 市場規模・予測:燃料別
- インド
- 主な市場動向、成長要因、機会について
- 市場規模・予測:技術別
- 市場規模・予測:燃料別
- 韓国
- 主な市場動向、成長要因、機会について
- 市場規模・予測:技術別
- 市場規模・予測:燃料別
- オーストラリア
- 主な市場動向、成長要因、機会について
- 市場規模・予測:技術別
- 市場規模・予測:燃料別
- その他アジア太平洋地域
- 主な市場動向、成長要因、機会について
- 市場規模・予測:技術別
- 市場規模・予測:燃料別
- LAMEA
- 主な動向と機会
- 市場規模・予測:技術別
- 市場規模・予測:燃料別
- 市場規模・予測:国別
- ブラジル
- 主な市場動向、成長要因、機会について
- 市場規模・予測:技術別
- 市場規模・予測:燃料別
- サウジアラビア
- 主な市場動向、成長要因、機会について
- 市場規模・予測:技術別
- 市場規模・予測:燃料別
- 南アフリカ
- 主な市場動向、成長要因、機会について
- 市場規模・予測:技術別
- 市場規模・予測:燃料別
- LAMEAの残りの地域
- 主な市場動向、成長要因、機会について
- 市場規模・予測:技術別
- 市場規模・予測:燃料別
第7章 競合情勢
- イントロダクション
- 主要成功戦略
- 主要10社の製品マッピング
- 競合ダッシュボード
- 競合ヒートマップ
- トップ企業のポジショニング、2030年
第8章 企業プロファイル
- Agni Fusion Energy
- TAE Technologies, Inc.
- Helion Energy Inc.
- Commonwealth Fusion Systems
- General Fusion
- Tokamak Energy Ltd.
- Zap Energy Inc.
- First Light Fusion
- Lockheed Martin Corporation
- Hyperjet Fusion Corporation
- HB11 Energy Holdings Pty Ltd
- Renaissance Fusion
- Marvel Fusion
- Kyoto Fusioneering Ltd.
LIST OF TABLES
- TABLE 01. GLOBAL FUSION ENERGY MARKET, BY TECHNOLOGY, 2030-2040 (REVENUE, $BILLION)
- TABLE 02. FUSION ENERGY MARKET FOR INERTIAL CONFINEMENT, BY REGION, 2030-2040 (REVENUE, $BILLION)
- TABLE 03. FUSION ENERGY MARKET FOR MAGNETIC CONFINEMENT, BY REGION, 2030-2040 (REVENUE, $BILLION)
- TABLE 04. GLOBAL FUSION ENERGY MARKET, BY FUELS, 2030-2040 (REVENUE, $BILLION)
- TABLE 05. FUSION ENERGY MARKET FOR DEUTERIUM TRITIUM, BY REGION, 2030-2040 (REVENUE, $BILLION)
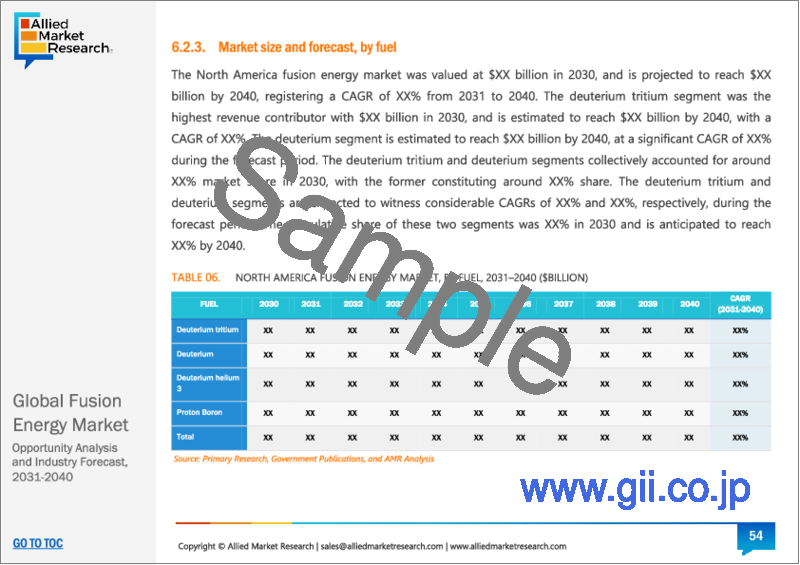
- TABLE 06. FUSION ENERGY MARKET FOR DEUTERIUM, BY REGION, 2030-2040 (REVENUE, $BILLION)
- TABLE 07. FUSION ENERGY MARKET FOR DEUTERIUM HELIUM 3, BY REGION, 2030-2040 (REVENUE, $BILLION)
- TABLE 08. FUSION ENERGY MARKET FOR PROTON BORON, BY REGION, 2030-2040 (REVENUE, $BILLION)
- TABLE 09. FUSION ENERGY MARKET, BY REGION, 2030-2040 (REVENUE, $BILLION)
- TABLE 10. NORTH AMERICA FUSION ENERGY MARKET, BY TECHNOLOGY, 2030-2040 (REVENUE, $BILLION)
- TABLE 11. NORTH AMERICA FUSION ENERGY MARKET, BY FUELS, 2030-2040 (REVENUE, $BILLION)
- TABLE 12. NORTH AMERICA FUSION ENERGY MARKET, BY COUNTRY, 2030-2040 (REVENUE, $BILLION)
- TABLE 13. U.S. FUSION ENERGY MARKET, BY TECHNOLOGY, 2030-2040 (REVENUE, $BILLION)
- TABLE 14. U.S. FUSION ENERGY MARKET, BY FUELS, 2030-2040 (REVENUE, $BILLION)
- TABLE 15. CANADA FUSION ENERGY MARKET, BY TECHNOLOGY, 2030-2040 (REVENUE, $BILLION)
- TABLE 16. CANADA FUSION ENERGY MARKET, BY FUELS, 2030-2040 (REVENUE, $BILLION)
- TABLE 17. MEXICO FUSION ENERGY MARKET, BY TECHNOLOGY, 2030-2040 (REVENUE, $BILLION)
- TABLE 18. MEXICO FUSION ENERGY MARKET, BY FUELS, 2030-2040 (REVENUE, $BILLION)
- TABLE 19. EUROPE FUSION ENERGY MARKET, BY TECHNOLOGY, 2030-2040 (REVENUE, $BILLION)
- TABLE 20. EUROPE FUSION ENERGY MARKET, BY FUELS, 2030-2040 (REVENUE, $BILLION)
- TABLE 21. EUROPE FUSION ENERGY MARKET, BY COUNTRY, 2030-2040 (REVENUE, $BILLION)
- TABLE 22. GERMANY FUSION ENERGY MARKET, BY TECHNOLOGY, 2030-2040 (REVENUE, $BILLION)
- TABLE 23. GERMANY FUSION ENERGY MARKET, BY FUELS, 2030-2040 (REVENUE, $BILLION)
- TABLE 24. UK FUSION ENERGY MARKET, BY TECHNOLOGY, 2030-2040 (REVENUE, $BILLION)
- TABLE 25. UK FUSION ENERGY MARKET, BY FUELS, 2030-2040 (REVENUE, $BILLION)
- TABLE 26. FRANCE FUSION ENERGY MARKET, BY TECHNOLOGY, 2030-2040 (REVENUE, $BILLION)
- TABLE 27. FRANCE FUSION ENERGY MARKET, BY FUELS, 2030-2040 (REVENUE, $BILLION)
- TABLE 28. ITALY FUSION ENERGY MARKET, BY TECHNOLOGY, 2030-2040 (REVENUE, $BILLION)
- TABLE 29. ITALY FUSION ENERGY MARKET, BY FUELS, 2030-2040 (REVENUE, $BILLION)
- TABLE 30. SPAIN FUSION ENERGY MARKET, BY TECHNOLOGY, 2030-2040 (REVENUE, $BILLION)
- TABLE 31. SPAIN FUSION ENERGY MARKET, BY FUELS, 2030-2040 (REVENUE, $BILLION)
- TABLE 32. REST OF EUROPE FUSION ENERGY MARKET, BY TECHNOLOGY, 2030-2040 (REVENUE, $BILLION)
- TABLE 33. REST OF EUROPE FUSION ENERGY MARKET, BY FUELS, 2030-2040 (REVENUE, $BILLION)
- TABLE 34. ASIA-PACIFIC FUSION ENERGY MARKET, BY TECHNOLOGY, 2030-2040 (REVENUE, $BILLION)
- TABLE 35. ASIA-PACIFIC FUSION ENERGY MARKET, BY FUELS, 2030-2040 (REVENUE, $BILLION)
- TABLE 36. ASIA-PACIFIC FUSION ENERGY MARKET, BY COUNTRY, 2030-2040 (REVENUE, $BILLION)
- TABLE 37. CHINA FUSION ENERGY MARKET, BY TECHNOLOGY, 2030-2040 (REVENUE, $BILLION)
- TABLE 38. CHINA FUSION ENERGY MARKET, BY FUELS, 2030-2040 (REVENUE, $BILLION)
- TABLE 39. JAPAN FUSION ENERGY MARKET, BY TECHNOLOGY, 2030-2040 (REVENUE, $BILLION)
- TABLE 40. JAPAN FUSION ENERGY MARKET, BY FUELS, 2030-2040 (REVENUE, $BILLION)
- TABLE 41. INDIA FUSION ENERGY MARKET, BY TECHNOLOGY, 2030-2040 (REVENUE, $BILLION)
- TABLE 42. INDIA FUSION ENERGY MARKET, BY FUELS, 2030-2040 (REVENUE, $BILLION)
- TABLE 43. SOUTH KOREA FUSION ENERGY MARKET, BY TECHNOLOGY, 2030-2040 (REVENUE, $BILLION)
- TABLE 44. SOUTH KOREA FUSION ENERGY MARKET, BY FUELS, 2030-2040 (REVENUE, $BILLION)
- TABLE 45. AUSTRALIA FUSION ENERGY MARKET, BY TECHNOLOGY, 2030-2040 (REVENUE, $BILLION)
- TABLE 46. AUSTRALIA FUSION ENERGY MARKET, BY FUELS, 2030-2040 (REVENUE, $BILLION)
- TABLE 47. REST OF ASIA-PACIFIC FUSION ENERGY MARKET, BY TECHNOLOGY, 2030-2040 (REVENUE, $BILLION)
- TABLE 48. REST OF ASIA-PACIFIC FUSION ENERGY MARKET, BY FUELS, 2030-2040 (REVENUE, $BILLION)
- TABLE 49. LAMEA FUSION ENERGY MARKET, BY TECHNOLOGY, 2030-2040 (REVENUE, $BILLION)
- TABLE 50. LAMEA FUSION ENERGY MARKET, BY FUELS, 2030-2040 (REVENUE, $BILLION)
- TABLE 51. LAMEA FUSION ENERGY MARKET, BY COUNTRY, 2030-2040 (REVENUE, $BILLION)
- TABLE 52. BRAZIL FUSION ENERGY MARKET, BY TECHNOLOGY, 2030-2040 (REVENUE, $BILLION)
- TABLE 53. BRAZIL FUSION ENERGY MARKET, BY FUELS, 2030-2040 (REVENUE, $BILLION)
- TABLE 54. SAUDI ARABIA FUSION ENERGY MARKET, BY TECHNOLOGY, 2030-2040 (REVENUE, $BILLION)
- TABLE 55. SAUDI ARABIA FUSION ENERGY MARKET, BY FUELS, 2030-2040 (REVENUE, $BILLION)
- TABLE 56. SOUTH AFRICA FUSION ENERGY MARKET, BY TECHNOLOGY, 2030-2040 (REVENUE, $BILLION)
- TABLE 57. SOUTH AFRICA FUSION ENERGY MARKET, BY FUELS, 2030-2040 (REVENUE, $BILLION)
- TABLE 58. REST OF LAMEA FUSION ENERGY MARKET, BY TECHNOLOGY, 2030-2040 (REVENUE, $BILLION)
- TABLE 59. REST OF LAMEA FUSION ENERGY MARKET, BY FUELS, 2030-2040 (REVENUE, $BILLION)
- TABLE 60. AGNI FUSION ENERGY: KEY EXECUTIVES
- TABLE 61. AGNI FUSION ENERGY: COMPANY SNAPSHOT
- TABLE 62. AGNI FUSION ENERGY: SERVICE SEGMENTS
- TABLE 63. AGNI FUSION ENERGY: PRODUCT PORTFOLIO
- TABLE 64. TAE TECHNOLOGIES, INC.: KEY EXECUTIVES
- TABLE 65. TAE TECHNOLOGIES, INC.: COMPANY SNAPSHOT
- TABLE 66. TAE TECHNOLOGIES, INC.: SERVICE SEGMENTS
- TABLE 67. TAE TECHNOLOGIES, INC.: PRODUCT PORTFOLIO
- TABLE 68. HELION ENERGY INC.: KEY EXECUTIVES
- TABLE 69. HELION ENERGY INC.: COMPANY SNAPSHOT
- TABLE 70. HELION ENERGY INC.: SERVICE SEGMENTS
- TABLE 71. HELION ENERGY INC.: PRODUCT PORTFOLIO
- TABLE 72. COMMONWEALTH FUSION SYSTEMS: KEY EXECUTIVES
- TABLE 73. COMMONWEALTH FUSION SYSTEMS: COMPANY SNAPSHOT
- TABLE 74. COMMONWEALTH FUSION SYSTEMS: SERVICE SEGMENTS
- TABLE 75. COMMONWEALTH FUSION SYSTEMS: PRODUCT PORTFOLIO
- TABLE 76. COMMONWEALTH FUSION SYSTEMS: KEY STRATERGIES
- TABLE 77. GENERAL FUSION: KEY EXECUTIVES
- TABLE 78. GENERAL FUSION: COMPANY SNAPSHOT
- TABLE 79. GENERAL FUSION: SERVICE SEGMENTS
- TABLE 80. GENERAL FUSION: PRODUCT PORTFOLIO
- TABLE 81. TOKAMAK ENERGY LTD.: KEY EXECUTIVES
- TABLE 82. TOKAMAK ENERGY LTD.: COMPANY SNAPSHOT
- TABLE 83. TOKAMAK ENERGY LTD.: SERVICE SEGMENTS
- TABLE 84. TOKAMAK ENERGY LTD.: PRODUCT PORTFOLIO
- TABLE 85. ZAP ENERGY INC.: KEY EXECUTIVES
- TABLE 86. ZAP ENERGY INC.: COMPANY SNAPSHOT
- TABLE 87. ZAP ENERGY INC.: SERVICE SEGMENTS
- TABLE 88. ZAP ENERGY INC.: PRODUCT PORTFOLIO
- TABLE 89. FIRST LIGHT FUSION: KEY EXECUTIVES
- TABLE 90. FIRST LIGHT FUSION: COMPANY SNAPSHOT
- TABLE 91. FIRST LIGHT FUSION: SERVICE SEGMENTS
- TABLE 92. FIRST LIGHT FUSION: PRODUCT PORTFOLIO
- TABLE 93. LOCKHEED MARTIN CORPORATION: KEY EXECUTIVES
- TABLE 94. LOCKHEED MARTIN CORPORATION: COMPANY SNAPSHOT
- TABLE 95. LOCKHEED MARTIN CORPORATION: PRODUCT SEGMENTS
- TABLE 96. LOCKHEED MARTIN CORPORATION: PRODUCT PORTFOLIO
- TABLE 97. HYPERJET FUSION CORPORATION: KEY EXECUTIVES
- TABLE 98. HYPERJET FUSION CORPORATION: COMPANY SNAPSHOT
- TABLE 99. HYPERJET FUSION CORPORATION: SERVICE SEGMENTS
- TABLE 100. HYPERJET FUSION CORPORATION: PRODUCT PORTFOLIO
- TABLE 101. HB11 ENERGY HOLDINGS PTY LTD: KEY EXECUTIVES
- TABLE 102. HB11 ENERGY HOLDINGS PTY LTD: COMPANY SNAPSHOT
- TABLE 103. HB11 ENERGY HOLDINGS PTY LTD: SERVICE SEGMENTS
- TABLE 104. HB11 ENERGY HOLDINGS PTY LTD: PRODUCT PORTFOLIO
- TABLE 105. RENAISSANCE FUSION: KEY EXECUTIVES
- TABLE 106. RENAISSANCE FUSION: COMPANY SNAPSHOT
- TABLE 107. RENAISSANCE FUSION: SERVICE SEGMENTS
- TABLE 108. RENAISSANCE FUSION: PRODUCT PORTFOLIO
- TABLE 109. MARVEL FUSION: KEY EXECUTIVES
- TABLE 110. MARVEL FUSION: COMPANY SNAPSHOT
- TABLE 111. MARVEL FUSION: SERVICE SEGMENTS
- TABLE 112. MARVEL FUSION: PRODUCT PORTFOLIO
- TABLE 113. KYOTO FUSIONEERING LTD.: KEY EXECUTIVES
- TABLE 114. KYOTO FUSIONEERING LTD.: COMPANY SNAPSHOT
- TABLE 115. KYOTO FUSIONEERING LTD.: SERVICE SEGMENTS
- TABLE 116. KYOTO FUSIONEERING LTD.: PRODUCT PORTFOLIO
LIST OF FIGURES
- FIGURE 01. FUSION ENERGY MARKET, 2030-2040
- FIGURE 02. SEGMENTATION OF FUSION ENERGY MARKET, 2030-2040
- FIGURE 03. TOP INVESTMENT POCKETS IN FUSION ENERGY MARKET (2030-2040)
- FIGURE 04. LOW BARGAINING POWER OF SUPPLIERS
- FIGURE 05. LOW BARGAINING POWER OF BUYERS
- FIGURE 06. LOW THREAT OF SUBSTITUTES
- FIGURE 07. LOW THREAT OF NEW ENTRANTS
- FIGURE 08. LOW INTENSITY OF RIVALRY
- FIGURE 09. DRIVERS, RESTRAINTS AND OPPORTUNITIES: GLOBALFUSION ENERGY MARKET
- FIGURE 10. IMPACT OF KEY REGULATION: FUSION ENERGY MARKET
- FIGURE 11. PATENT ANALYSIS BY COMPANY
- FIGURE 12. PATENT ANALYSIS BY COUNTRY
- FIGURE 13. VALUE CHAIN ANALYSIS: FUSION ENERGY MARKET
- FIGURE 14. FUSION ENERGY MARKET, BY TECHNOLOGY, 2030(%)
- FIGURE 15. COMPARATIVE SHARE ANALYSIS OF FUSION ENERGY MARKET FOR INERTIAL CONFINEMENT, BY COUNTRY 2030-2040(%)
- FIGURE 16. COMPARATIVE SHARE ANALYSIS OF FUSION ENERGY MARKET FOR MAGNETIC CONFINEMENT, BY COUNTRY 2030-2040(%)
- FIGURE 17. FUSION ENERGY MARKET, BY FUELS, 2030(%)
- FIGURE 18. COMPARATIVE SHARE ANALYSIS OF FUSION ENERGY MARKET FOR DEUTERIUM TRITIUM, BY COUNTRY 2030-2040(%)
- FIGURE 19. COMPARATIVE SHARE ANALYSIS OF FUSION ENERGY MARKET FOR DEUTERIUM, BY COUNTRY 2030-2040(%)
- FIGURE 20. COMPARATIVE SHARE ANALYSIS OF FUSION ENERGY MARKET FOR DEUTERIUM HELIUM 3, BY COUNTRY 2030-2040(%)
- FIGURE 21. COMPARATIVE SHARE ANALYSIS OF FUSION ENERGY MARKET FOR PROTON BORON, BY COUNTRY 2030-2040(%)
- FIGURE 22. FUSION ENERGY MARKET BY REGION, 2030
- FIGURE 23. U.S. FUSION ENERGY MARKET, 2030-2040 ($BILLION)
- FIGURE 24. CANADA FUSION ENERGY MARKET, 2030-2040 ($BILLION)
- FIGURE 25. MEXICO FUSION ENERGY MARKET, 2030-2040 ($BILLION)
- FIGURE 26. GERMANY FUSION ENERGY MARKET, 2030-2040 ($BILLION)
- FIGURE 27. UK FUSION ENERGY MARKET, 2030-2040 ($BILLION)
- FIGURE 28. FRANCE FUSION ENERGY MARKET, 2030-2040 ($BILLION)
- FIGURE 29. ITALY FUSION ENERGY MARKET, 2030-2040 ($BILLION)
- FIGURE 30. SPAIN FUSION ENERGY MARKET, 2030-2040 ($BILLION)
- FIGURE 31. REST OF EUROPE FUSION ENERGY MARKET, 2030-2040 ($BILLION)
- FIGURE 32. CHINA FUSION ENERGY MARKET, 2030-2040 ($BILLION)
- FIGURE 33. JAPAN FUSION ENERGY MARKET, 2030-2040 ($BILLION)
- FIGURE 34. INDIA FUSION ENERGY MARKET, 2030-2040 ($BILLION)
- FIGURE 35. SOUTH KOREA FUSION ENERGY MARKET, 2030-2040 ($BILLION)
- FIGURE 36. AUSTRALIA FUSION ENERGY MARKET, 2030-2040 ($BILLION)
- FIGURE 37. REST OF ASIA-PACIFIC FUSION ENERGY MARKET, 2030-2040 ($BILLION)
- FIGURE 38. BRAZIL FUSION ENERGY MARKET, 2030-2040 ($BILLION)
- FIGURE 39. SAUDI ARABIA FUSION ENERGY MARKET, 2030-2040 ($BILLION)
- FIGURE 40. SOUTH AFRICA FUSION ENERGY MARKET, 2030-2040 ($BILLION)
- FIGURE 41. REST OF LAMEA FUSION ENERGY MARKET, 2030-2040 ($BILLION)
- FIGURE 42. TOP WINNING STRATEGIES, BY YEAR
- FIGURE 43. TOP WINNING STRATEGIES, BY DEVELOPMENT
- FIGURE 44. TOP WINNING STRATEGIES, BY COMPANY
- FIGURE 45. PRODUCT MAPPING OF TOP 10 PLAYERS
- FIGURE 46. COMPETITIVE DASHBOARD
- FIGURE 47. COMPETITIVE HEATMAP: FUSION ENERGY MARKET
- FIGURE 48. TOP PLAYER POSITIONING, 2030
- FIGURE 49. LOCKHEED MARTIN CORPORATION: NET SALES, 2019-2021 ($MILLION)
- FIGURE 50. LOCKHEED MARTIN CORPORATION: RESEARCH & DEVELOPMENT EXPENDITURE, 2019-2021
- FIGURE 51. LOCKHEED MARTIN CORPORATION: REVENUE SHARE BY SEGMENT, 2021 (%)
- FIGURE 52. LOCKHEED MARTIN CORPORATION: REVENUE SHARE BY REGION, 2021 (%)
The fusion energy market is estimated at $429.6 billion in 2030, and is anticipated to generate $840.3 billion by 2040. The market is projected to experience growth at a CAGR of 6.9% from 2031 to 2040.
Fusion energy is believed to have net zero carbon emissions and is prophesied to be the savior of nature. Fusion energy is in the experimental stage where through different approaches (majorly two) energy generation is done. Several technologies which mainly apply are based on Tokomak and stellarator. Around 60 tokamaks and 10 stellarators are currently operating foe continuous fusion energy generation. The fusion energy market is in its nascent stage. The market is highly favorable for suppliers, as natural gas reserves are unevenly distributed across globe. Product differentiation is low among leading players, as the market is significantly constricted. Thus, by analyzing previously mentioned factors, the bargaining power of the supplier is high. Moreover, the presence of limited private players and institutions in the fusion energy market has to compete with energy sources from fossil fuel and other renewable and non-renewable fuel and thus, it makes the market highly competitive. Capital investment in R&D to enhance the existing properties is high. High capital investment makes the fusion energy market highly competitive, as innovation in the field is high. Therefore, the competitive rivalry is high in this market.
Research companies and institution have made great progress in magnetic confinement fusion and have achieved plasmas of very high temperatures with ease. The development of powerful magnets to handle plasmas and novel materials that can withstand the challenging conditions in the reactor vessels drive the fusion energy market growth. Advances in experimentation, theory, modelling, and simulation have led to a deeper understanding of the behavior of plasmas, and experimental tokamak and stellarator devices will be central to proving the scientific and technical viability of fusion energy production. In recent funding round, Many companies have claimed that by 2025 fusion energy will be commercially available. According to Steve Cowley, Director of the Department of Energy's Princeton Plasma Physics Laboratory, noted that 2021 was an amazing year for fusion energy industry. It was also mentioned that for the first-time fusion burn provided the energy to keep the fuel at about 100 million degrees during an experiment.
The inertial confinement approach is similar to what is used in the hydrogen bomb. In this, a small quantity of fuel is continuously compressed and heated. This leads to high pressure in fuel. Due to the high pressure, the fuel disassembles and explodes. The inertia of the fuel itself keeps it from escaping and hence it is named as inertial confinement. Magnetic confinement approach is highly adopted by the fusion energy industry players. Tokamak and stellarator are the two different reactors that are under experiment that is two ways or approaching systems for one solution which is fusion energy.
The fusion energy market is segmented based on technology, fuels, and region. Depending on technology, the market is divided in inertial confinement and magnetic confinement. Based on fuels, it is divided into Deuterium Tritium, Deuterium, Deuterium Helium 3, Proton Boron. Region wise, fusion energy market is analyzed across North America, Europe, Asia-Pacific, and LAMEA (Latin America, Middle East, and Africa). The key players in the market are Agni Fusion Energy, TAE Technologies, Helion Energy, Commonwealth Fusion Systems, General Fusion, Tokamak Energy, Zap Energy, First Light Fusion, Lockheed Martin, Hyperjet Fusion, Marvel Fusion, HB11, Renaissance Fusion, and Kyoto Fusioneering.
The growth drivers, restraints, and opportunities are explained in the report to better understand the market dynamics. This report further highlights the key areas of investments. In addition, it includes Porter's five forces analysis to understand the competitive scenario of the industry and role of each stakeholder. The report features strategies adopted by key market players to maintain their foothold in the market. Furthermore, it highlights the competitive landscape of key players to increase their market share and sustain intense competition in the industry
Key Benefits For Stakeholders
- This report provides a quantitative analysis of the market segments, current trends, estimations, and dynamics of the fusion energy market analysis from 2030 to 2040 to identify the prevailing fusion energy market opportunities.
- The market research is offered along with information related to key drivers, restraints, and opportunities.
- Porter's five forces analysis highlights the potency of buyers and suppliers to enable stakeholders make profit-oriented business decisions and strengthen their supplier-buyer network.
- In-depth analysis of the fusion energy market segmentation assists to determine the prevailing market opportunities.
- Major countries in each region are mapped according to their revenue contribution to the global market.
- Market player positioning facilitates benchmarking and provides a clear understanding of the present position of the market players.
- The report includes the analysis of the regional as well as global fusion energy market trends, key players, market segments, application areas, and market growth strategies.
Key Market Segments
By Technology
- Inertial Confinement
- Magnetic Confinement
By Fuels
- Deuterium tritium
- Deuterium
- Deuterium helium 3
- Proton Boron
By Region
- North America
- U.S.
- Canada
- Mexico
- Europe
- Germany
- UK
- France
- Italy
- Spain
- Rest of Europe
- Asia-Pacific
- China
- Japan
- India
- South Korea
- Australia
- Rest of Asia-Pacific
- LAMEA
- Brazil
- Saudi Arabia
- South Africa
- Rest of LAMEA
Key Market Players
- General Fusion
- Helion Energy Inc.
- Kyoto Fusioneering Ltd.
- Hyperjet Fusion Corporation
- HB11 Energy Holdings Pty Ltd
- Agni Fusion Energy
- First Light Fusion
- Zap Energy Inc.
- TAE Technologies, Inc.
- Tokamak Energy Ltd.
- Marvel Fusion
- Lockheed Martin Corporation
- Commonwealth Fusion Systems
- Renaissance Fusion
TABLE OF CONTENTS
CHAPTER 1: INTRODUCTION
- 1.1. Report description
- 1.2. Key market segments
- 1.3. Key benefits to the stakeholders
- 1.4. Research Methodology
- 1.4.1. Primary research
- 1.4.2. Secondary research
- 1.4.3. Analyst tools and models
CHAPTER 2: EXECUTIVE SUMMARY
- 2.1. CXO Perspective
CHAPTER 3: MARKET OVERVIEW
- 3.1. Market definition and scope
- 3.2. Key findings
- 3.2.1. Top impacting factors
- 3.2.2. Top investment pockets
- 3.3. Porter's five forces analysis
- 3.3.1. Bargaining power of suppliers
- 3.3.2. Bargaining power of buyers
- 3.3.3. Threat of substitutes
- 3.3.4. Threat of new entrants
- 3.3.5. Intensity of rivalry
- 3.4. Market dynamics
- 3.4.1. Drivers
- 3.4.1.1. Sustainability
- 3.4.1.2. Abundant Energy
- 3.4.1.3. Cost-competitve Energy
- 3.4.2. Restraints
- 3.4.2.1. No approach guarantees sustained fusion reaction
- 3.4.2.2. Radio-active wastes
- 3.4.3. Opportunities
- 3.4.3.1. Energy Shift towards renewable resources
- 3.4.1. Drivers
- 3.5. COVID-19 Impact Analysis on the market
- 3.6. Key Regulation Analysis
- 3.7. Patent Landscape
- 3.8. Value Chain Analysis
CHAPTER 4: FUSION ENERGY MARKET, BY TECHNOLOGY
- 4.1. Overview
- 4.1.1. Market size and forecast
- 4.2. Inertial Confinement
- 4.2.1. Key market trends, growth factors and opportunities
- 4.2.2. Market size and forecast, by region
- 4.2.3. Market share analysis by country
- 4.3. Magnetic Confinement
- 4.3.1. Key market trends, growth factors and opportunities
- 4.3.2. Market size and forecast, by region
- 4.3.3. Market share analysis by country
CHAPTER 5: FUSION ENERGY MARKET, BY FUELS
- 5.1. Overview
- 5.1.1. Market size and forecast
- 5.2. Deuterium tritium
- 5.2.1. Key market trends, growth factors and opportunities
- 5.2.2. Market size and forecast, by region
- 5.2.3. Market share analysis by country
- 5.3. Deuterium
- 5.3.1. Key market trends, growth factors and opportunities
- 5.3.2. Market size and forecast, by region
- 5.3.3. Market share analysis by country
- 5.4. Deuterium helium 3
- 5.4.1. Key market trends, growth factors and opportunities
- 5.4.2. Market size and forecast, by region
- 5.4.3. Market share analysis by country
- 5.5. Proton Boron
- 5.5.1. Key market trends, growth factors and opportunities
- 5.5.2. Market size and forecast, by region
- 5.5.3. Market share analysis by country
CHAPTER 6: FUSION ENERGY MARKET, BY REGION
- 6.1. Overview
- 6.1.1. Market size and forecast By Region
- 6.2. North America
- 6.2.1. Key trends and opportunities
- 6.2.2. Market size and forecast, by Technology
- 6.2.3. Market size and forecast, by Fuels
- 6.2.4. Market size and forecast, by country
- 6.2.4.1. U.S.
- 6.2.4.1.1. Key market trends, growth factors and opportunities
- 6.2.4.1.2. Market size and forecast, by Technology
- 6.2.4.1.3. Market size and forecast, by Fuels
- 6.2.4.2. Canada
- 6.2.4.2.1. Key market trends, growth factors and opportunities
- 6.2.4.2.2. Market size and forecast, by Technology
- 6.2.4.2.3. Market size and forecast, by Fuels
- 6.2.4.3. Mexico
- 6.2.4.3.1. Key market trends, growth factors and opportunities
- 6.2.4.3.2. Market size and forecast, by Technology
- 6.2.4.3.3. Market size and forecast, by Fuels
- 6.3. Europe
- 6.3.1. Key trends and opportunities
- 6.3.2. Market size and forecast, by Technology
- 6.3.3. Market size and forecast, by Fuels
- 6.3.4. Market size and forecast, by country
- 6.3.4.1. Germany
- 6.3.4.1.1. Key market trends, growth factors and opportunities
- 6.3.4.1.2. Market size and forecast, by Technology
- 6.3.4.1.3. Market size and forecast, by Fuels
- 6.3.4.2. UK
- 6.3.4.2.1. Key market trends, growth factors and opportunities
- 6.3.4.2.2. Market size and forecast, by Technology
- 6.3.4.2.3. Market size and forecast, by Fuels
- 6.3.4.3. France
- 6.3.4.3.1. Key market trends, growth factors and opportunities
- 6.3.4.3.2. Market size and forecast, by Technology
- 6.3.4.3.3. Market size and forecast, by Fuels
- 6.3.4.4. Italy
- 6.3.4.4.1. Key market trends, growth factors and opportunities
- 6.3.4.4.2. Market size and forecast, by Technology
- 6.3.4.4.3. Market size and forecast, by Fuels
- 6.3.4.5. Spain
- 6.3.4.5.1. Key market trends, growth factors and opportunities
- 6.3.4.5.2. Market size and forecast, by Technology
- 6.3.4.5.3. Market size and forecast, by Fuels
- 6.3.4.6. Rest of Europe
- 6.3.4.6.1. Key market trends, growth factors and opportunities
- 6.3.4.6.2. Market size and forecast, by Technology
- 6.3.4.6.3. Market size and forecast, by Fuels
- 6.4. Asia-Pacific
- 6.4.1. Key trends and opportunities
- 6.4.2. Market size and forecast, by Technology
- 6.4.3. Market size and forecast, by Fuels
- 6.4.4. Market size and forecast, by country
- 6.4.4.1. China
- 6.4.4.1.1. Key market trends, growth factors and opportunities
- 6.4.4.1.2. Market size and forecast, by Technology
- 6.4.4.1.3. Market size and forecast, by Fuels
- 6.4.4.2. Japan
- 6.4.4.2.1. Key market trends, growth factors and opportunities
- 6.4.4.2.2. Market size and forecast, by Technology
- 6.4.4.2.3. Market size and forecast, by Fuels
- 6.4.4.3. India
- 6.4.4.3.1. Key market trends, growth factors and opportunities
- 6.4.4.3.2. Market size and forecast, by Technology
- 6.4.4.3.3. Market size and forecast, by Fuels
- 6.4.4.4. South Korea
- 6.4.4.4.1. Key market trends, growth factors and opportunities
- 6.4.4.4.2. Market size and forecast, by Technology
- 6.4.4.4.3. Market size and forecast, by Fuels
- 6.4.4.5. Australia
- 6.4.4.5.1. Key market trends, growth factors and opportunities
- 6.4.4.5.2. Market size and forecast, by Technology
- 6.4.4.5.3. Market size and forecast, by Fuels
- 6.4.4.6. Rest of Asia-Pacific
- 6.4.4.6.1. Key market trends, growth factors and opportunities
- 6.4.4.6.2. Market size and forecast, by Technology
- 6.4.4.6.3. Market size and forecast, by Fuels
- 6.5. LAMEA
- 6.5.1. Key trends and opportunities
- 6.5.2. Market size and forecast, by Technology
- 6.5.3. Market size and forecast, by Fuels
- 6.5.4. Market size and forecast, by country
- 6.5.4.1. Brazil
- 6.5.4.1.1. Key market trends, growth factors and opportunities
- 6.5.4.1.2. Market size and forecast, by Technology
- 6.5.4.1.3. Market size and forecast, by Fuels
- 6.5.4.2. Saudi Arabia
- 6.5.4.2.1. Key market trends, growth factors and opportunities
- 6.5.4.2.2. Market size and forecast, by Technology
- 6.5.4.2.3. Market size and forecast, by Fuels
- 6.5.4.3. South Africa
- 6.5.4.3.1. Key market trends, growth factors and opportunities
- 6.5.4.3.2. Market size and forecast, by Technology
- 6.5.4.3.3. Market size and forecast, by Fuels
- 6.5.4.4. Rest of LAMEA
- 6.5.4.4.1. Key market trends, growth factors and opportunities
- 6.5.4.4.2. Market size and forecast, by Technology
- 6.5.4.4.3. Market size and forecast, by Fuels
CHAPTER 7: COMPETITIVE LANDSCAPE
- 7.1. Introduction
- 7.2. Top winning strategies
- 7.3. Product Mapping of Top 10 Player
- 7.4. Competitive Dashboard
- 7.5. Competitive Heatmap
- 7.6. Top player positioning, 2030
CHAPTER 8: COMPANY PROFILES
- 8.1. Agni Fusion Energy
- 8.1.1. Company overview
- 8.1.2. Key Executives
- 8.1.3. Company snapshot
- 8.1.4. Operating business segments
- 8.1.5. Product portfolio
- 8.2. TAE Technologies, Inc.
- 8.2.1. Company overview
- 8.2.2. Key Executives
- 8.2.3. Company snapshot
- 8.2.4. Operating business segments
- 8.2.5. Product portfolio
- 8.3. Helion Energy Inc.
- 8.3.1. Company overview
- 8.3.2. Key Executives
- 8.3.3. Company snapshot
- 8.3.4. Operating business segments
- 8.3.5. Product portfolio
- 8.4. Commonwealth Fusion Systems
- 8.4.1. Company overview
- 8.4.2. Key Executives
- 8.4.3. Company snapshot
- 8.4.4. Operating business segments
- 8.4.5. Product portfolio
- 8.4.6. Key strategic moves and developments
- 8.5. General Fusion
- 8.5.1. Company overview
- 8.5.2. Key Executives
- 8.5.3. Company snapshot
- 8.5.4. Operating business segments
- 8.5.5. Product portfolio
- 8.6. Tokamak Energy Ltd.
- 8.6.1. Company overview
- 8.6.2. Key Executives
- 8.6.3. Company snapshot
- 8.6.4. Operating business segments
- 8.6.5. Product portfolio
- 8.7. Zap Energy Inc.
- 8.7.1. Company overview
- 8.7.2. Key Executives
- 8.7.3. Company snapshot
- 8.7.4. Operating business segments
- 8.7.5. Product portfolio
- 8.8. First Light Fusion
- 8.8.1. Company overview
- 8.8.2. Key Executives
- 8.8.3. Company snapshot
- 8.8.4. Operating business segments
- 8.8.5. Product portfolio
- 8.9. Lockheed Martin Corporation
- 8.9.1. Company overview
- 8.9.2. Key Executives
- 8.9.3. Company snapshot
- 8.9.4. Operating business segments
- 8.9.5. Product portfolio
- 8.9.6. Business performance
- 8.10. Hyperjet Fusion Corporation
- 8.10.1. Company overview
- 8.10.2. Key Executives
- 8.10.3. Company snapshot
- 8.10.4. Operating business segments
- 8.10.5. Product portfolio
- 8.11. HB11 Energy Holdings Pty Ltd
- 8.11.1. Company overview
- 8.11.2. Key Executives
- 8.11.3. Company snapshot
- 8.11.4. Operating business segments
- 8.11.5. Product portfolio
- 8.12. Renaissance Fusion
- 8.12.1. Company overview
- 8.12.2. Key Executives
- 8.12.3. Company snapshot
- 8.12.4. Operating business segments
- 8.12.5. Product portfolio
- 8.13. Marvel Fusion
- 8.13.1. Company overview
- 8.13.2. Key Executives
- 8.13.3. Company snapshot
- 8.13.4. Operating business segments
- 8.13.5. Product portfolio
- 8.14. Kyoto Fusioneering Ltd.
- 8.14.1. Company overview
- 8.14.2. Key Executives
- 8.14.3. Company snapshot
- 8.14.4. Operating business segments
- 8.14.5. Product portfolio