|
|
市場調査レポート
商品コード
1298236
バイオ炭市場:製造技術別(熱分解、ガス化、その他)、用途別(土壌改良、動物飼料、産業、その他):世界の機会分析と産業予測、2021-2031年Biochar Market By Production Technology (Pyrolysis, Gasification, Others), By Application (Soil Amendment, Animal Feed, Industrial, Others): Global Opportunity Analysis and Industry Forecast, 2021-2031 |
||||||
|
|
|||||||


| バイオ炭市場:製造技術別(熱分解、ガス化、その他)、用途別(土壌改良、動物飼料、産業、その他):世界の機会分析と産業予測、2021-2031年 |
|
出版日: 2023年03月01日
発行: Allied Market Research
ページ情報: 英文 272 Pages
納期: 2~3営業日
|
- 全表示
- 概要
- 図表
- 目次
バイオ炭市場は、2021年に2億460万米ドルと評価され、2022年から2031年までのCAGRは13.1%を示し、2031年には6億9,510万米ドルに達すると推定されます。

バイオ炭は、酸素のない状態でのバイオマスの熱分解から生成される炭です。陽イオン交換容量(CEC)を持ち、多孔質で炭素が豊富な固体です。バイオ炭は、土壌の質と植物の栄養を向上させるために、土壌改良材として広く使用されています。さらに、牛(ウシとヤギ)の消化、造血、栄養摂取効率を高めるため、家畜飼料の主要なサプリメントとしても使用されています。
人口の増加は農作物への需要を急増させ、ひいては農業セクターにより良い勢いをもたらしています。例えば、India Brands Equity Foundationが発表した報告書によると、2021年の農業および関連製品の輸出総額は412億5,000万米ドルに達しています。さらに、急速な都市化や気候変動などの要因により、農業活動のための土地の劣化が進んでいます。このため農家は、増大する世界の食糧需要を満たすため、作物の収穫量を増やす必要に迫られています。
バイオ炭は、土壌のpH、栄養保持力、含水率を高めることにより、土壌の健康と肥沃度のための持続可能な製品として機能します。これに加えて、商業肥料の必要性を減らし、農業を収益性の高いビジネスにします。このため、農家は農業分野における様々な土壌改良活動にバイオ炭を使用するようになっています。このような要因が、予測期間中のバイオ炭市場の成長を促進すると予測されています。
さらに、バイオ炭は有機炭素を豊富に含む物質から得られる発熱性炭素質物質です。バイオ炭の添加は、牛、ヤギ、鶏、豚、魚などの動物飼料に好反応を示しています。バイオ炭は、反芻動物(牛やヤギ)の飼料添加物として使用され、血液型、成長能力、卵の収量、病原菌に対する抵抗力を向上させる。さらに、カルシウム、カリウム、マグネシウムを多く含み、鶏の卵割れの発生を抑えます。さらに、魚の成長と生存率を促進します。このような要因により、バイオ炭は家畜の飼料として人気が高まっており、バイオ炭市場の成長を後押ししています。
目次
第1章 イントロダクション
第2章 エグゼクティブサマリー
第3章 市場概要
- 市場の定義と範囲
- 主な調査結果
- 影響要因
- 主な投資機会
- ポーターのファイブフォース分析
- 供給企業の交渉力
- 買い手の交渉力
- 代替品の脅威
- 新規参入業者の脅威
- 競合の激しさ
- 市場力学
- 促進要因
- 農業分野からの需要の増加
- バイオ炭の飼料用途の増加
- 建築・建設分野からの堅調な需要
- 水処理分野からの需要の増加
- 再生可能な原料
- 抑制要因
- 高い投資コスト
- 機会
- バイオ炭の新たな用途
- 企業の社会的責任(CSR)の成長
- 促進要因
- COVID-19の市場への影響分析
- 主要規制分析
- 特許情勢
- 価格分析
- バリューチェーン分析
第4章 バイオ炭市場:生産技術別
- 概要
- 市場規模と予測
- 熱分解
- 主要市場動向、成長要因、機会
- 市場規模・予測:地域別
- 市場シェア分析:国別
- ガス化
- 主な市場動向、成長要因、機会
- 市場規模・予測:地域別
- 市場シェア分析:国別
- その他
- 主な市場動向、成長要因、機会
- 市場規模・予測:地域別
- 市場シェア分析:国別
第5章 バイオ炭市場:用途別
- 概要
- 市場規模と予測
- 土壌改良
- 主要市場動向、成長要因、機会
- 市場規模・予測:地域別
- 市場シェア分析:国別
- 動物飼料
- 主な市場動向、成長要因、機会
- 市場規模・予測:地域別
- 市場シェア分析:国別
- 産業用
- 主要市場動向、成長要因、機会
- 市場規模・予測:地域別
- 市場シェア分析:国別
- その他
- 主な市場動向、成長要因、機会
- 市場規模・予測:地域別
- 市場シェア分析:国別
第6章 バイオ炭市場:地域別
- 概要
- 市場規模・予測: 地域別
- 北米
- 主要動向と機会
- 市場規模・予測:生産技術別
- 市場規模・予測:用途別
- 市場規模・予測:国別
- 米国
- 主な市場動向、成長要因、機会
- 市場規模・予測:生産技術別
- 市場規模・予測:用途別
- カナダ
- 主要市場動向、成長要因、機会
- 市場規模・予測:生産技術別
- 市場規模・予測:用途別
- メキシコ
- 主要市場動向、成長要因、機会
- 市場規模・予測:生産技術別
- 市場規模・予測:用途別
- 欧州
- 主要動向と機会
- 市場規模・予測:生産技術別
- 市場規模・予測:用途別
- 市場規模・予測:国別
- ドイツ
- 主要市場動向、成長要因、機会
- 市場規模・予測:生産技術別
- 市場規模・予測:用途別
- 英国
- 主要市場動向、成長要因、機会
- 市場規模・予測:生産技術別
- 市場規模・予測:用途別
- フランス
- 主要市場動向、成長要因、機会
- 市場規模・予測:生産技術別
- 市場規模・予測:用途別
- スペイン
- 主要市場動向、成長要因、機会
- 市場規模・予測:生産技術別
- 市場規模・予測:用途別
- イタリア
- 主要市場動向、成長要因、機会
- 市場規模・予測:生産技術別
- 市場規模・予測:用途別
- その他欧州
- 主要市場動向、成長要因、機会
- 市場規模・予測:生産技術別
- 市場規模・予測:用途別
- アジア太平洋地域
- 主要動向と機会
- 市場規模・予測:生産技術別
- 市場規模・予測:用途別
- 市場規模・予測:国別
- 中国
- 主要市場動向、成長要因、機会
- 市場規模・予測:生産技術別
- 市場規模・予測:用途別
- 日本
- 主要市場動向、成長要因、機会
- 市場規模・予測:生産技術別
- 市場規模・予測:用途別
- インド
- 主要市場動向、成長要因、機会
- 市場規模・予測:生産技術別
- 市場規模・予測:用途別
- 韓国
- 主要市場動向、成長要因、機会
- 市場規模・予測:生産技術別
- 市場規模・予測:用途別
- オーストラリア
- 主要市場動向、成長要因、機会
- 市場規模・予測:生産技術別
- 市場規模・予測:用途別
- インドネシア
- 主要市場動向、成長要因、機会
- 市場規模・予測:生産技術別
- 市場規模・予測:用途別
- ベトナム
- 主要市場動向、成長要因、機会
- 市場規模・予測:生産技術別
- 市場規模・予測:用途別
- タイ
- 主要市場動向、成長要因、機会
- 市場規模・予測:生産技術別
- 市場規模・予測:用途別
- その他アジア太平洋地域
- 主要市場動向、成長要因、機会
- 市場規模・予測:生産技術別
- 市場規模・予測:用途別
- ラテンアメリカ・中東・アフリカ
- 主要動向と機会
- 市場規模・予測:生産技術別
- 市場規模・予測:用途別
- 市場規模・予測:国別
- ブラジル
- 主要市場動向、成長要因、機会
- 市場規模・予測:生産技術別
- 市場規模・予測:用途別
- サウジアラビア
- 主要市場動向、成長要因、機会
- 市場規模・予測:生産技術別
- 市場規模・予測:用途別
- 南アフリカ
- 主要市場動向、成長要因、機会
- 市場規模・予測:生産技術別
- 市場規模・予測:用途別
- その他の地域
- 主要市場動向、成長要因、機会
- 市場規模・予測:生産技術別
- 市場規模・予測:用途別
第7章 競合情勢
- イントロダクション
- 主要成功戦略
- 主要10社の製品マッピング
- 競合ダッシュボード
- 競合ヒートマップ
- 主要企業のポジショニング、2021年
第8章 企業プロファイル
- Airex Energy Inc.
- Arsta Eco Pvt Ltd
- Biochar Supreme
- Coaltec Energy USA
- FARM2ENERGY Private LIMITED
- Frontline Bioenergy Ltd.
- Karr Group Co.(KGC)
- Pacific Biochar Production
- Proactive Agriculture
- Carbofex Ltd.
LIST OF TABLES
- TABLE 01. GLOBAL BIOCHAR MARKET, BY PRODUCTION TECHNOLOGY, 2021-2031 ($MILLION)
- TABLE 02. GLOBAL BIOCHAR MARKET, BY PRODUCTION TECHNOLOGY, 2021-2031 (KILOTON)
- TABLE 03. BIOCHAR MARKET FOR PYROLYSIS, BY REGION, 2021-2031 ($MILLION)
- TABLE 04. BIOCHAR MARKET FOR PYROLYSIS, BY REGION, 2021-2031 (KILOTON)
- TABLE 05. BIOCHAR MARKET FOR GASIFICATION, BY REGION, 2021-2031 ($MILLION)
- TABLE 06. BIOCHAR MARKET FOR GASIFICATION, BY REGION, 2021-2031 (KILOTON)
- TABLE 07. BIOCHAR MARKET FOR OTHERS, BY REGION, 2021-2031 ($MILLION)
- TABLE 08. BIOCHAR MARKET FOR OTHERS, BY REGION, 2021-2031 (KILOTON)
- TABLE 09. GLOBAL BIOCHAR MARKET, BY APPLICATION, 2021-2031 ($MILLION)
- TABLE 10. GLOBAL BIOCHAR MARKET, BY APPLICATION, 2021-2031 (KILOTON)
- TABLE 11. BIOCHAR MARKET FOR SOIL AMENDMENT, BY REGION, 2021-2031 ($MILLION)
- TABLE 12. BIOCHAR MARKET FOR SOIL AMENDMENT, BY REGION, 2021-2031 (KILOTON)
- TABLE 13. BIOCHAR MARKET FOR ANIMAL FEED, BY REGION, 2021-2031 ($MILLION)
- TABLE 14. BIOCHAR MARKET FOR ANIMAL FEED, BY REGION, 2021-2031 (KILOTON)
- TABLE 15. BIOCHAR MARKET FOR INDUSTRIAL, BY REGION, 2021-2031 ($MILLION)
- TABLE 16. BIOCHAR MARKET FOR INDUSTRIAL, BY REGION, 2021-2031 (KILOTON)
- TABLE 17. BIOCHAR MARKET FOR OTHERS, BY REGION, 2021-2031 ($MILLION)
- TABLE 18. BIOCHAR MARKET FOR OTHERS, BY REGION, 2021-2031 (KILOTON)
- TABLE 19. BIOCHAR MARKET, BY REGION, 2021-2031 ($MILLION)
- TABLE 20. BIOCHAR MARKET, BY REGION, 2021-2031 (KILOTON)
- TABLE 21. NORTH AMERICA BIOCHAR MARKET, BY PRODUCTION TECHNOLOGY, 2021-2031 ($MILLION)
- TABLE 22. NORTH AMERICA BIOCHAR MARKET, BY PRODUCTION TECHNOLOGY, 2021-2031 (KILOTON)
- TABLE 23. NORTH AMERICA BIOCHAR MARKET, BY APPLICATION, 2021-2031 ($MILLION)
- TABLE 24. NORTH AMERICA BIOCHAR MARKET, BY APPLICATION, 2021-2031 (KILOTON)
- TABLE 25. NORTH AMERICA BIOCHAR MARKET, BY COUNTRY, 2021-2031 ($MILLION)
- TABLE 26. NORTH AMERICA BIOCHAR MARKET, BY COUNTRY, 2021-2031 (KILOTON)
- TABLE 27. U.S. BIOCHAR MARKET, BY PRODUCTION TECHNOLOGY, 2021-2031 ($MILLION)
- TABLE 28. U.S. BIOCHAR MARKET, BY PRODUCTION TECHNOLOGY, 2021-2031 (KILOTON)
- TABLE 29. U.S. BIOCHAR MARKET, BY APPLICATION, 2021-2031 ($MILLION)
- TABLE 30. U.S. BIOCHAR MARKET, BY APPLICATION, 2021-2031 (KILOTON)
- TABLE 31. CANADA BIOCHAR MARKET, BY PRODUCTION TECHNOLOGY, 2021-2031 ($MILLION)
- TABLE 32. CANADA BIOCHAR MARKET, BY PRODUCTION TECHNOLOGY, 2021-2031 (KILOTON)
- TABLE 33. CANADA BIOCHAR MARKET, BY APPLICATION, 2021-2031 ($MILLION)
- TABLE 34. CANADA BIOCHAR MARKET, BY APPLICATION, 2021-2031 (KILOTON)
- TABLE 35. MEXICO BIOCHAR MARKET, BY PRODUCTION TECHNOLOGY, 2021-2031 ($MILLION)
- TABLE 36. MEXICO BIOCHAR MARKET, BY PRODUCTION TECHNOLOGY, 2021-2031 (KILOTON)
- TABLE 37. MEXICO BIOCHAR MARKET, BY APPLICATION, 2021-2031 ($MILLION)
- TABLE 38. MEXICO BIOCHAR MARKET, BY APPLICATION, 2021-2031 (KILOTON)
- TABLE 39. EUROPE BIOCHAR MARKET, BY PRODUCTION TECHNOLOGY, 2021-2031 ($MILLION)
- TABLE 40. EUROPE BIOCHAR MARKET, BY PRODUCTION TECHNOLOGY, 2021-2031 (KILOTON)
- TABLE 41. EUROPE BIOCHAR MARKET, BY APPLICATION, 2021-2031 ($MILLION)
- TABLE 42. EUROPE BIOCHAR MARKET, BY APPLICATION, 2021-2031 (KILOTON)
- TABLE 43. EUROPE BIOCHAR MARKET, BY COUNTRY, 2021-2031 ($MILLION)
- TABLE 44. EUROPE BIOCHAR MARKET, BY COUNTRY, 2021-2031 (KILOTON)
- TABLE 45. GERMANY BIOCHAR MARKET, BY PRODUCTION TECHNOLOGY, 2021-2031 ($MILLION)
- TABLE 46. GERMANY BIOCHAR MARKET, BY PRODUCTION TECHNOLOGY, 2021-2031 (KILOTON)
- TABLE 47. GERMANY BIOCHAR MARKET, BY APPLICATION, 2021-2031 ($MILLION)
- TABLE 48. GERMANY BIOCHAR MARKET, BY APPLICATION, 2021-2031 (KILOTON)
- TABLE 49. UK BIOCHAR MARKET, BY PRODUCTION TECHNOLOGY, 2021-2031 ($MILLION)
- TABLE 50. UK BIOCHAR MARKET, BY PRODUCTION TECHNOLOGY, 2021-2031 (KILOTON)
- TABLE 51. UK BIOCHAR MARKET, BY APPLICATION, 2021-2031 ($MILLION)
- TABLE 52. UK BIOCHAR MARKET, BY APPLICATION, 2021-2031 (KILOTON)
- TABLE 53. FRANCE BIOCHAR MARKET, BY PRODUCTION TECHNOLOGY, 2021-2031 ($MILLION)
- TABLE 54. FRANCE BIOCHAR MARKET, BY PRODUCTION TECHNOLOGY, 2021-2031 (KILOTON)
- TABLE 55. FRANCE BIOCHAR MARKET, BY APPLICATION, 2021-2031 ($MILLION)
- TABLE 56. FRANCE BIOCHAR MARKET, BY APPLICATION, 2021-2031 (KILOTON)
- TABLE 57. SPAIN BIOCHAR MARKET, BY PRODUCTION TECHNOLOGY, 2021-2031 ($MILLION)
- TABLE 58. SPAIN BIOCHAR MARKET, BY PRODUCTION TECHNOLOGY, 2021-2031 (KILOTON)
- TABLE 59. SPAIN BIOCHAR MARKET, BY APPLICATION, 2021-2031 ($MILLION)
- TABLE 60. SPAIN BIOCHAR MARKET, BY APPLICATION, 2021-2031 (KILOTON)
- TABLE 61. ITALY BIOCHAR MARKET, BY PRODUCTION TECHNOLOGY, 2021-2031 ($MILLION)
- TABLE 62. ITALY BIOCHAR MARKET, BY PRODUCTION TECHNOLOGY, 2021-2031 (KILOTON)
- TABLE 63. ITALY BIOCHAR MARKET, BY APPLICATION, 2021-2031 ($MILLION)
- TABLE 64. ITALY BIOCHAR MARKET, BY APPLICATION, 2021-2031 (KILOTON)
- TABLE 65. REST OF EUROPE BIOCHAR MARKET, BY PRODUCTION TECHNOLOGY, 2021-2031 ($MILLION)
- TABLE 66. REST OF EUROPE BIOCHAR MARKET, BY PRODUCTION TECHNOLOGY, 2021-2031 (KILOTON)
- TABLE 67. REST OF EUROPE BIOCHAR MARKET, BY APPLICATION, 2021-2031 ($MILLION)
- TABLE 68. REST OF EUROPE BIOCHAR MARKET, BY APPLICATION, 2021-2031 (KILOTON)
- TABLE 69. ASIA-PACIFIC BIOCHAR MARKET, BY PRODUCTION TECHNOLOGY, 2021-2031 ($MILLION)
- TABLE 70. ASIA-PACIFIC BIOCHAR MARKET, BY PRODUCTION TECHNOLOGY, 2021-2031 (KILOTON)
- TABLE 71. ASIA-PACIFIC BIOCHAR MARKET, BY APPLICATION, 2021-2031 ($MILLION)
- TABLE 72. ASIA-PACIFIC BIOCHAR MARKET, BY APPLICATION, 2021-2031 (KILOTON)
- TABLE 73. ASIA-PACIFIC BIOCHAR MARKET, BY COUNTRY, 2021-2031 ($MILLION)
- TABLE 74. ASIA-PACIFIC BIOCHAR MARKET, BY COUNTRY, 2021-2031 (KILOTON)
- TABLE 75. CHINA BIOCHAR MARKET, BY PRODUCTION TECHNOLOGY, 2021-2031 ($MILLION)
- TABLE 76. CHINA BIOCHAR MARKET, BY PRODUCTION TECHNOLOGY, 2021-2031 (KILOTON)
- TABLE 77. CHINA BIOCHAR MARKET, BY APPLICATION, 2021-2031 ($MILLION)
- TABLE 78. CHINA BIOCHAR MARKET, BY APPLICATION, 2021-2031 (KILOTON)
- TABLE 79. JAPAN BIOCHAR MARKET, BY PRODUCTION TECHNOLOGY, 2021-2031 ($MILLION)
- TABLE 80. JAPAN BIOCHAR MARKET, BY PRODUCTION TECHNOLOGY, 2021-2031 (KILOTON)
- TABLE 81. JAPAN BIOCHAR MARKET, BY APPLICATION, 2021-2031 ($MILLION)
- TABLE 82. JAPAN BIOCHAR MARKET, BY APPLICATION, 2021-2031 (KILOTON)
- TABLE 83. INDIA BIOCHAR MARKET, BY PRODUCTION TECHNOLOGY, 2021-2031 ($MILLION)
- TABLE 84. INDIA BIOCHAR MARKET, BY PRODUCTION TECHNOLOGY, 2021-2031 (KILOTON)
- TABLE 85. INDIA BIOCHAR MARKET, BY APPLICATION, 2021-2031 ($MILLION)
- TABLE 86. INDIA BIOCHAR MARKET, BY APPLICATION, 2021-2031 (KILOTON)
- TABLE 87. SOUTH KOREA BIOCHAR MARKET, BY PRODUCTION TECHNOLOGY, 2021-2031 ($MILLION)
- TABLE 88. SOUTH KOREA BIOCHAR MARKET, BY PRODUCTION TECHNOLOGY, 2021-2031 (KILOTON)
- TABLE 89. SOUTH KOREA BIOCHAR MARKET, BY APPLICATION, 2021-2031 ($MILLION)
- TABLE 90. SOUTH KOREA BIOCHAR MARKET, BY APPLICATION, 2021-2031 (KILOTON)
- TABLE 91. AUSTRALIA BIOCHAR MARKET, BY PRODUCTION TECHNOLOGY, 2021-2031 ($MILLION)
- TABLE 92. AUSTRALIA BIOCHAR MARKET, BY PRODUCTION TECHNOLOGY, 2021-2031 (KILOTON)
- TABLE 93. AUSTRALIA BIOCHAR MARKET, BY APPLICATION, 2021-2031 ($MILLION)
- TABLE 94. AUSTRALIA BIOCHAR MARKET, BY APPLICATION, 2021-2031 (KILOTON)
- TABLE 95. INDONESIA BIOCHAR MARKET, BY PRODUCTION TECHNOLOGY, 2021-2031 ($MILLION)
- TABLE 96. INDONESIA BIOCHAR MARKET, BY PRODUCTION TECHNOLOGY, 2021-2031 (KILOTON)
- TABLE 97. INDONESIA BIOCHAR MARKET, BY APPLICATION, 2021-2031 ($MILLION)
- TABLE 98. INDONESIA BIOCHAR MARKET, BY APPLICATION, 2021-2031 (KILOTON)
- TABLE 99. VIETNAM BIOCHAR MARKET, BY PRODUCTION TECHNOLOGY, 2021-2031 ($MILLION)
- TABLE 100. VIETNAM BIOCHAR MARKET, BY PRODUCTION TECHNOLOGY, 2021-2031 (KILOTON)
- TABLE 101. VIETNAM BIOCHAR MARKET, BY APPLICATION, 2021-2031 ($MILLION)
- TABLE 102. VIETNAM BIOCHAR MARKET, BY APPLICATION, 2021-2031 (KILOTON)
- TABLE 103. THAILAND BIOCHAR MARKET, BY PRODUCTION TECHNOLOGY, 2021-2031 ($MILLION)
- TABLE 104. THAILAND BIOCHAR MARKET, BY PRODUCTION TECHNOLOGY, 2021-2031 (KILOTON)
- TABLE 105. THAILAND BIOCHAR MARKET, BY APPLICATION, 2021-2031 ($MILLION)
- TABLE 106. THAILAND BIOCHAR MARKET, BY APPLICATION, 2021-2031 (KILOTON)
- TABLE 107. REST OF ASIA-PACIFIC BIOCHAR MARKET, BY PRODUCTION TECHNOLOGY, 2021-2031 ($MILLION)
- TABLE 108. REST OF ASIA-PACIFIC BIOCHAR MARKET, BY PRODUCTION TECHNOLOGY, 2021-2031 (KILOTON)
- TABLE 109. REST OF ASIA-PACIFIC BIOCHAR MARKET, BY APPLICATION, 2021-2031 ($MILLION)
- TABLE 110. REST OF ASIA-PACIFIC BIOCHAR MARKET, BY APPLICATION, 2021-2031 (KILOTON)
- TABLE 111. LAMEA BIOCHAR MARKET, BY PRODUCTION TECHNOLOGY, 2021-2031 ($MILLION)
- TABLE 112. LAMEA BIOCHAR MARKET, BY PRODUCTION TECHNOLOGY, 2021-2031 (KILOTON)
- TABLE 113. LAMEA BIOCHAR MARKET, BY APPLICATION, 2021-2031 ($MILLION)
- TABLE 114. LAMEA BIOCHAR MARKET, BY APPLICATION, 2021-2031 (KILOTON)
- TABLE 115. LAMEA BIOCHAR MARKET, BY COUNTRY, 2021-2031 ($MILLION)
- TABLE 116. LAMEA BIOCHAR MARKET, BY COUNTRY, 2021-2031 (KILOTON)
- TABLE 117. BRAZIL BIOCHAR MARKET, BY PRODUCTION TECHNOLOGY, 2021-2031 ($MILLION)
- TABLE 118. BRAZIL BIOCHAR MARKET, BY PRODUCTION TECHNOLOGY, 2021-2031 (KILOTON)
- TABLE 119. BRAZIL BIOCHAR MARKET, BY APPLICATION, 2021-2031 ($MILLION)
- TABLE 120. BRAZIL BIOCHAR MARKET, BY APPLICATION, 2021-2031 (KILOTON)
- TABLE 121. SAUDI ARABIA BIOCHAR MARKET, BY PRODUCTION TECHNOLOGY, 2021-2031 ($MILLION)
- TABLE 122. SAUDI ARABIA BIOCHAR MARKET, BY PRODUCTION TECHNOLOGY, 2021-2031 (KILOTON)
- TABLE 123. SAUDI ARABIA BIOCHAR MARKET, BY APPLICATION, 2021-2031 ($MILLION)
- TABLE 124. SAUDI ARABIA BIOCHAR MARKET, BY APPLICATION, 2021-2031 (KILOTON)
- TABLE 125. SOUTH AFRICA BIOCHAR MARKET, BY PRODUCTION TECHNOLOGY, 2021-2031 ($MILLION)
- TABLE 126. SOUTH AFRICA BIOCHAR MARKET, BY PRODUCTION TECHNOLOGY, 2021-2031 (KILOTON)
- TABLE 127. SOUTH AFRICA BIOCHAR MARKET, BY APPLICATION, 2021-2031 ($MILLION)
- TABLE 128. SOUTH AFRICA BIOCHAR MARKET, BY APPLICATION, 2021-2031 (KILOTON)
- TABLE 129. REST OF LAMEA BIOCHAR MARKET, BY PRODUCTION TECHNOLOGY, 2021-2031 ($MILLION)
- TABLE 130. REST OF LAMEA BIOCHAR MARKET, BY PRODUCTION TECHNOLOGY, 2021-2031 (KILOTON)
- TABLE 131. REST OF LAMEA BIOCHAR MARKET, BY APPLICATION, 2021-2031 ($MILLION)
- TABLE 132. REST OF LAMEA BIOCHAR MARKET, BY APPLICATION, 2021-2031 (KILOTON)
- TABLE 133. AIREX ENERGY INC.: KEY EXECUTIVES
- TABLE 134. AIREX ENERGY INC.: COMPANY SNAPSHOT
- TABLE 135. AIREX ENERGY INC.: PRODUCT SEGMENTS
- TABLE 136. AIREX ENERGY INC.: PRODUCT PORTFOLIO
- TABLE 137. AIREX ENERGY INC.: KEY STRATERGIES
- TABLE 138. ARSTA ECO PVT LTD: KEY EXECUTIVES
- TABLE 139. ARSTA ECO PVT LTD: COMPANY SNAPSHOT
- TABLE 140. ARSTA ECO PVT LTD: PRODUCT SEGMENTS
- TABLE 141. ARSTA ECO PVT LTD: PRODUCT PORTFOLIO
- TABLE 142. BIOCHAR SUPREME: KEY EXECUTIVES
- TABLE 143. BIOCHAR SUPREME: COMPANY SNAPSHOT
- TABLE 144. BIOCHAR SUPREME: PRODUCT SEGMENTS
- TABLE 145. BIOCHAR SUPREME: PRODUCT PORTFOLIO
- TABLE 146. COALTEC ENERGY USA: KEY EXECUTIVES
- TABLE 147. COALTEC ENERGY USA: COMPANY SNAPSHOT
- TABLE 148. COALTEC ENERGY USA: PRODUCT SEGMENTS
- TABLE 149. COALTEC ENERGY USA: PRODUCT PORTFOLIO
- TABLE 150. FARM2ENERGY PRIVATE LIMITED: KEY EXECUTIVES
- TABLE 151. FARM2ENERGY PRIVATE LIMITED: COMPANY SNAPSHOT
- TABLE 152. FARM2ENERGY PRIVATE LIMITED: PRODUCT SEGMENTS
- TABLE 153. FARM2ENERGY PRIVATE LIMITED: PRODUCT PORTFOLIO
- TABLE 154. FRONTLINE BIOENERGY LTD.: KEY EXECUTIVES
- TABLE 155. FRONTLINE BIOENERGY LTD.: COMPANY SNAPSHOT
- TABLE 156. FRONTLINE BIOENERGY LTD.: PRODUCT SEGMENTS
- TABLE 157. FRONTLINE BIOENERGY LTD.: PRODUCT PORTFOLIO
- TABLE 158. KARR GROUP CO. (KGC): KEY EXECUTIVES
- TABLE 159. KARR GROUP CO. (KGC): COMPANY SNAPSHOT
- TABLE 160. KARR GROUP CO. (KGC): PRODUCT SEGMENTS
- TABLE 161. KARR GROUP CO. (KGC): PRODUCT PORTFOLIO
- TABLE 162. PACIFIC BIOCHAR PRODUCTION: KEY EXECUTIVES
- TABLE 163. PACIFIC BIOCHAR PRODUCTION: COMPANY SNAPSHOT
- TABLE 164. PACIFIC BIOCHAR PRODUCTION: PRODUCT SEGMENTS
- TABLE 165. PACIFIC BIOCHAR PRODUCTION: PRODUCT PORTFOLIO
- TABLE 166. PROACTIVE AGRICULTURE: KEY EXECUTIVES
- TABLE 167. PROACTIVE AGRICULTURE: COMPANY SNAPSHOT
- TABLE 168. PROACTIVE AGRICULTURE: PRODUCT SEGMENTS
- TABLE 169. PROACTIVE AGRICULTURE: PRODUCT PORTFOLIO
- TABLE 170. CARBOFEX LTD.: KEY EXECUTIVES
- TABLE 171. CARBOFEX LTD.: COMPANY SNAPSHOT
- TABLE 172. CARBOFEX LTD.: PRODUCT SEGMENTS
- TABLE 173. CARBOFEX LTD.: PRODUCT PORTFOLIO
LIST OF FIGURES
- FIGURE 01. BIOCHAR MARKET, 2021-2031
- FIGURE 02. SEGMENTATION OF BIOCHAR MARKET, 2021-2031
- FIGURE 03. TOP INVESTMENT POCKETS IN BIOCHAR MARKET (2022-2031)
- FIGURE 04. MODERATE BARGAINING POWER OF SUPPLIERS
- FIGURE 05. MODERATE BARGAINING POWER OF BUYERS
- FIGURE 06. MODERATE THREAT OF SUBSTITUTES
- FIGURE 07. MODERATE THREAT OF NEW ENTRANTS
- FIGURE 08. MODERATE INTENSITY OF RIVALRY
- FIGURE 09. DRIVERS, RESTRAINTS AND OPPORTUNITIES: GLOBALBIOCHAR MARKET
- FIGURE 10. IMPACT OF KEY REGULATION: BIOCHAR MARKET
- FIGURE 11. PATENT ANALYSIS BY COMPANY
- FIGURE 12. PATENT ANALYSIS BY COUNTRY
- FIGURE 13. PRICING ANALYSIS: BIOCHAR MARKET 2021 AND 2031
- FIGURE 14. VALUE CHAIN ANALYSIS: BIOCHAR MARKET
- FIGURE 15. BIOCHAR MARKET, BY PRODUCTION TECHNOLOGY, 2021(%)
- FIGURE 16. COMPARATIVE SHARE ANALYSIS OF BIOCHAR MARKET FOR PYROLYSIS, BY COUNTRY 2021 AND 2031(%)
- FIGURE 17. COMPARATIVE SHARE ANALYSIS OF BIOCHAR MARKET FOR GASIFICATION, BY COUNTRY 2021 AND 2031(%)
- FIGURE 18. COMPARATIVE SHARE ANALYSIS OF BIOCHAR MARKET FOR OTHERS, BY COUNTRY 2021 AND 2031(%)
- FIGURE 19. BIOCHAR MARKET, BY APPLICATION, 2021(%)
- FIGURE 20. COMPARATIVE SHARE ANALYSIS OF BIOCHAR MARKET FOR SOIL AMENDMENT, BY COUNTRY 2021 AND 2031(%)
- FIGURE 21. COMPARATIVE SHARE ANALYSIS OF BIOCHAR MARKET FOR ANIMAL FEED, BY COUNTRY 2021 AND 2031(%)
- FIGURE 22. COMPARATIVE SHARE ANALYSIS OF BIOCHAR MARKET FOR INDUSTRIAL, BY COUNTRY 2021 AND 2031(%)
- FIGURE 23. COMPARATIVE SHARE ANALYSIS OF BIOCHAR MARKET FOR OTHERS, BY COUNTRY 2021 AND 2031(%)
- FIGURE 24. BIOCHAR MARKET BY REGION, 2021
- FIGURE 25. U.S. BIOCHAR MARKET, 2021-2031 ($MILLION)
- FIGURE 26. CANADA BIOCHAR MARKET, 2021-2031 ($MILLION)
- FIGURE 27. MEXICO BIOCHAR MARKET, 2021-2031 ($MILLION)
- FIGURE 28. GERMANY BIOCHAR MARKET, 2021-2031 ($MILLION)
- FIGURE 29. UK BIOCHAR MARKET, 2021-2031 ($MILLION)
- FIGURE 30. FRANCE BIOCHAR MARKET, 2021-2031 ($MILLION)
- FIGURE 31. SPAIN BIOCHAR MARKET, 2021-2031 ($MILLION)
- FIGURE 32. ITALY BIOCHAR MARKET, 2021-2031 ($MILLION)
- FIGURE 33. REST OF EUROPE BIOCHAR MARKET, 2021-2031 ($MILLION)
- FIGURE 34. CHINA BIOCHAR MARKET, 2021-2031 ($MILLION)
- FIGURE 35. JAPAN BIOCHAR MARKET, 2021-2031 ($MILLION)
- FIGURE 36. INDIA BIOCHAR MARKET, 2021-2031 ($MILLION)
- FIGURE 37. SOUTH KOREA BIOCHAR MARKET, 2021-2031 ($MILLION)
- FIGURE 38. AUSTRALIA BIOCHAR MARKET, 2021-2031 ($MILLION)
- FIGURE 39. INDONESIA BIOCHAR MARKET, 2021-2031 ($MILLION)
- FIGURE 40. VIETNAM BIOCHAR MARKET, 2021-2031 ($MILLION)
- FIGURE 41. THAILAND BIOCHAR MARKET, 2021-2031 ($MILLION)
- FIGURE 42. REST OF ASIA-PACIFIC BIOCHAR MARKET, 2021-2031 ($MILLION)
- FIGURE 43. BRAZIL BIOCHAR MARKET, 2021-2031 ($MILLION)
- FIGURE 44. SAUDI ARABIA BIOCHAR MARKET, 2021-2031 ($MILLION)
- FIGURE 45. SOUTH AFRICA BIOCHAR MARKET, 2021-2031 ($MILLION)
- FIGURE 46. REST OF LAMEA BIOCHAR MARKET, 2021-2031 ($MILLION)
- FIGURE 47. TOP WINNING STRATEGIES, BY YEAR
- FIGURE 48. TOP WINNING STRATEGIES, BY DEVELOPMENT
- FIGURE 49. TOP WINNING STRATEGIES, BY COMPANY
- FIGURE 50. PRODUCT MAPPING OF TOP 10 PLAYERS
- FIGURE 51. COMPETITIVE DASHBOARD
- FIGURE 52. COMPETITIVE HEATMAP: BIOCHAR MARKET
- FIGURE 53. TOP PLAYER POSITIONING, 2021
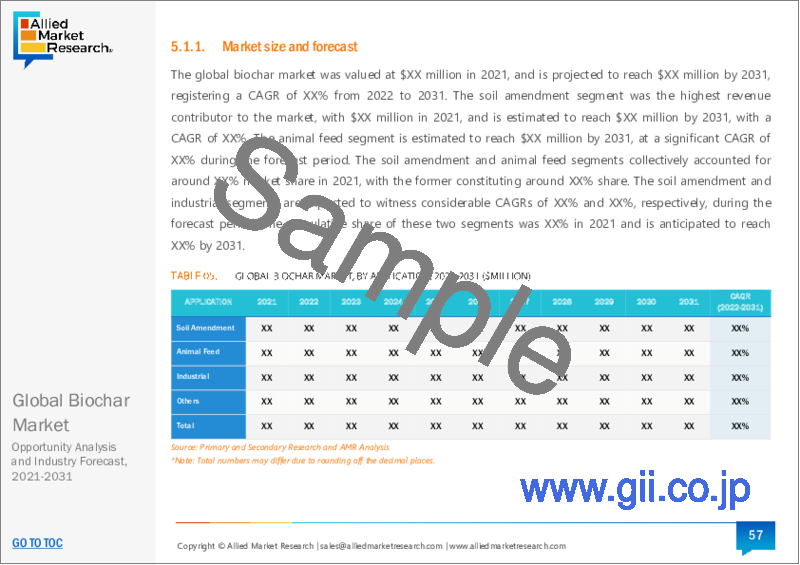
The biochar market was valued at $204.6 million in 2021 and is estimated to reach $695.1 million by 2031, exhibiting a CAGR of 13.1% from 2022 to 2031.
Biochar is a charcoal produced from the pyrolysis of biomass in the absence of oxygen. It is a porous and carbon-rich solid that possesses cation exchange capacity (CEC). It is widely used in soil amendment applications to enhance soil quality and plant nutrition. In addition to this, it is used as a prime animal feed supplement to enhance the digestion, blood formation, and nutrition intake efficiency of cattle (cows and goats).
The growth in population has surged the demand for crops, which in turn has generated better momentum for the agricultural sector. For instance, according to a report published by India Brands Equity Foundation, the export for total agriculture and allied products stood at $41.25 billion in 2021. Moreover, factors such as rapid urbanization and climate change have led to land degradation for farming activities. This has led the farmers to increase their crop yield to fulfill the growing global food demand.
Biochar acts as a sustainable product for soil health and fertility by enhancing the soil pH, nutrient retention, and moisture content. In addition to this, it reduces the need for commercial fertilizers; thus, making agriculture a profitable business. This has led farmers to become more linear toward using biochar for various soil amendment activities in the agricultural sector. This factor is projected to positively drive the growth of the biochar market during the forecast period.
Moreover, biochar is a pyrogenic carbonaceous matter that is derived from organic-carbon-rich materials. Biochar supplementation has shown positive responses in animal feeding such as cattle, goats, chicken, pigs, and fish. It is used as a feed additive in several ruminants (cattle and goats) to improve blood profiles, growth performance, egg yield, and ability to resist pathogens. Moreover, it has high levels of calcium, potassium, and magnesium that reduce the incidence of cracked eggs in hens. Furthermore, it promotes the growth and survival rate of fish. These factors have surged the popularity of biochar in animal feeding; thus, boosting the growth of the biochar market.
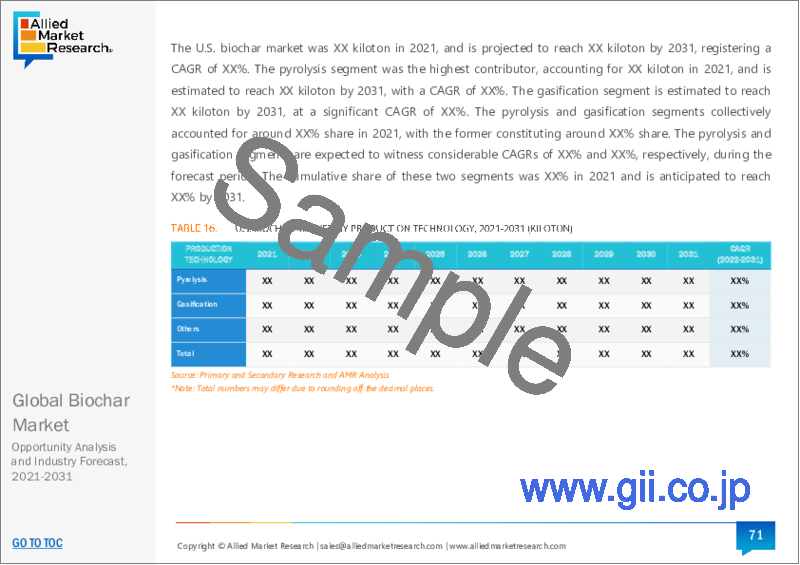
In addition to this, the increase in industrialization in both developed and developing economies such as the U.S., China, India, and others where biochar gasification is widely employed for running turbines in large-scale industries may boost the growth of the biochar market. In addition to this, there is a rapid surge in rural electrification activities, particularly in developing economies where biochar gasification plays a major role in power generation. This may act as one of the key drivers responsible for the growth of the biochar market during the forecast period.
Furthermore, an increase in R&D activities has surged the use of biochar gasification in coal blending. For instance, the United States Department of Energy (USDOE) has developed a modular design biochar gasification system that aids the conversion of domestic coal blends, municipal solid waste (MSW), and waste plastic into clean synthesis gas. This event is anticipated to fuel the growth of the biochar market in the future. However, drawbacks associated with the use of biochar are anticipated to hamper the market growth.
On the contrary, the increasing R&D activities have surged the potential applications of biochar in several end-use sectors. For instance, the textile industry has started using biochar as a fabric additive. Moreover, it is highly effective in dye adsorption from wastewater generated during textile washing. In addition, it is often used as an additive in combination with clay, lime, and cement mortar for plastering bricks and concrete elements. It is also used as a shield against electromagnetic radiation in the electronics industry. Furthermore, biochar has given excellent results in the water-treatment sector at low costs. These factors are anticipated to increase the sales of biochar in several end-use sectors; thus, creating lucrative opportunities for the market.
The biochar market is segmented on the basis of production technology, application, and region. On the basis of production technology, the market is categorized into pyrolysis, gasification, and others. On the basis of application, it is divided into a soil amendment, animal feed, industrial, and others. Region-wise, the market is studied across North America, Europe, Asia-Pacific, and LAMEA.
The global biochar market profiles leading players that include: FARM2ENERGY Private LIMITED, Pacific Biochar Production, Karr Group Co. (KGC), Proactive Agriculture, Airex Energy Inc., Coaltec Energy USA, Frontline Bioenergy Ltd., Arsta Eco Pvt Ltd, Biochar Supreme, Carbofex Ltd. The global biochar market report provides an in-depth competitive analysis as well as profiles of these major players.
Key Benefits For Stakeholders
- This report provides a quantitative analysis of the market segments, current trends, estimations, and dynamics of the biochar market analysis from 2021 to 2031 to identify the prevailing biochar market opportunities.
- Market research is offered along with information related to key drivers, restraints, and opportunities.
- Porter's five forces analysis highlights the potency of buyers and suppliers to enable stakeholders to make profit-oriented business decisions and strengthen their supplier-buyer network.
- An in-depth analysis of the biochar market segmentation assists to determine the prevailing market opportunities.
- Major countries in each region are mapped according to their revenue contribution to the global market.
- Market player positioning facilitates benchmarking and provides a clear understanding of the present position of the market players.
- The report includes an analysis of the regional as well as global biochar market trends, key players, market segments, application areas, and market growth strategies.
Key Market Segments
By Production Technology
- Pyrolysis
- Gasification
- Others
By Application
- Soil Amendment
- Animal Feed
- Industrial
- Others
By Region
- North America
- U.S.
- Canada
- Mexico
- Europe
- Germany
- UK
- France
- Spain
- Italy
- Rest of Europe
- Asia-Pacific
- China
- Japan
- India
- South Korea
- Australia
- Indonesia
- Vietnam
- Thailand
- Rest of Asia-Pacific
- LAMEA
- Brazil
- Saudi Arabia
- South Africa
- Rest of LAMEA
Key Market Players:
- FARM2ENERGY Private LIMITED
- Pacific Biochar Production
- Karr Group Co. (KGC)
- Proactive Agriculture
- Airex Energy Inc.
- Coaltec Energy USA
- Frontline Bioenergy Ltd.
- Arsta Eco Pvt Ltd
- Biochar Supreme
- Carbofex Ltd.
TABLE OF CONTENTS
CHAPTER 1: INTRODUCTION
- 1.1. Report description
- 1.2. Key market segments
- 1.3. Key benefits to the stakeholders
- 1.4. Research Methodology
- 1.4.1. Primary research
- 1.4.2. Secondary research
- 1.4.3. Analyst tools and models
CHAPTER 2: EXECUTIVE SUMMARY
- 2.1. CXO Perspective
CHAPTER 3: MARKET OVERVIEW
- 3.1. Market definition and scope
- 3.2. Key findings
- 3.2.1. Top impacting factors
- 3.2.2. Top investment pockets
- 3.3. Porter's five forces analysis
- 3.3.1. Bargaining power of suppliers
- 3.3.2. Bargaining power of buyers
- 3.3.3. Threat of substitutes
- 3.3.4. Threat of new entrants
- 3.3.5. Intensity of rivalry
- 3.4. Market dynamics
- 3.4.1. Drivers
- 3.4.1.1. Escalating demand from agricultural sector
- 3.4.1.2. Increasing use of biochar in animal feeding
- 3.4.1.3. Robust demand from building & construction
- 3.4.1.4. Growing demand from water treatment sector
- 3.4.1.5. Renewable raw material sources
- 3.4.1. Drivers
- 3.4.2. Restraints
- 3.4.2.1. High investment costs
- 3.4.3. Opportunities
- 3.4.3.1. Emerging applications of biochar
- 3.4.3.2. Growth in corporate social responsibility (CSR)
- 3.5. COVID-19 Impact Analysis on the market
- 3.6. Key Regulation Analysis
- 3.7. Patent Landscape
- 3.8. Pricing Analysis
- 3.9. Value Chain Analysis
CHAPTER 4: BIOCHAR MARKET, BY PRODUCTION TECHNOLOGY
- 4.1. Overview
- 4.1.1. Market size and forecast
- 4.2. Pyrolysis
- 4.2.1. Key market trends, growth factors and opportunities
- 4.2.2. Market size and forecast, by region
- 4.2.3. Market share analysis by country
- 4.3. Gasification
- 4.3.1. Key market trends, growth factors and opportunities
- 4.3.2. Market size and forecast, by region
- 4.3.3. Market share analysis by country
- 4.4. Others
- 4.4.1. Key market trends, growth factors and opportunities
- 4.4.2. Market size and forecast, by region
- 4.4.3. Market share analysis by country
CHAPTER 5: BIOCHAR MARKET, BY APPLICATION
- 5.1. Overview
- 5.1.1. Market size and forecast
- 5.2. Soil Amendment
- 5.2.1. Key market trends, growth factors and opportunities
- 5.2.2. Market size and forecast, by region
- 5.2.3. Market share analysis by country
- 5.3. Animal Feed
- 5.3.1. Key market trends, growth factors and opportunities
- 5.3.2. Market size and forecast, by region
- 5.3.3. Market share analysis by country
- 5.4. Industrial
- 5.4.1. Key market trends, growth factors and opportunities
- 5.4.2. Market size and forecast, by region
- 5.4.3. Market share analysis by country
- 5.5. Others
- 5.5.1. Key market trends, growth factors and opportunities
- 5.5.2. Market size and forecast, by region
- 5.5.3. Market share analysis by country
CHAPTER 6: BIOCHAR MARKET, BY REGION
- 6.1. Overview
- 6.1.1. Market size and forecast By Region
- 6.2. North America
- 6.2.1. Key trends and opportunities
- 6.2.2. Market size and forecast, by Production Technology
- 6.2.3. Market size and forecast, by Application
- 6.2.4. Market size and forecast, by country
- 6.2.4.1. U.S.
- 6.2.4.1.1. Key market trends, growth factors and opportunities
- 6.2.4.1.2. Market size and forecast, by Production Technology
- 6.2.4.1.3. Market size and forecast, by Application
- 6.2.4.2. Canada
- 6.2.4.2.1. Key market trends, growth factors and opportunities
- 6.2.4.2.2. Market size and forecast, by Production Technology
- 6.2.4.2.3. Market size and forecast, by Application
- 6.2.4.3. Mexico
- 6.2.4.3.1. Key market trends, growth factors and opportunities
- 6.2.4.3.2. Market size and forecast, by Production Technology
- 6.2.4.3.3. Market size and forecast, by Application
- 6.3. Europe
- 6.3.1. Key trends and opportunities
- 6.3.2. Market size and forecast, by Production Technology
- 6.3.3. Market size and forecast, by Application
- 6.3.4. Market size and forecast, by country
- 6.3.4.1. Germany
- 6.3.4.1.1. Key market trends, growth factors and opportunities
- 6.3.4.1.2. Market size and forecast, by Production Technology
- 6.3.4.1.3. Market size and forecast, by Application
- 6.3.4.2. UK
- 6.3.4.2.1. Key market trends, growth factors and opportunities
- 6.3.4.2.2. Market size and forecast, by Production Technology
- 6.3.4.2.3. Market size and forecast, by Application
- 6.3.4.3. France
- 6.3.4.3.1. Key market trends, growth factors and opportunities
- 6.3.4.3.2. Market size and forecast, by Production Technology
- 6.3.4.3.3. Market size and forecast, by Application
- 6.3.4.4. Spain
- 6.3.4.4.1. Key market trends, growth factors and opportunities
- 6.3.4.4.2. Market size and forecast, by Production Technology
- 6.3.4.4.3. Market size and forecast, by Application
- 6.3.4.5. Italy
- 6.3.4.5.1. Key market trends, growth factors and opportunities
- 6.3.4.5.2. Market size and forecast, by Production Technology
- 6.3.4.5.3. Market size and forecast, by Application
- 6.3.4.6. Rest of Europe
- 6.3.4.6.1. Key market trends, growth factors and opportunities
- 6.3.4.6.2. Market size and forecast, by Production Technology
- 6.3.4.6.3. Market size and forecast, by Application
- 6.4. Asia-Pacific
- 6.4.1. Key trends and opportunities
- 6.4.2. Market size and forecast, by Production Technology
- 6.4.3. Market size and forecast, by Application
- 6.4.4. Market size and forecast, by country
- 6.4.4.1. China
- 6.4.4.1.1. Key market trends, growth factors and opportunities
- 6.4.4.1.2. Market size and forecast, by Production Technology
- 6.4.4.1.3. Market size and forecast, by Application
- 6.4.4.2. Japan
- 6.4.4.2.1. Key market trends, growth factors and opportunities
- 6.4.4.2.2. Market size and forecast, by Production Technology
- 6.4.4.2.3. Market size and forecast, by Application
- 6.4.4.3. India
- 6.4.4.3.1. Key market trends, growth factors and opportunities
- 6.4.4.3.2. Market size and forecast, by Production Technology
- 6.4.4.3.3. Market size and forecast, by Application
- 6.4.4.4. South Korea
- 6.4.4.4.1. Key market trends, growth factors and opportunities
- 6.4.4.4.2. Market size and forecast, by Production Technology
- 6.4.4.4.3. Market size and forecast, by Application
- 6.4.4.5. Australia
- 6.4.4.5.1. Key market trends, growth factors and opportunities
- 6.4.4.5.2. Market size and forecast, by Production Technology
- 6.4.4.5.3. Market size and forecast, by Application
- 6.4.4.6. Indonesia
- 6.4.4.6.1. Key market trends, growth factors and opportunities
- 6.4.4.6.2. Market size and forecast, by Production Technology
- 6.4.4.6.3. Market size and forecast, by Application
- 6.4.4.7. Vietnam
- 6.4.4.7.1. Key market trends, growth factors and opportunities
- 6.4.4.7.2. Market size and forecast, by Production Technology
- 6.4.4.7.3. Market size and forecast, by Application
- 6.4.4.8. Thailand
- 6.4.4.8.1. Key market trends, growth factors and opportunities
- 6.4.4.8.2. Market size and forecast, by Production Technology
- 6.4.4.8.3. Market size and forecast, by Application
- 6.4.4.9. Rest of Asia-Pacific
- 6.4.4.9.1. Key market trends, growth factors and opportunities
- 6.4.4.9.2. Market size and forecast, by Production Technology
- 6.4.4.9.3. Market size and forecast, by Application
- 6.5. LAMEA
- 6.5.1. Key trends and opportunities
- 6.5.2. Market size and forecast, by Production Technology
- 6.5.3. Market size and forecast, by Application
- 6.5.4. Market size and forecast, by country
- 6.5.4.1. Brazil
- 6.5.4.1.1. Key market trends, growth factors and opportunities
- 6.5.4.1.2. Market size and forecast, by Production Technology
- 6.5.4.1.3. Market size and forecast, by Application
- 6.5.4.2. Saudi Arabia
- 6.5.4.2.1. Key market trends, growth factors and opportunities
- 6.5.4.2.2. Market size and forecast, by Production Technology
- 6.5.4.2.3. Market size and forecast, by Application
- 6.5.4.3. South Africa
- 6.5.4.3.1. Key market trends, growth factors and opportunities
- 6.5.4.3.2. Market size and forecast, by Production Technology
- 6.5.4.3.3. Market size and forecast, by Application
- 6.5.4.4. Rest of LAMEA
- 6.5.4.4.1. Key market trends, growth factors and opportunities
- 6.5.4.4.2. Market size and forecast, by Production Technology
- 6.5.4.4.3. Market size and forecast, by Application
CHAPTER 7: COMPETITIVE LANDSCAPE
- 7.1. Introduction
- 7.2. Top winning strategies
- 7.3. Product Mapping of Top 10 Player
- 7.4. Competitive Dashboard
- 7.5. Competitive Heatmap
- 7.6. Top player positioning, 2021
CHAPTER 8: COMPANY PROFILES
- 8.1. Airex Energy Inc.
- 8.1.1. Company overview
- 8.1.2. Key Executives
- 8.1.3. Company snapshot
- 8.1.4. Operating business segments
- 8.1.5. Product portfolio
- 8.1.6. Key strategic moves and developments
- 8.2. Arsta Eco Pvt Ltd
- 8.2.1. Company overview
- 8.2.2. Key Executives
- 8.2.3. Company snapshot
- 8.2.4. Operating business segments
- 8.2.5. Product portfolio
- 8.3. Biochar Supreme
- 8.3.1. Company overview
- 8.3.2. Key Executives
- 8.3.3. Company snapshot
- 8.3.4. Operating business segments
- 8.3.5. Product portfolio
- 8.4. Coaltec Energy USA
- 8.4.1. Company overview
- 8.4.2. Key Executives
- 8.4.3. Company snapshot
- 8.4.4. Operating business segments
- 8.4.5. Product portfolio
- 8.5. FARM2ENERGY Private LIMITED
- 8.5.1. Company overview
- 8.5.2. Key Executives
- 8.5.3. Company snapshot
- 8.5.4. Operating business segments
- 8.5.5. Product portfolio
- 8.6. Frontline Bioenergy Ltd.
- 8.6.1. Company overview
- 8.6.2. Key Executives
- 8.6.3. Company snapshot
- 8.6.4. Operating business segments
- 8.6.5. Product portfolio
- 8.7. Karr Group Co. (KGC)
- 8.7.1. Company overview
- 8.7.2. Key Executives
- 8.7.3. Company snapshot
- 8.7.4. Operating business segments
- 8.7.5. Product portfolio
- 8.8. Pacific Biochar Production
- 8.8.1. Company overview
- 8.8.2. Key Executives
- 8.8.3. Company snapshot
- 8.8.4. Operating business segments
- 8.8.5. Product portfolio
- 8.9. Proactive Agriculture
- 8.9.1. Company overview
- 8.9.2. Key Executives
- 8.9.3. Company snapshot
- 8.9.4. Operating business segments
- 8.9.5. Product portfolio
- 8.10. Carbofex Ltd.
- 8.10.1. Company overview
- 8.10.2. Key Executives
- 8.10.3. Company snapshot
- 8.10.4. Operating business segments
- 8.10.5. Product portfolio