|
|
市場調査レポート
商品コード
1404826
濃縮バイオ炭の市場規模、シェア、動向分析レポート:用途別、地域別、セグメント予測、2024年~2030年Enriched Biochar Market Size, Share & Trends Analysis Report By Application (Agriculture, Gardening, Turf), By Region (Europe, North America, Asia Pacific, Central & South America, Middle East & Africa), And Segment Forecasts, 2024 - 2030 |
||||||
|
|
|||||||
カスタマイズ可能
|
|||||||

| 濃縮バイオ炭の市場規模、シェア、動向分析レポート:用途別、地域別、セグメント予測、2024年~2030年 |
|
出版日: 2023年11月30日
発行: Grand View Research
ページ情報: 英文 80 Pages
納期: 2~10営業日
|

全表示
- 概要
- 図表
- 目次
濃縮バイオ炭市場の成長と動向:
Grand View Research, Inc.の最新レポートによると、濃縮バイオ炭の世界市場規模は、2024年から2030年にかけて8.7%のCAGRを記録し、2030年には7,470万米ドルに達する見込みです。
この成長は、有機食品に対する需要の高まりに起因しています。濃縮バイオ炭は、土壌の肥沃度と構造を改善するのに役立つ持続可能な土壌改良材として機能します。バイオ炭は、土壌の養分利用性、保水性、微生物活性を向上させ、植物の生長と収量の改善につながります。土壌中の有機炭素を増加させ、土壌の強化に貢献し、結果として作物の生産性を向上させます。
有機栽培では合成農薬の使用が禁止されているため、一般的に有機農産物は残留農薬が少ないと認識されています。消費者は、特に子供や妊婦のような弱い立場の人々にとって、食品中の残留農薬が健康に及ぼす潜在的影響について、ますます懸念を強めています。有機製品に対する需要は、有機農法を実践している地元農家や小規模農家を支援する必要性からも生じています。消費者は有機製品を、持続可能で地域に根ざした農業を促進する方法としてとらえているのかもしれないです。このように、有機食品に対する需要の高まりは、予測期間にわたって製品需要を促進すると予想されます。
さらに、濃縮バイオ炭は土壌の肥沃度と構造を大幅に改善することができます。バイオ炭は高い表面積、多孔性、陽イオン交換容量を持ち、植物に養分を保持しゆっくりと放出することができます。最近の研究では、濃縮バイオ炭を施用することで、土壌の養分レベルが向上し、保水性が改善され、有益な微生物の活動が促進され、作物の収量増加につながることが示されています。例えば、Science of the Total Environment誌(2021年)に掲載された研究では、濃縮バイオ炭を稲作に使用することで、土壌の肥沃度が向上し、稲の穀物収量が20%増加することが実証されました。
濃縮バイオ炭市場レポートのハイライト
- 濃縮バイオ炭の添加は、植物の成長に必要なリン、カリウム、カルシウム、窒素、マグネシウムなどの栄養素を供給します。また、植物の栄養吸収や土壌の保水力を向上させ、土壌の質を改善します。
- 用途・セグメントにおけるガーデニングは、予測期間中に8.7%のCAGRが見込まれます。この成長は、園芸家が土壌の肥沃度を高め、植物の成長を促進し、化学肥料の使用を減らすために、環境に優しい代替品を常に求めているという事実に起因しています。そのような解決策の1つとして人気を博しているのが、ガーデニングにおける濃縮バイオ炭の応用です。土壌の健全性を高めるだけでなく、炭素排出量の削減にも貢献します。
- 北米地域は予測期間中にCAGR 8.5%を記録すると予想されています。これは同地域の広大な農地と多様な生態系に起因します。
- 北米における濃縮バイオ炭の需要は、穀物や食用作物の生産の増加によって牽引されており、米国農務省によると、穀物生産量は2018/2019年の4億3,757万8,000トンから2021/2022年には4億5,492万2,000トンに増加しています。この成長は、農地の拡大と作物の生産性向上の必要性に起因しています。
目次
第1章 調査手法と範囲
第2章 エグゼクティブサマリー
第3章 強化されたバイオ炭:市場変数、動向、範囲
- 市場系統の見通し
- 世界のバイオ炭市場の展望
- 業界のバリューチェーン分析
- 製造業の動向
- 販売チャネル分析
- 主要顧客
- 価格動向分析
- 価格に影響を与える要因
- 規制の枠組み(規格、コンプライアンス、承認、ポリシー)
- COVID-19感染症のパンデミックの影響
- 市場力学
- 市場促進要因分析
- 市場抑制要因分析
- 市場課題の分析
- 市場機会分析
- 業界分析ツール
- ポーターズ分析
- マクロ経済分析-PESTLE分析
第4章 濃縮バイオ炭市場:用途の推定・動向分析
- 用途の変動分析と市場シェア、2023年と2030年
- 農業
- 園芸
- 芝生
- その他の用途
第5章 濃縮バイオ炭市場:地域推定・動向分析
- 濃縮バイオ炭市場:地域別の見通し
- 北米
- 北米の濃縮バイオ炭市場の推定と予測、2018年~2030年
- 米国
- カナダ
- 欧州
- 欧州の濃縮バイオ炭市場の推定と予測、2018年~2030年
- ドイツ
- スペイン
- 英国
- フランス
- イタリア
- アジア太平洋
- アジア太平洋の濃縮バイオ炭市場の推定と予測、2018年~2030年
- 中国
- インド
- 日本
- 韓国
- ラテンアメリカ
- ラテンアメリカの濃縮バイオ炭市場の推定と予測、2018年~2030年
- コロンビア
- ブラジル
- メキシコ
- エクアドル
- ベネズエラ
- 中東・アフリカ
- 中東・アフリカの濃縮バイオ炭市場の推定と予測、2018年~2030年
- サウジアラビア
- 南アフリカ
第6章 競合情勢
- 企業の分類
- 企業の市場ポジショニング分析、2023年
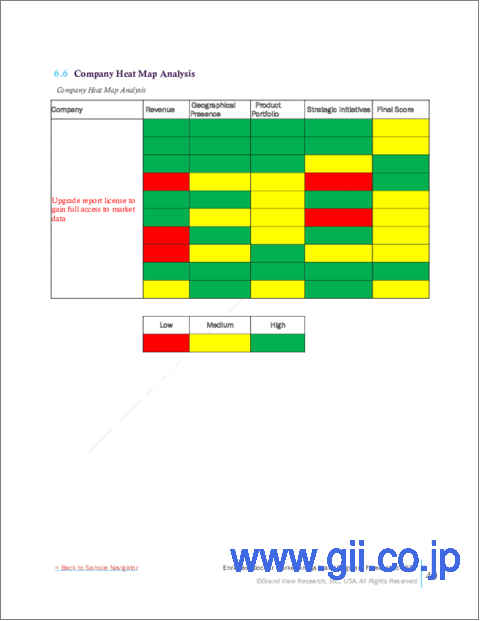
- 企業ヒートマップ分析
- 戦略マッピング
- 拡大
- 合併と買収
- 研究開発
- 会社一覧(事業概要、財務実績、製品ベンチマーク)
- Carbon Gold Ltd
- The Natural Charcoal Company
- The Dorset Charcoal Company
- Swiss Biochar GmbH
- CharGrow
- SymSoil
- Engrow Carbon Energy Private Limited
- SoilFixer
- Bio365
List of Tables
- Table 1 U.S. macro-economic outlay
- Table 2 Canada macro-economic outlay
- Table 3 Germany macro-economic outlay
- Table 4 Spain macro-economic outlay
- Table 5 UK macro-economic outlay
- Table 6 France macro-economic outlay
- Table 7 Italy macro-economic outlay
- Table 8 China macro-economic outlay
- Table 9 India macro-economic outlay
- Table 10 Japan macro-economic outlay
- Table 11 South Korea macro-economic outlay
- Table 12 Colombia macro-economic outlay
- Table 13 Brazil macro-economic outlay
- Table 14 Mexico macro-economic outlay
- Table 15 Ecuador macro-economic outlay
- Table 16 Venezuela macro-economic outlay
- Table 17 Saudi Arabia macro-economic outlay
- Table 18 South Africa macro-economic outlay
- Table 19 Company Heat Map Analysis
- Table 20 Key Companies undergoing expansions.
- Table 21 Key Companies involved in M&As
- Table 22 Key Companies undergoing research & development
- Table 23 Product Benchmarking
List of Figures
- Fig. 1 Enriched Biochar Market Segmentation & Scope
- Fig. 2 Information procurement
- Fig. 3 Data analysis models
- Fig. 4 Market formulation and validation
- Fig. 5 Data validation & publishing
- Fig. 6 Enriched Biochar Market Snapshot
- Fig. 7 Enriched Biochar Market Segment Snapshot
- Fig. 8 Enriched Biochar Market Competitive Landscape Snapshot
- Fig. 9 Global Biochar Market and Global Enriched Biochar Market Value, 2023 (USD Million)
- Fig. 10 Enriched Biochar Market: Industry Value Chain Analysis
- Fig. 11 Enriched Biochar Market: Price Trend Analysis, 2018 - 2030 (USD/Kg)
- Fig. 12 Enriched Biochar Market Dynamics
- Fig. 14 Development of world organic farming, 2010-2030 (USD Billion)
- Fig. 15 Enriched Biochar Market: PORTERs Analysis
- Fig. 16 Enriched Biochar Market: PESTLE Analysis
- Fig. 17 Enriched Biochar Market Estimates & Forecasts, by Application: Key Takeaways
- Fig. 18 Enriched Biochar Market Share, By Application, 2023 & 2030
- Fig. 19 Enriched Biochar Market Estimates & Forecasts, in Agriculture, 2018 - 2030 (Kilotons) (USD Million)
- Fig. 20 Enriched Biochar Market Estimates & Forecasts, in Gardening, 2018 - 2030 (Kilotons) (USD Million)
- Fig. 21 Enriched Biochar Market Estimates & Forecasts, in Turfs, 2018 - 2030 (Kilotons) (USD Million)
- Fig. 22 Enriched Biochar Market Estimates & Forecasts, in Other Applications, 2018 - 2030 (Kilotons) (USD Million)
- Fig. 23 Enriched Biochar Market Revenue, by Region, 2023 & 2030 (USD Million)
- Fig. 24 North America Enriched Biochar Market Estimates & Forecasts, 2018 - 2030 (Kilotons) (USD Million)
- Fig. 25 U.S. Enriched Biochar Market Estimates & Forecasts, 2018 - 2030 (Kilotons) (USD Million)
- Fig. 26 Canada Enriched Biochar Market Estimates & Forecasts, 2018 - 2030 (Kilotons) (USD Million)
- Fig. 27 Europe Enriched Biochar Market Estimates & Forecasts, 2018 - 2030 (Kilotons) (USD Million)
- Fig. 28 Germany Enriched Biochar Market Estimates & Forecasts, 2018 - 2030 (Kilotons) (USD Million)
- Fig. 29 Spain Enriched Biochar Market Estimates & Forecasts, 2018 - 2030 (Kilotons) (USD Million)
- Fig. 30 UK Enriched Biochar Market Estimates & Forecasts, 2018 - 2030 (Kilotons) (USD Million)
- Fig. 31 France Enriched Biochar Market Estimates & Forecasts, 2018 - 2030 (Kilotons) (USD Million)
- Fig. 32 Italy Enriched Biochar Market Estimates & Forecasts, 2018 - 2030 (Kilotons) (USD Million)
- Fig. 33 Asia Pacific Enriched Biochar Market Estimates & Forecasts, 2018 - 2030 (Kilotons) (USD Million)
- Fig. 34 China Enriched Biochar Market Estimates & Forecasts, 2018 - 2030 (Kilotons) (USD Million)
- Fig. 35 India Enriched Biochar Market Estimates & Forecasts, 2018 - 2030 (Kilotons) (USD Million)
- Fig. 36 Japan Enriched Biochar Market Estimates & Forecasts, 2018 - 2030 (Kilotons) (USD Million)
- Fig. 37 South Korea Enriched Biochar Market Estimates & Forecasts, 2018 - 2030 (Kilotons) (USD Million)
- Fig. 38 Latin America Enriched Biochar Market Estimates & Forecasts, 2018 - 2030 (Kilotons) (USD Million)
- Fig. 39 Columbia Enriched Biochar Market Estimates & Forecasts, 2018 - 2030 (Kilotons) (USD Million)
- Fig. 40 Brazil Enriched Biochar Market Estimates & Forecasts, 2018 - 2030 (Kilotons) (USD Million)
- Fig. 41 Mexico Enriched Biochar Market Estimates & Forecasts, 2018 - 2030 (Kilotons) (USD Million)
- Fig. 42 Ecuador Enriched Biochar Market Estimates & Forecasts, 2018 - 2030 (Kilotons) (USD Million)
- Fig. 43 Venezuela Enriched Biochar Market Estimates & Forecasts, 2018 - 2030 (Kilotons) (USD Million)
- Fig. 44 Middle East & Africa Enriched Biochar Market Estimates & Forecasts, 2018 - 2030 (Kilotons) (USD Million)
- Fig. 45 Saudi Arabia Enriched Biochar Market Estimates & Forecasts, 2018 - 2030 (Kilotons) (USD Million)
- Fig. 46 South Africa Enriched Biochar Market Estimates & Forecasts, 2018 - 2030 (Kilotons) (USD Million)
- Fig. 47 Key Company Categorization
- Fig. 48 Enriched Biochar Market - Company Market Positioning Analysis - 2022
- Fig. 49 Strategy Mapping
Enriched Biochar Market Growth & Trends:
The global enriched biochar market size is expected to reach USD 74.7 million by 2030, registering a CAGR of 8.7% from 2024 to 2030, as per the new report by Grand View Research, Inc. The growth is attributed to the growing demand for organic food. Enriched biochar serves as a sustainable soil amendment that helps improve soil fertility and structure. It can enhance nutrient availability, water retention, and microbial activity in the soil, leading to improved plant growth and yield. It helps increase organic carbon in soils and is responsible for soil enhancement, which results in augmenting crop productivity.
Organic products are generally perceived to have lower pesticide residues, as synthetic pesticides are prohibited in organic production. Consumers are increasingly concerned about the potential health effects of pesticide residues in food, especially for vulnerable groups like children and pregnant women. The demand for organic products also stems from the need to support local and small-scale farmers who often use organic farming practices. Consumers may view organic products as a way to promote sustainable and community-based agriculture. Thus, the advancing demand for organic food products is anticipated to drive the product demand over the forecast period.
Moreover, enriched biochar can significantly improve soil fertility and structure. It has a high surface area, porosity, and cation exchange capacity, allowing it to retain and slowly release nutrients to plants. Recent studies have shown that the application of the enriched biochar can enhance soil nutrient levels, improve water retention, and promote beneficial microbial activity, leading to higher crop yield. For example, a study published in the journal Science of the Total Environment (2021) demonstrated that the use of enriched biochar in rice cultivation improved soil fertility and increased rice grain yield by 20%.
Enriched Biochar Market Report Highlights:
- The addition of enriched biochar provides nutrients, such as phosphorus, potassium, calcium, nitrogen, and magnesium, required for plant growth. The product also helps improve the nutrient absorption of plants and the water-retaining capacity of the soil thus, improving soil quality
- Gardening in the application segment is anticipated to witness a CAGR of 8.7% over the forecast period. The growth is attributed to the fact that gardeners are constantly seeking eco-friendly alternatives to enhance soil fertility, increase plant growth, and reduce the use of chemical fertilizers. One such solution that has gained popularity is the application of enriched biochar in gardening. It not only helps improve soil health but also contributes toward reducing carbon emissions
- North America region is anticipated to witness a CAGR of 8.5% over the forecast period. This is attributed to vast agricultural lands and diverse ecosystems in the region
- The demand for enriched biochar in North America has been driven by the increasing production of cereals and food crops, which has resulted in a rise in grain production from 437,578 thousand metric tons in 2018/2019 to 454,922 thousand metric tons in 2021/2022, according to the United States Department of Agriculture. This growth can be attributed to the expansion of agricultural land and the need to enhance crop productivity
Table of Contents
Chapter 1 Methodology and Scope
- 1.1 Market Segmentation & Scope
- 1.2 Market Definition
- 1.3 Information Procurement
- 1.3.1 Purchased Database
- 1.3.2 Gvr's Internal Database
- 1.4 Information Analysis
- 1.5 Market Formulation & Data Visualization
- 1.6 Data Validation & Publishing
- 1.6.1 Research Scope And Assumptions
- 1.6.2 List To Data Sources
Chapter 2 Executive Summary
- 2.1 Market Snapshot
- 2.2 Segment Snapshot
- 2.3 Competitive Landscape Snapshot
Chapter 3 Enriched Biochar: Market Variables, Trends & Scope
- 3.1 Market Lineage Outlook
- 3.1.1 Global Biochar Market Outlook
- 3.2 Industry Value Chain Analysis
- 3.2.1 Manufacturing Trends
- 3.2.2 Sales Channel Analysis
- 3.2.3 Key Customers
- 3.3 Price Trend Analysis
- 3.3.1 Factors Influencing Prices
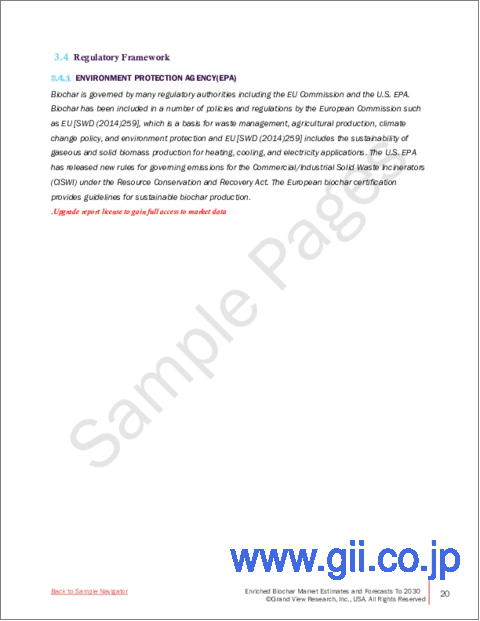
- 3.4 Regulatory Framework (Standards, Compliance, Approvals, And Policies)
- 3.5 Impact Of Covid-19 Pandemic
- 3.6 Market Dynamics
- 3.6.1 Market Driver Analysis
- 3.6.1.1 Rising need for Soil Remediation
- 3.6.1.2 Growing Demand for Organic Food
- 3.6.2 Market Restraint Analysis
- 3.6.2.1 Lack Of Awareness Among Consumers
- 3.6.3 Market Challenge Analysis
- 3.6.4 Market Opportunities Analysis
- 3.6.1 Market Driver Analysis
- 3.7 Industry Analysis Tools
- 3.7.1 Porters Analysis
- 3.7.2 Macroeconomic Analysis- Pestle Analysis
Chapter 4 Enriched Biochar Market: Application Estimates & Trend Analysis
- 4.1 Application Movement Analysis & Market Share, 2023 & 2030
- 4.1.1 Agriculture
- 4.1.2 Gardening
- 4.1.3 Turfs
- 4.1.4 Other Applications
Chapter 5 Enriched Biochar Market: Regional Estimates & Trend Analysis
- 5.1 Enriched Biochar Market: Regional Outlook
- 5.2 North America
- 5.2.1 North America Enriched Biochar Market Estimates & Forecasts, 2018 - 2030 (Kilotons) (USD Million)
- 5.2.2 U.S.
- 5.2.2.1 U.S. Enriched Biochar Market Estimates & Forecasts, 2018 - 2030 (Kilotons) (USD Million)
- 5.2.3 Canada
- 5.2.3.1 Canada Enriched Biochar Market Estimates & Forecasts, 2018 - 2030 (Kilotons) (USD Million)
- 5.3 Europe
- 5.3.1 Europe Enriched Biochar Market Estimates & Forecasts, 2018 - 2030 (Kilotons) (USD Million)
- 5.3.2 Germany
- 5.3.2.1 Germany Enriched Biochar Market Estimates & Forecasts, 2018 - 2030 (Kilotons) (USD Million)
- 5.3.3 Spain
- 5.3.3.1 Spain Enriched Biochar Market Estimates & Forecasts, 2018 - 2030 (Kilotons) (USD Million)
- 5.3.4 UK
- 5.3.4.1 UK Enriched Biochar Market Estimates & Forecasts, 2018 - 2030 (Kilotons) (USD Million)
- 5.3.5 France
- 5.3.5.1 France Enriched Biochar Market Estimates & Forecasts, 2018 - 2030 (Kilotons) (USD Million)
- 5.3.6 Italy
- 5.3.6.1 Italy Enriched Biochar Market Estimates & Forecasts, 2018 - 2030 (Kilotons) (USD Million)
- 5.4 Asia Pacific
- 5.4.1 Asia Pacific Enriched Biochar Market Estimates & Forecasts, 2018 - 2030 (Kilotons) (USD Million)
- 5.4.2 China
- 5.4.2.1 China Enriched Biochar Market Estimates & Forecasts, 2018 - 2030 (Kilotons) (USD Million)
- 5.4.3 India
- 5.4.3.1 India Enriched Biochar Market Estimates & Forecasts, 2018 - 2030 (Kilotons) (USD Million)
- 5.4.4 Japan
- 5.4.4.1 Japan Enriched Biochar Market Estimates & Forecasts, 2018 - 2030 (Kilotons) (USD Million)
- 5.4.5 South Korea
- 5.4.5.1 South Korea Enriched Biochar Market Estimates & Forecasts, 2018 - 2030 (Kilotons) (USD Million)
- 5.5 Latin America
- 5.5.1 Latin America Enriched Biochar Market Estimates & Forecasts, 2018 - 2030 (Kilotons) (USD Million)
- 5.5.2 Columbia
- 5.5.2.1 Columbia Enriched Biochar Market Estimates & Forecasts, 2018 - 2030 (Kilotons) (USD Million)
- 5.5.3 Brazil
- 5.5.3.1 Brazil Enriched Biochar Market Estimates & Forecasts, 2018 - 2030 (Kilotons) (USD Million)
- 5.5.4 Mexico
- 5.5.4.1 Mexico Enriched Biochar Market Estimates & Forecasts, 2018 - 2030 (Kilotons) (USD Million)
- 5.5.5 Ecuador
- 5.5.5.1 Ecuador Enriched Biochar Market Estimates & Forecasts, 2018 - 2030 (Kilotons) (USD Million)
- 5.5.6 Venezuela
- 5.5.6.1 Venezuela Enriched Biochar Market Estimates & Forecasts, 2018 - 2030 (Kilotons) (USD Million)
- 5.6 Middle East & Africa
- 5.6.1 Middle East & Africa Enriched Biochar Market Estimates & Forecasts, 2018 - 2030 (Kilotons) (USD Million)
- 5.6.2 Saudi Arabia
- 5.6.2.1 Saudi Arabia Enriched Biochar Market Estimates & Forecasts, 2018 - 2030 (Kilotons) (USD Million)
- 5.6.3 South Africa
- 5.6.3.1 South Africa Enriched Biochar Market Estimates & Forecasts, 2018 - 2030 (Kilotons) (USD Million)
Chapter 6 Competitive Landscape
- 6.1 Company Categorization
- 6.2 Company Market Positioning Analysis 2023
- 6.3 Company Heat Map Analysis
- 6.4 Strategy Mapping
- 6.4.1 Expansion
- 6.4.2 Mergers & Acquisition
- 6.4.3 Reasearch & Development
- 6.5 Company Listing (Business Overview, Financial Performance, Product Benchmarking)
- 6.5.1 Carbon Gold Ltd
- 6.5.2 The Natural Charcoal Company
- 6.5.3 The Dorset Charcoal Company
- 6.5.4 Swiss Biochar GmbH
- 6.5.5 CharGrow
- 6.5.6 SymSoil
- 6.5.7 Engrow Carbon Energy Private Limited
- 6.5.8 SoilFixer
- 6.5.9 Bio365

