|
|
市場調査レポート
商品コード
1405019
バイオ炭の市場規模、シェア、動向分析レポート:技術別、用途別、地域別、セグメント予測、2024-2030年Biochar Market Size, Share & Trends Analysis Report By Technology (Gasification, Pyrolysis), By Application (Agriculture, Others), By Region (North America, Asia Pacific), And Segment Forecasts, 2024 - 2030 |
||||||
|
|
|||||||
カスタマイズ可能
|
|||||||


| バイオ炭の市場規模、シェア、動向分析レポート:技術別、用途別、地域別、セグメント予測、2024-2030年 |
|
出版日: 2023年11月24日
発行: Grand View Research
ページ情報: 英文 200 Pages
納期: 2~10営業日
|

全表示
- 概要
- 図表
- 目次
バイオ炭市場の成長と動向:
Grand View Research, Inc.の最新レポートによると、世界のバイオ炭市場規模は2024年から2030年にかけて13.9%のCAGRを記録し、2030年には13億5,000万米ドルに達する見込みです。
有機農業における同製品の需要が世界的に増加していることが、成長に影響を与える主な要因となっています。また、家畜の飼料としての消費の増加や土壌改良材としてのバイオ炭の利点に関する認識が需要を促進すると予想されています。
バイオ炭は発展途上の産業であり、農業部門の作物収量と生産性の向上に大きな影響を与える要因になると予想されています。土壌肥沃度を向上させ、作物に必要な栄養を与えます。さらに、エネルギー生産と温室効果ガス浄化への応用は、このセクターに新たな収益機会を提供すると期待されています。
市場は、組織化されたメーカーと組織化されていないメーカーで構成されています。中国、インド、日本、メキシコ、ブラジルのような経済成長国は、主に村落地域で中小規模の産業を通じてかなりの量のバイオ炭を生産しています。一方、大規模メーカーは北米に集中しています。
農業用途の消費量は2022年に最も多く、予測期間中に大幅に増加すると予想されています。農業における様々な用途の中で、農業は2022年に最も高い市場シェアを占めました。
量的には、農業セクターは予測期間中に急速な成長を遂げると予測されます。また、飼料添加物として畜産分野でも高い人気を得ています。畜産部門は、特に欧州や北米のような、動物の肉が食品として人間に広く消費されている地域で、高い重要性を獲得しています。この結果、バイオ炭の消費量は当面大きく伸びると予想されます。
バイオ炭市場のハイライト
- 2023年に熱分解技術を用いて製造された製品全体が、収益ベースで65.1%の市場シェアを占め、推定期間中に急速な成長が見込まれます。
- アジア太平洋地域は、家畜飼料や有機農業への応用が増加しているため、今後数年間で大幅な成長が見込まれます。
- 熱分解技術は、バイオ炭市場で事業展開している他のメーカーの中でも、Earth Systems社やClean Fuels B.V.社によってますます使用されるようになってきています。
目次
第1章 調査手法と範囲
第2章 エグゼクティブサマリー
第3章 バイオ炭市場:市場変数、動向、範囲
- 市場系統の見通し
- 世界のバイオ炭市場の展望
- 業界のバリューチェーン分析
- 製造・技術動向
- 販売チャネル分析
- 潜在的なエンドユーザーのリスト
- 価格に影響を与える要因
- 地域別の規制枠組み
- 市場力学
- 市場促進要因分析
- 市場抑制要因分析
- 市場課題の分析
- 市場機会分析
- 事業環境分析
- ポーターの分析
- PESTEL分析
第4章 バイオ炭市場:サプライヤーのポートフォリオ分析
- 主要な原材料サプライヤーのリスト
- 原材料の動向
- ポートフォリオ分析/Kraljicマトリックス
- エンゲージメントモデル
- 交渉戦略
- 調達のベストプラクティス
第5章 バイオ炭市場:技術の推定・動向分析
- 技術の変動分析と市場シェア、2023年と2030年
- 熱分解
- ガス化
- その他の技術
第6章 バイオ炭市場:用途の推定・動向分析
- 用途の変動分析と市場シェア、2023年と2030年
- 農業
- その他の用途
第7章 バイオ炭市場:地域の推定・動向分析
- バイオ炭市場:地域別の見通し
- 北米
- 技術別、2018~2030年
- 用途別、2018~2030年
- 米国
- カナダ
- メキシコ
- 欧州
- 技術別、2018~2030年
- 用途別、2018~2030年
- ドイツ
- 英国
- フランス
- スウェーデン
- デンマーク
- アジア太平洋地域
- 技術別、2018~2030年
- 用途別、2018~2030年
- 中国
- インド
- 日本
- マレーシア
- オーストラリア
- 中南米
- 技術別、2018~2030年
- 用途別、2018~2030年
- 中東とアフリカ
- 技術別、2018~2030年
- 用途別、2018~2030年
第8章 競合情勢
- 主要市場参入企業による最近の開発と影響分析
- 企業の分類
- 企業の市場ポジショニング分析、2023年
- 企業ヒートマップ分析
- 戦略マッピング
- 会社一覧(事業概要、財務実績、製品ベンチマーク)
- Biochar Products, Inc.
- Biochar Supreme, LLC
- ArSta Eco
- Carbon Gold Ltd
- Airex Energy Inc.
- Pacific Biochar Benefit Corporation
- Biochar Ireland
- Swiss Biochar GmbH
- Sonnenerde GmbH
- Pyro power
- Stiesdal
- Novocarbo
List of Tables
- Table 1 List Of Key End Users
- Table 2 Global Biochar Market Estimates & Forecast, By Technology, 2018 - 2030 (Kilotons)
- Table 3 Global Biochar Market Estimates & Forecast, By Technology, 2018 - 2030 (USD Million)
- Table 4 Global Biochar Market Estimates & Forecast, By Application, 2018 - 2030 (Kilotons)
- Table 5 Global Biochar Market Estimates & Forecast, By Application, 2018 - 2030 (USD Million)
- Table 6 Global Biochar Market Estimates & Forecast, By Region, 2018 - 2030 (Kilotons)
- Table 7 Global Biochar Market Estimates & Forecast, By Region, 2018 - 2030 (USD Million)
- Table 8 North America Biochar Market Estimates And Forecast, By Technology, 2018 - 2030 (Kilotons)
- Table 9 North America Biochar Market Estimates And Forecast, By Technology, 2018 - 2030 (USD Million)
- Table 10 North America Biochar Market Estimates And Forecast, By Application, 2018 - 2030 (Kilotons)
- Table 11 North America Biochar Market Estimates And Forecast, By Application, 2018 - 2030 (USD Million)
- Table 12 U.S. Macro-Economic Outlay
- Table 13 U.S. Biochar Market Estimates And Forecast, By Technology, 2018 - 2030 (Kilotons)
- Table 14 U.S. Biochar Market Estimates And Forecast, By Technology, 2018 - 2030 (USD Million)
- Table 15 U.S. Biochar Market Estimates And Forecast, By Application, 2018 - 2030 (Kilotons)
- Table 16 U.S. Biochar Market Estimates And Forecast, By Application, 2018 - 2030 (USD Million)
- Table 17 Canada Macro-Economic Outlay
- Table 18 Canada Biochar Market Estimates And Forecast, By Technology, 2018 - 2030 (Kilotons)
- Table 19 Canada Biochar Market Estimates And Forecast, By Technology, 2018 - 2030 (USD Million)
- Table 20 Canada Biochar Market Estimates And Forecast, By Application, 2018 - 2030 (Kilotons)
- Table 21 Canada Biochar Market Estimates And Forecast, By Application, 2018 - 2030 (USD Million)
- Table 22 Mexico Macro-Economic Outlay
- Table 23 Mexico Biochar Market Estimates And Forecast, By Technology, 2018 - 2030 (Kilotons)
- Table 24 Mexico Biochar Market Estimates And Forecast, By Technology, 2018 - 2030 (USD Million)
- Table 25 Mexico Biochar Market Estimates And Forecast, By Application, 2018 - 2030 (Kilotons)
- Table 26 Mexico Biochar Market Estimates And Forecast, By Application, 2018 - 2030 (USD Million)
- Table 27 Europe Biochar Market Estimates And Forecast, By Technology, 2018 - 2030 (Kilotons)
- Table 28 Europe Biochar Market Estimates And Forecast, By Technology, 2018 - 2030 (USD Million)
- Table 29 Europe Biochar Market Estimates And Forecast, By Application, 2018 - 2030 (Kilotons)
- Table 30 Europe Biochar Market Estimates And Forecast, By Application, 2018 - 2030 (USD Million)
- Table 31 Germany Macro-Economic Outlay
- Table 32 Germany Biochar Market Estimates And Forecast, By Technology, 2018 - 2030 (Kilotons)
- Table 33 Germany Biochar Market Estimates And Forecast, By Technology, 2018 - 2030 (USD Million)
- Table 34 Germany Biochar Market Estimates And Forecast, By Application, 2018 - 2030 (Kilotons)
- Table 35 Germany Biochar Market Estimates And Forecast, By Application, 2018 - 2030 (USD Million)
- Table 36 UK Macro-Economic Outlay
- Table 37 UK Biochar Market Estimates And Forecast, By Technology, 2018 - 2030 (Kilotons)
- Table 38 UK Biochar Market Estimates And Forecast, By Technology, 2018 - 2030 (USD Million)
- Table 39 UK Biochar Market Estimates And Forecast, By Application, 2018 - 2030 (Kilotons)
- Table 40 UK Biochar Market Estimates And Forecast, By Application, 2018 - 2030 (USD Million)
- Table 41 France Macro-Economic Outlay
- Table 42 France Biochar Market Estimates And Forecast, By Technology, 2018 - 2030 (Kilotons)
- Table 43 France Biochar Market Estimates And Forecast, By Technology, 2018 - 2030 (USD Million)
- Table 44 France Biochar Market Estimates And Forecast, By Application, 2018 - 2030 (Kilotons)
- Table 45 France Biochar Market Estimates And Forecast, By Application, 2018 - 2030 (USD Million)
- Table 46 Sweden Macro-Economic Outlay
- Table 47 Sweden Biochar Market Estimates And Forecast, By Technology, 2018 - 2030 (Kilotons)
- Table 48 Sweden Biochar Market Estimates And Forecast, By Technology, 2018 - 2030 (USD Million)
- Table 49 Sweden Biochar Market Estimates And Forecast, By Application, 2018 - 2030 (Kilotons)
- Table 50 Sweden Biochar Market Estimates And Forecast, By Application, 2018 - 2030 (USD Million)
- Table 51 Denmark Macro-Economic Outlay
- Table 52 Denmark Biochar Market Estimates And Forecast, By Technology, 2018 - 2030 (Kilotons)
- Table 53 Denmark Biochar Market Estimates And Forecast, By Technology, 2018 - 2030 (USD Million)
- Table 54 Denmark Biochar Market Estimates And Forecast, By Application, 2018 - 2030 (Kilotons)
- Table 55 Denmark Biochar Market Estimates And Forecast, By Application, 2018 - 2030 (USD Million)
- Table 56 Asia Pacific Biochar Market Estimates And Forecast, By Technology, 2018 - 2030 (Kilotons)
- Table 57 Asia Pacific Biochar Market Estimates And Forecast, By Technology, 2018 - 2030 (USD Million)
- Table 58 Asia Pacific Biochar Market Estimates And Forecast, By Application, 2018 - 2030 (Kilotons)
- Table 59 Asia Pacific Biochar Market Estimates And Forecast, By Application, 2018 - 2030 (USD Million)
- Table 60 China Macro-Economic Outlay
- Table 61 China Biochar Market Estimates And Forecast, By Technology, 2018 - 2030 (Kilotons)
- Table 62 China Biochar Market Estimates And Forecast, By Technology, 2018 - 2030 (USD Million)
- Table 63 China Biochar Market Estimates And Forecast, By Application, 2018 - 2030 (Kilotons)
- Table 64 China Biochar Market Estimates And Forecast, By Application, 2018 - 2030 (USD Million)
- Table 65 India Macro-Economic Outlay
- Table 66 India Biochar Market Estimates And Forecast, By Technology, 2018 - 2030 (Kilotons)
- Table 67 India Biochar Market Estimates And Forecast, By Technology, 2018 - 2030 (USD Million)
- Table 68 India Biochar Market Estimates And Forecast, By Application, 2018 - 2030 (Kilotons)
- Table 69 India Biochar Market Estimates And Forecast, By Application, 2018 - 2030 (USD Million)
- Table 70 Japan Macro-Economic Outlay
- Table 71 Japan Biochar Market Estimates And Forecast, By Technology, 2018 - 2030 (Kilotons)
- Table 72 Japan Biochar Market Estimates And Forecast, By Technology, 2018 - 2030 (USD Million)
- Table 73 Japan Biochar Market Estimates And Forecast, By Application, 2018 - 2030 (Kilotons)
- Table 74 Japan Biochar Market Estimates And Forecast, By Application, 2018 - 2030 (USD Million)
- Table 75 Malaysia Macro-Economic Outlay
- Table 76 Malaysia Biochar Market Estimates And Forecast, By Technology, 2018 - 2030 (Kilotons)
- Table 77 Malaysia Biochar Market Estimates And Forecast, By Technology, 2018 - 2030 (USD Million)
- Table 78 Malaysia Biochar Market Estimates And Forecast, By Application, 2018 - 2030 (Kilotons)
- Table 79 Malaysia Biochar Market Estimates And Forecast, By Application, 2018 - 2030 (USD Million)
- Table 80 Australia Macro-Economic Outlay
- Table 81 Australia Biochar Market Estimates And Forecast, By Technology, 2018 - 2030 (Kilotons)
- Table 82 Australia Biochar Market Estimates And Forecast, By Technology, 2018 - 2030 (USD Million)
- Table 83 Australia Biochar Market Estimates And Forecast, By Application, 2018 - 2030 (Kilotons)
- Table 84 Australia Biochar Market Estimates And Forecast, By Application, 2018 - 2030 (USD Million)
- Table 85 Central & South America Biochar Market Estimates And Forecast, By Technology, 2018 - 2030 (Kilotons)
- Table 86 Central & South America Biochar Market Estimates And Forecast, By Technology, 2018 - 2030 (USD Million)
- Table 87 Central & South America Biochar Market Estimates And Forecast, By Application, 2018 - 2030 (Kilotons)
- Table 88 Central & South America Biochar Market Estimates And Forecast, By Application, 2018 - 2030 (USD Million)
- Table 89 Middle East & Africa Biochar Market Estimates And Forecast, By Technology, 2018 - 2030 (Kilotons)
- Table 90 Middle East & Africa Biochar Market Estimates And Forecast, By Technology, 2018 - 2030 (USD Million)
- Table 91 Middle East & Africa Biochar Market Estimates And Forecast, By Application, 2018 - 2030 (Kilotons)
- Table 92 Middle East & Africa Biochar Market Estimates And Forecast, By Application, 2018 - 2030 (USD Million)
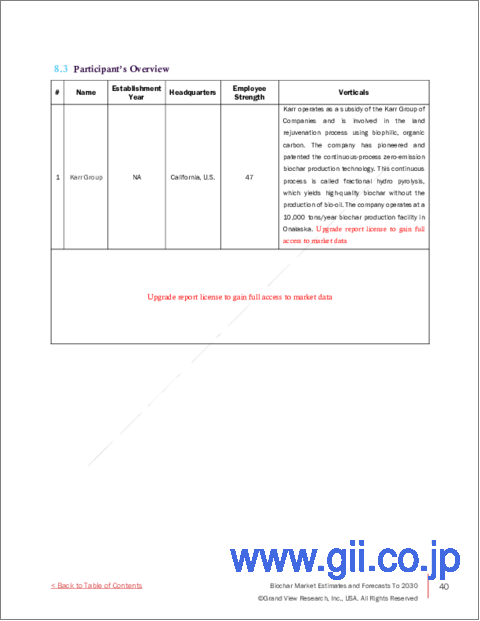
- Table 93 Participant's Overview
- Table 94 Financial Performance
- Table 95 Application Benchmarking
- Table 96 Recent Developments & Impact Analysis, By Key Market Participants
- Table 97 Company Heat Map Analysis
List of Figures
- Fig. 1 Biochar Market Segmentation & Scope
- Fig. 2 Information Procurement
- Fig. 3 Data Analysis Models
- Fig. 4 Market Formulation And Validation
- Fig. 5 Data Validating & Publishing
- Fig. 6 Biochar Market Snapshot
- Fig. 7 Biochar Market Regional Snapshot
- Fig. 8 Biochar Market Segment Snapshot
- Fig. 9 Biochar Market Competitive Landscape Snapshot
- Fig. 10 Biochar Market Value, 2022 (USD Million)
- Fig. 11 Biochar Market - Value Chain Analysis
- Fig. 12 Biochar Market - Price Trend Analysis 2018 - 2030 (USD/Kg)
- Fig. 13 Biochar Market - Market Dynamics
- Fig. 14 Porter's Analysis
- Fig. 15 Pestel Analysis
- Fig. 16 Biochar Market Estimates & Forecasts, By Technology: Key Takeaways
- Fig. 17 Biochar Market Share, By Technology, 2022 & 2030
- Fig. 18 Pyrolysis Market Estimates & Forecasts, 2018 - 2030 (Kilotons) (USD Million)
- Fig. 19 Gasification Market Estimates & Forecasts, 2018 - 2030 (Kilotons) (USD Million)
- Fig. 20 Other Technologies Market Estimates & Forecasts, 2018 - 2030 (Kilotons) (USD Million)
- Fig. 21 Biochar Market Estimates & Forecasts, By Application: Key Takeaways
- Fig. 22 Biochar Market Share, By Application, 2023 & 2030
- Fig. 23 Biochar Market Estimates & Forecasts, In Agriculture, 2018 - 2030 (Kilotons) (USD Million)
- Fig. 24 Agriculture Biochar Market Estimates & Forecasts, Livestock, 2018 - 2030 (Kilotons) (USD Million)
- Fig. 25 Agriculture Biochar Market Estimates & Forecasts, In Farming, 2018 - 2030 (Kilotons) (USD Million)
- Fig. 26 Agriculture Biochar Market Estimates & Forecasts, In Others, 2018 - 2030 (Kilotons) (USD Million)
- Fig. 27 Biochar Market Estimates & Forecasts, In Others Applications, 2018 - 2030 (Kilotons) (USD Million)
- Fig. 28 Biochar Market Revenue, By Region, 2023 & 2030 (USD Million)
- Fig. 29 North America Biochar Market Estimates & Forecasts, 2018 - 2030 (Kilotons) (Kilotons) (USD Million)
- Fig. 30 U.S. Biochar Market Estimates & Forecasts, 2018 - 2030 (Kilotons) (USD Million)
- Fig. 31 Canada Biochar Market Estimates & Forecasts, 2018 - 2030 (Kilotons) (USD Million)
- Fig. 32 Mexico Biochar Market Estimates & Forecasts, 2018 - 2030 (Kilotons) (USD Million)
- Fig. 33 Europe Biochar Market Estimates & Forecasts, 2018 - 2030 (Kilotons) (USD Million)
- Fig. 34 Germany Biochar Market Estimates & Forecasts, 2018 - 2030 (Kilotons) (USD Million)
- Fig. 35 UK Biochar Market Estimates & Forecasts, 2018 - 2030 (Kilotons) (USD Million)
- Fig. 36 France Biochar Market Estimates & Forecasts, 2018 - 2030 (Kilotons) (USD Million)
- Fig. 37 Sweden Biochar Market Estimates & Forecasts, 2018 - 2030 (Kilotons) (USD Million)
- Fig. 38 Denmark Biochar Market Estimates & Forecasts, 2018 - 2030 (Kilotons) (USD Million)
- Fig. 39 Asia Pacific Biochar Market Estimates & Forecasts, 2018 - 2030 (Kilotons) (USD Million)
- Fig. 40 China Biochar Market Estimates & Forecasts, 2018 - 2030 (Kilotons) (USD Million)
- Fig. 41 India Biochar Market Estimates & Forecasts, 2018 - 2030 (Kilotons) (USD Million)
- Fig. 42 Japan Biochar Market Estimates & Forecasts, 2018 - 2030 (Kilotons) (USD Million)
- Fig. 43 Malaysia Biochar Market Estimates & Forecasts, 2018 - 2030 (Kilotons) (USD Million)
- Fig. 44 Australia Biochar Market Estimates & Forecasts, 2018 - 2030 (Kilotons) (USD Million)
- Fig. 45 Central & South America Biochar Market Estimates & Forecasts, 2018 - 2030 (Kilotons) (USD Million)
- Fig. 46 Middle East & Africa Biochar Market Estimates & Forecasts, 2018 - 2030 (Kilotons) (USD Million)
- Fig. 47 Key Company Categorization
- Fig. 48 Company Market Positioning
- Fig. 49 Strategy Mapping
Biochar Market Growth & Trends:
The global biochar market size is expected to reach USD 1.35 billion by 2030, registering a CAGR of 13.9% from 2024 to 2030, according to a new report by Grand View Research, Inc. Globally increasing demand for the product in organic farming has been a major factor influencing the growth. In addition, increasing consumption in livestock feed and awareness pertaining to benefits of biochar as soil amendment are expected to drive the demand.
Biochar is an evolving industry and is anticipated to become a major influencing factor in increased crop yield and productivity of the agriculture sector. It improves soil fertility and provides necessary nutrition to crop. Moreover, applications in energy production and greenhouse gas remediation are expected to provide new revenue opportunities to the sector.
The market consists of organized and unorganized manufacturers. Growing economies such as China, India, Japan, Mexico, and Brazil produce significant amount of biochar through small and medium scale industries mainly running into village areas. Whereas, large scale manufacturers are concentrated in North America.
Consumption in agricultural application was the highest in 2022 and is anticipated to rise significantly over the forecast period. Among various applications in agriculture, farming held the highest market share in 2022.
In terms of volume, the agriculture sector is estimated to witness speedy growth over the forecast period. It has also gained high popularity in livestock farming as an additive in animal feed. The livestock sector has gained high importance, especially in regions such as Europe and North America where animal flesh is extensively consumed by human beings as a food. As a result of this, biochar consumption is expected to grow substantially in the foreseeable future.
Biochar Market Report Highlights:
- Total product manufactured using pyrolysis technology in 2023 accounted for 65.1% market share in terms of revenue and is expected witness rapid growth over the estimated period
- Asia Pacific is expected to witness extensive growth in the forthcoming years due to increasing application of the product in livestock feed and organic farming
- Pyrolysis technology is increasingly used by Earth Systems and Clean Fuels B.V. among other manufacturers operating in the biochar market.
Table of Contents
Chapter 1 Methodology And Scope
- 1.1 Market Segmentation & Scope
- 1.2 Market Definition
- 1.3 Information Procurement
- 1.3.1 Purchased Database
- 1.3.2 Gvr's Internal Database
- 1.3.3 Secondary Sources & Third-Party Perspectives
- 1.4 Information Analysis
- 1.4.1 Data Analysis Models
- 1.5 Market Formulation & Data Visualization
- 1.6 Data Validation & Publishing
- 1.7 Research Scope And Assumptions
Chapter 2 Executive Summary
- 2.1 Market Snapshot
- 2.2 Segment Snapshot
- 2.3 Competitive Landscape Snapshot
Chapter 3 Biochar Market: Market Variables, Trends & Scope
- 3.1 Market Lineage Outlook
- 3.1.1 Global Biochar Market Outlook
- 3.2 Industry Value Chain Analysis
- 3.2.1 Manufacturing/Technology Trends
- 3.2.2 Sales Channel Analysis
- 3.2.3 List Of Potential End-Users
- 3.3 Price Trend Analysis, 2018 - 2030
- 3.3.1 Factors Affecting Prices
- 3.4 Regulatory Framework, By Regions
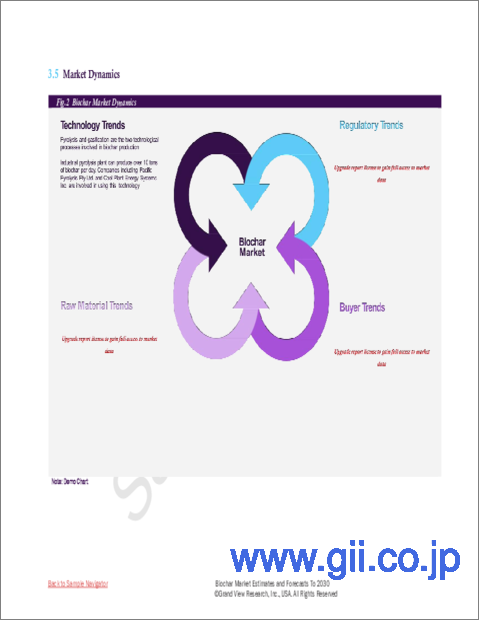
- 3.5 Market Dynamics
- 3.5.1 Market Driver Analysis
- 3.5.2 Market Restraint Analysis
- 3.5.3 Market Challenges Analysis
- 3.5.4 Market Opportunity Analysis
- 3.6 Business Environment Analysis
- 3.6.1 PORTER'S Analysis
- 3.6.2 PESTEL Analysis
Chapter 4 Biochar Market: Supplier Portfolio Analysis
- 4.1 List Of Key Raw Material Suppliers
- 4.2 Raw Material Trends
- 4.3 Portfolio Analysis/Kraljic Matrix
- 4.4 Engagement Model
- 4.5 Negotiation Strategies
- 4.6 Sourcing Best Practices
Chapter 5 Biochar Market: Technology Estimates & Trend Analysis
- 5.1 Technology Movement Analysis & Market Share, 2023 & 2030
- 5.1.1 Pyrolysis
- 5.1.1.1 Pyrolysis Market Estimates And Forecast, 2018 - 2030 (Kilotons) (USD Million)
- 5.1.2 Gasification
- 5.1.2.1 Gasification Market Estimates And Forecast, 2018 - 2030 (Kilotons) (USD Million)
- 5.1.4 Other Technology
- 5.1.4.1 Other Technology Market Estimates And Forecast, 2018 - 2030 (Kilotons) (USD Million)
- 5.1.1 Pyrolysis
Chapter 6 Biochar Market: Application Estimates & Trend Analysis
- 6.1 Application Movement Analysis & Market Share, 2023 & 2030
- 6.1.1 Agriculture
- 6.1.1.1 Biochar Market Estimates And Forecast, In Agriculture, 2018 - 2030 (Kilotons) (USD Million)
- 6.1.1.2 Biochar Market Estimates And Forecast, In Livestock, 2018 - 2030 (Kilotons) (USD Million)
- 6.1.1.3 Biochar Market Estimates And Forecast, In Farming, 2018 - 2030 (Kilotons) (USD Million)
- 6.1.1.4 Biochar Market Estimates And Forecast, In Others, 2018 - 2030 (Kilotons) (USD Million)
- 6.1.5 Other Applications
- 6.1.5.1 Biochar Market Estimates And Forecast, In Other Applications, 2018 - 2030 (Kilotons) (USD Million)
- 6.1.1 Agriculture
Chapter 7 Biochar Market: Regional Estimates & Trend Analysis
- 7.1 Biochar Market: Regional Outlook
- 7.2 North America
- 7.2.1 North America Biochar Market Estimates And Forecasts, By Technology, 2018 - 2030 (Kilotons) (USD Million)
- 7.2.2 North America Biochar Market Estimates And Forecasts, By Application, 2018 - 2030 (Kilotons) (USD Million)
- 7.2.3 U.S.
- 7.2.3.1 Key Country Dynamics
- 7.2.3.2 U.S. Biochar Market Estimates And Forecasts, By Technology, 2018 - 2030 (Kilotons) (USD Million)
- 7.2.3.3 U.S. Biochar Market Estimates And Forecasts, By Application, 2018 - 2030 (Kilotons) (USD Million)
- 7.2.4 Canada
- 7.2.4.1 Key Country Dynamics
- 7.2.4.2 Canada Biochar Market Estimates And Forecasts, By Technology, 2018 - 2030 (Kilotons) (USD Million)
- 7.2.4.3 Canada Biochar Market Estimates And Forecasts, By Application, 2018 - 2030 (Kilotons) (USD Million)
- 7.2.5 Mexico
- 7.2.5.1 Key Country Dynamics
- 7.2.5.2 Mexico Biochar Market Estimates And Forecasts, By Technology, 2018 - 2030 (Kilotons) (USD Million)
- 7.2.5.3 Mexico Biochar Market Estimates And Forecasts, By Application, 2018 - 2030 (Kilotons) (USD Million)
- 7.3 Europe
- 7.3.1 Europe Biochar Market Estimates And Forecasts, By Technology, 2018 - 2030 (Kilotons) (USD Million)
- 7.3.2 Europe Biochar Market Estimates And Forecasts, By Application, 2018 - 2030 (Kilotons) (USD Million)
- 7.3.3 Germany
- 7.3.3.1 Key Country Dynamics
- 7.3.3.2 Germany Biochar Market Estimates And Forecasts, By Technology, 2018 - 2030 (Kilotons) (USD Million)
- 7.3.3.3 Germany Biochar Market Estimates And Forecasts, By Application, 2018 - 2030 (Kilotons) (USD Million)
- 7.3.4 UK
- 7.3.4.1 Key Country Dynamics
- 7.3.4.2 UK Biochar Market Estimates And Forecasts, By Technology, 2018 - 2030 (Kilotons) (USD Million)
- 7.3.4.3 UK Biochar Market Estimates And Forecasts, By Application, 2018 - 2030 (Kilotons) (USD Million)
- 7.3.5 France
- 7.3.5.1 Key Country Dynamics
- 7.3.5.2 France Biochar Market Estimates And Forecasts, By Technology, 2018 - 2030 (Kilotons) (USD Million)
- 7.3.5.3 France Biochar Market Estimates And Forecasts, By Application, 2018 - 2030 (Kilotons) (USD Million)
- 7.3.6 Sweden
- 7.3.6.1 Key Country Dynamics
- 7.3.6.2 Sweden Biochar Market Estimates And Forecasts, By Technology, 2018 - 2030 (Kilotons) (USD Million)
- 7.3.6.3 Sweden Biochar Market Estimates And Forecasts, By Application, 2018 - 2030 (Kilotons) (USD Million)
- 7.3.7 Denmark
- 7.3.7.1 Key Country Dynamics
- 7.3.7.2 Denmark Biochar Market Estimates And Forecasts, By Technology, 2018 - 2030 (Kilotons) (USD Million)
- 7.3.7.3 Denmark Biochar Market Estimates And Forecasts, By Application, 2018 - 2030 (Kilotons) (USD Million)
- 7.4 Asia Pacific
- 7.4.1 Asia Pacific Biochar Market Estimates And Forecasts, By Technology, 2018 - 2030 (Kilotons) (USD Million)
- 7.4.2 Asia Pacific Biochar Market Estimates And Forecasts, By Application, 2018 - 2030 (Kilotons) (USD Million)
- 7.4.3 China
- 7.4.3.1 Key Country Dynamics
- 7.4.3.2 China Biochar Market Estimates And Forecasts, By Technology, 2018 - 2030 (Kilotons) (USD Million)
- 7.4.3.3 China Biochar Market Estimates And Forecasts, By Application, 2018 - 2030 (Kilotons) (USD Million)
- 7.4.4 India
- 7.4.4.1 Key Country Dynamics
- 7.4.4.2 India Biochar Market Estimates And Forecasts, By Technology, 2018 - 2030 (Kilotons) (USD Million)
- 7.4.4.3 India Biochar Market Estimates And Forecasts, By Application, 2018 - 2030 (Kilotons) (USD Million)
- 7.4.5 Japan
- 7.4.5.1 Key Country Dynamics
- 7.4.5.2 Japan Biochar Market Estimates And Forecasts, By Technology, 2018 - 2030 (Kilotons) (USD Million)
- 7.4.5.3 Japan Biochar Market Estimates And Forecasts, By Application, 2018 - 2030 (Kilotons) (USD Million)
- 7.4.6 Malaysia
- 7.4.6.1 Key Country Dynamics
- 7.4.6.2 Malaysia Biochar Market Estimates And Forecasts, By Technology, 2018 - 2030 (Kilotons) (USD Million)
- 7.4.6.3 Malaysia Biochar Market Estimates And Forecasts, By Application, 2018 - 2030 (Kilotons) (USD Million)
- 7.4.7 Australia
- 7.4.7.1 Key Country Dynamics
- 7.4.7.2 Australia Biochar Market Estimates And Forecasts, By Technology, 2018 - 2030 (Kilotons) (USD Million)
- 7.4.7.3 Australia Biochar Market Estimates And Forecasts, By Application, 2018 - 2030 (Kilotons) (USD Million)
- 7.5 Central & South America
- 7.5.1 Central & South America Biochar Market Estimates And Forecasts, By Technology, 2018 - 2030 (Kilotons) (USD Million)
- 7.5.2 Central & South America Biochar Market Estimates And Forecasts, By Application, 2018 - 2030 (Kilotons) (USD Million)
- 7.6 Middle East & Africa
- 7.6.1 Middle East & Africa Biochar Market Estimates And Forecasts, By Technology, 2018 - 2030 (Kilotons) (USD Million)
- 7.6.2 Middle East & Africa Biochar Market Estimates And Forecasts, By Application, 2018 - 2030 (Kilotons) (USD Million)
Chapter 8 Competitive Landscape
- 8.1 Recent Development & Impact Analysis, By Key Market Participants
- 8.2 Company Categorization
- 8.3 Company Market Positioning Analysis, 2023
- 8.4 Company Heat Map Analysis
- 8.5 Strategy Mapping
- 8.6. Company Listing (Business Overview, Financial Performance, Product Benchmarking)
- 8.6.1 Biochar Products, Inc.
- 8.6.2 Biochar Supreme, LLC
- 8.6.3 ArSta Eco
- 8.6.4 Carbon Gold Ltd
- 8.6.5 Airex Energy Inc.
- 8.6.6 Pacific Biochar Benefit Corporation
- 8.6.7 Biochar Ireland
- 8.6.8 Swiss Biochar GmbH
- 8.6.9 Sonnenerde GmbH
- 8.6.10 Pyro power
- 8.6.11 Stiesdal
- 8.6.12 Novocarbo

