|
|
市場調査レポート
商品コード
1139493
スマートファクトリー市場 - 成長、将来展望、競合分析、2022年~2030年Smart Factory Market - Growth, Future Prospects and Competitive Analysis, 2022 - 2030 |
||||||
|
|
|||||||


| スマートファクトリー市場 - 成長、将来展望、競合分析、2022年~2030年 |
|
出版日: 2022年08月12日
発行: Acute Market Reports
ページ情報: 英文 119 Pages
納期: 即日から翌営業日
|
- 全表示
- 概要
- 図表
- 目次
世界のスマートファクトリーの市場規模は、2022年~2030年の予測期間において、9.5%のCAGRで拡大すると予測されています。市場の成長を牽引しているのは、製造施設全体のデジタル化の進展です。市場力学が変化し、カスタマイズされた製品への需要が高まっています。
当レポートでは、世界のスマートファクトリー市場について調査し、市場の概要とともに、コンポーネント・広告別、ソリューション別、用途別、地域別の動向、および市場に参入する企業のプロファイルなどを提供しています。
目次
第1章 序文
第2章 エグゼクティブサマリー
第3章 スマートファクトリー市場:ビジネスの展望と市場力学
- イントロダクション
- 世界のスマートファクトリー市場価値、2020年~2030年、(100万米ドル)
- 市場力学
- 市場促進要因
- 市場抑制要因
- 主な課題
- 主な機会
- 促進要因と抑制要因の影響分析
- シーソー分析
- ポーターのファイブフォースモデル
- PESTEL分析
第4章 スマートファクトリー市場:コンポーネント・広告別、2020年~2030年、(100万米ドル)
- 市場概要
- 成長と収益分析:2021年対2030年
- 市場セグメンテーション
- 産業用ロボット
- マシンビジョン
- 産業用IoT
- 産業用付加製造
第5章 スマートファクトリー市場:ソリューション別、2020年~2030年、(100万米ドル)
- 市場概要
- 成長と収益分析:2021年対2030年
- 市場セグメンテーション
- 製造実行システム(MES)
- プログラマブルロジックコントロール(PLC)
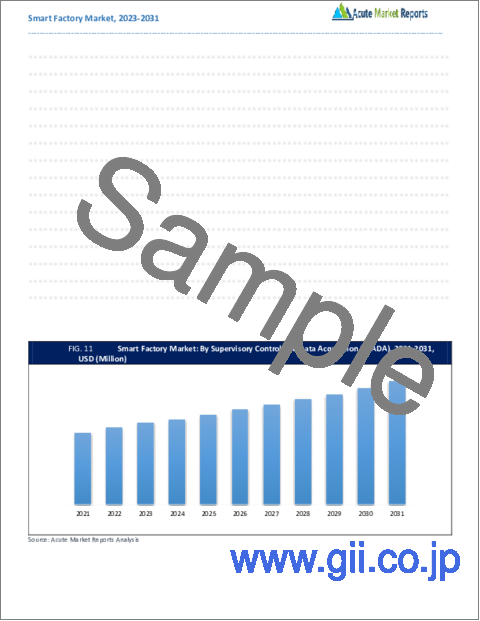
- 監視制御・データ収集(SCADA)
- エンタープライズリソースプランニング(ERP)
- 分散制御システム(DCS)
- ヒューマン・マシン・インターフェース(HMI)
- プラントアセットマネジメント(PAM)
第6章 スマートファクトリー市場:用途別、2020年~2030年、(100万米ドル)
- 市場概要
- 成長と収益分析:2021年対2030年
- 市場セグメンテーション
- 自動車
- 航空宇宙・防衛
- 食品・飲料
- 電子・電気
- 化学
- 医薬品
- エネルギー・ユーティリティ
- 鉱業
- その他
第7章 北米のスマートファクトリー市場、2020年~2030年、(100万米ドル)
第8章 英国およびEUのスマートファクトリー市場、2020年~2030年、(100万米ドル)
第9章 アジア太平洋のスマートファクトリー市場、2020年~2030年、(100万米ドル)
第10章 ラテンアメリカのスマートファクトリー市場、2020年~2030年、(100万米ドル)
第11章 中東・アフリカのスマートファクトリー市場、2020年~2030年、(100万米ドル)
第12章 企業プロファイル
- ABB Ltd.
- Emerson Electric
- FANUC
- General Electric
- Honeywell International Inc.
- Mitsubishi Electric
- Robert Bosch
- Rockwell Automation
- Schneider Electric
- Siemens AG
- Yokogawa Electric
List of Tables
- TABLE 1 Global Smart Factory Market By Componenteting & Advertising, 2020-2030, USD (Million)
- TABLE 2 Global Smart Factory Market By Solution, 2020-2030, USD (Million)
- TABLE 3 Global Smart Factory Market By Application, 2020-2030, USD (Million)
- TABLE 4 North America Smart Factory Market By Componenteting & Advertising, 2020-2030, USD (Million)
- TABLE 5 North America Smart Factory Market By Solution, 2020-2030, USD (Million)
- TABLE 6 North America Smart Factory Market By Application, 2020-2030, USD (Million)
- TABLE 7 UK and European Union Smart Factory Market By Componenteting & Advertising, 2020-2030, USD (Million)
- TABLE 8 UK and European Union Smart Factory Market By Solution, 2020-2030, USD (Million)
- TABLE 9 UK and European Union Smart Factory Market By Application, 2020-2030, USD (Million)
- TABLE 10 Asia Pacific Smart Factory Market By Componenteting & Advertising, 2020-2030, USD (Million)
- TABLE 11 Asia Pacific Smart Factory Market By Solution, 2020-2030, USD (Million)
- TABLE 12 Asia Pacific Smart Factory Market By Application, 2020-2030, USD (Million)
- TABLE 13 Latin America Smart Factory Market By Componenteting & Advertising, 2020-2030, USD (Million)
- TABLE 14 Latin America Smart Factory Market By Solution, 2020-2030, USD (Million)
- TABLE 15 Latin America Smart Factory Market By Application, 2020-2030, USD (Million)
- TABLE 16 Middle East and Africa Smart Factory Market By Componenteting & Advertising, 2020-2030, USD (Million)
- TABLE 17 Middle East and Africa Smart Factory Market By Solution, 2020-2030, USD (Million)
- TABLE 18 Middle East and Africa Smart Factory Market By Application, 2020-2030, USD (Million)
List of Figures
- FIG. 1 Global Smart Factory Market: Market Coverage
- FIG. 2 Research Methodology and Data Sources
- FIG. 3 Market Size Estimation - Top Down & Bottom-Up Approach
- FIG. 4 Global Smart Factory Market: Quality Assurance
- FIG. 5 Global Smart Factory Market, By Componenteting & Advertising, 2021
- FIG. 6 Global Smart Factory Market, By Solution, 2021
- FIG. 7 Global Smart Factory Market, By Application, 2021
- FIG. 8 Global Smart Factory Market, By Geography, 2021
- FIG. 9 Global Smart Factory Market, By Componenteting & Advertising, 2021 Vs 2030, %
- FIG. 10 Global Smart Factory Market, By Solution, 2021 Vs 2030, %
- FIG. 11 Global Smart Factory Market, By Application, 2021 Vs 2030, %
- FIG. 12 U.S. Smart Factory Market (US$ Million), 2020 - 2030
- FIG. 13 Canada Smart Factory Market (US$ Million), 2020 - 2030
- FIG. 14 Rest of North America Smart Factory Market (US$ Million), 2020 - 2030
- FIG. 15 UK Smart Factory Market (US$ Million), 2020 - 2030
- FIG. 16 Germany Smart Factory Market (US$ Million), 2020 - 2030
- FIG. 17 Spain Smart Factory Market (US$ Million), 2020 - 2030
- FIG. 18 Italy Smart Factory Market (US$ Million), 2020 - 2030
- FIG. 19 France Smart Factory Market (US$ Million), 2020 - 2030
- FIG. 20 Rest of Europe Smart Factory Market (US$ Million), 2020 - 2030
- FIG. 21 China Smart Factory Market (US$ Million), 2020 - 2030
- FIG. 22 Japan Smart Factory Market (US$ Million), 2020 - 2030
- FIG. 23 India Smart Factory Market (US$ Million), 2020 - 2030
- FIG. 24 Australia Smart Factory Market (US$ Million), 2020 - 2030
- FIG. 25 South Korea Smart Factory Market (US$ Million), 2020 - 2030
- FIG. 26 Rest of Asia Smart Factory Market (US$ Million), 2020 - 2030
- FIG. 27 Brazil Smart Factory Market (US$ Million), 2020 - 2030
- FIG. 28 Mexico Smart Factory Market (US$ Million), 2020 - 2030
- FIG. 29 Rest of Latin America Smart Factory Market (US$ Million), 2020 - 2030
- FIG. 30 GCC Smart Factory Market (US$ Million), 2020 - 2030
- FIG. 31 Africa Smart Factory Market (US$ Million), 2020 - 2030
- FIG. 32 Rest of Middle East and Africa Smart Factory Market (US$ Million), 2020 - 2030
"Increasing Digitalization across the Manufacturing Facilities Is Driving the Smart Factory Market"
Globally, the smart factory market is expected to grow with a CAGR of 9.5% during the forecast period from 2022 to 2030. The growth of the market is driven by the increasing digitalization across manufacturing facilities. The overall manufacturing industry is going through a phase of digital disruption over the past decade due to the increasing competition among and advancement in globalization. The market dynamics are changing and the demand for customized products are increasing. As a result, the product lifecycle is getting shorter due to greater variety of variants. This has led to shorter planning horizon and falling batch sizes. To address these challenges, the manufacturers are shifting toward advance technology solutions such as automation, robotics, additive manufacturing and Internet of Things (IoT).
These solution assist manufacturers create an intelligent and self controlled production network, which can be optimized with increased flexibility to enhance the operational performance. However, there are still some factors that are holding back the growth of the smart factories market. The data safety and security issues associated with the use of digital production and solutions are the primary factors organizations are hesitant to integrate the technology solutions. Moreover, the capital cost associated with the implementation of new technology and lack skilled professionals is also hindering the adoption among the market.
"Aerospace & Defense Is Estimated To Grow Significantly During The Forecast Period"
The smart factory market is segmented based on the application into the automotive, aerospace & defense, food & beverages, electronics & electrical, pharmaceuticals, chemical, mining, and energy & utility sector. The aerospace & defense sector is estimated to grow at a CAGR of more than 10.2% during the forecast period. The growth of the market is driven by the rising need among organizations to reduce the cost of operation and gain business agility. Furthermore, the increasing digitalization across the industry is also augmenting the growth of the market. On the other hand, food & beverages industry is also estimated to gain significant market share due to the rapid automation among the industry vertical.
"Europe Is Leading the Smart Factory Market"
Europe dominated the smart factory market with over 37% share in revenue in 2020. The market is driven by the increasing implementation of the industry 4.0 revolution in the region. The governments of European countries are investing significantly in order to escalate digitalization among the market players. Subsequently, Europe would continue leading the market through the forecast period. Further, Asia Pacific is estimated to demonstrate the highest CAGR during the forecast period.
The prominent players in the Smart Factory market are ABB Ltd., Emerson Electric, FANUC, General Electric, Honeywell International, Mitsubishi Electric, Robert Bosch, Rockwell Automation, Schneider Electric, Siemens, and Yokogawa Electric.
Historical & Forecast Period
This study report represents analysis of each segment from 2020 to 2030 considering 2021 as the base year. Compounded Annual Growth Rate (CAGR) for each of the respective segments estimated for the forecast period of 2022 to 2030.
The current report comprises of quantitative market estimations for each micro market for every geographical region and qualitative market analysis such as micro and macro environment analysis, market trends, competitive intelligence, segment analysis, porters five force model, top winning strategies, top investment markets, emerging trends and technological analysis, case studies, strategic conclusions and recommendations and other key market insights.
Research Methodology
The complete research study was conducted in three phases, namely: secondary research, primary research, and expert panel review. key data point that enables the estimation of Smart Factory market are as follows:
Research and development budgets of manufacturers and government spending
Revenues of key companies in the market segment
Number of end users and consumption volume, price and value.
Geographical revenues generate by countries considered in the report
Micro and macro environment factors that are currently influencing the Smart Factory market and their expected impact during the forecast period.
Market forecast was performed through proprietary software that analyzes various qualitative and quantitative factors. Growth rate and CAGR were estimated through intensive secondary and primary research. Data triangulation across various data points provides accuracy across various analyzed market segments in the report. Application of both top down and bottom-up approach for validation of market estimation assures logical, methodical and mathematical consistency of the quantitative data.
Market Segmentation
Componenteting & Advertising
Industrial Robots
Machine Vision
Industrial IoT
Industrial Additive Manufacturing
Solution
Manufacturing Execution System (MES)
Programmable Logic Control (PLC)
Supervisory Control and Data Acquisition (SCADA)
Enterprise Resource Planning (ERP)
Distributed Control System (DCS)
Human-Machine Interface (HMI)
Plant Asset Management (PAM)
Application
Automotive
Aerospace & Defense
Food & Beverages
Electronics & Electrical
Chemical
Pharmaceuticals
Energy & Utility
Mining
Others
Region Segment (2020-2030; US$ Million)
North America
U.S.
Canada
Rest of North America
UK and European Union
UK
Germany
Spain
Italy
France
Rest of Europe
Asia Pacific
China
Japan
India
Australia
South Korea
Rest of Asia Pacific
Latin America
Brazil
Mexico
Rest of Latin America
Middle East and Africa
GCC
Africa
Rest of Middle East and Africa
Global Impact of COVID-19 Segment (2020-2021; US$ Million )
Pre COVID-19 situation
Post COVID-19 situation
Key questions answered in this report:
What are the key micro and macro environmental factors that are impacting the growth of Smart Factory market?
What are the key investment pockets with respect to product segments and geographies currently and during the forecast period?
Estimated forecast and market projections up to 2030.
Which segment accounts for the fastest CAGR during the forecast period?
Which market segment holds a larger market share and why?
Are low and middle-income economies investing in the Smart Factory market?
Which is the largest regional market for Smart Factory market?
What are the market trends and dynamics in emerging markets such as Asia Pacific, Latin America, and Middle East & Africa?
Which are the key trends driving Smart Factory market growth?
Who are the key competitors and what are their key strategies to enhance their market presence in the Smart Factory market worldwide?
Table of Contents
1. Preface
- 1.1. Report Description
- 1.1.1. Purpose of the Report
- 1.1.2. Target Audience
- 1.1.3. Key Offerings
- 1.2. Market Segmentation
- 1.3. Research Methodology
- 1.3.1. Phase I - Secondary Research
- 1.3.2. Phase II - Primary Research
- 1.3.3. Phase III - Expert Panel Review
- 1.3.4. Assumptions
- 1.3.5. Approach Adopted
2. Executive Summary
- 2.1. Market Snapshot: Global Smart Factory Market
- 2.2. Global Smart Factory Market, By Componenteting & Advertising, 2021 (US$ Million)
- 2.3. Global Smart Factory Market, By Solution, 2021 (US$ Million)
- 2.4. Global Smart Factory Market, By Application, 2021 (US$ Million)
- 2.5. Global Smart Factory Market, By Geography, 2021 (US$ Million)
- 2.6. Impact of Covid 19
- 2.7. Attractive Investment Proposition by Geography, 2021
- 2.8. Competitive Analysis
- 2.8.1. Market Positioning of Key Smart Factory Market Vendors
- 2.8.2. Strategies Adopted by Smart Factory Market Vendors
- 2.8.3. Key Industry Strategies
3. Smart Factory Market: Business Outlook & Market Dynamics
- 3.1. Introduction
- 3.2. Global Smart Factory Market Value, 2020 - 2030, (US$ Million)
- 3.3. Market Dynamics
- 3.3.1. Market Drivers
- 3.3.2. Market Restraints
- 3.3.3. Key Challenges
- 3.3.4. Key Opportunities
- 3.4. Impact Analysis of Drivers and Restraints
- 3.5. See-Saw Analysis
- 3.6. Porter's Five Force Model
- 3.6.1. Supplier Power
- 3.6.2. Buyer Power
- 3.6.3. Threat Of Substitutes
- 3.6.4. Threat Of New Entrants
- 3.6.5. Competitive Rivalry
- 3.7. PESTEL Analysis
- 3.7.1. Political Landscape
- 3.7.2. Economic Landscape
- 3.7.3. Technology Landscape
- 3.7.4. Legal Landscape
- 3.7.5. Social Landscape
4. Smart Factory Market: By Componenteting & Advertising, 2020-2030, USD (Million)
- 4.1. Market Overview
- 4.2. Growth & Revenue Analysis: 2021 Versus 2030
- 4.3. Market Segmentation
- 4.3.1. Industrial Robots
- 4.3.2. Machine Vision
- 4.3.3. Industrial IoT
- 4.3.4. Industrial Additive Manufacturing
5. Smart Factory Market: By Solution, 2020-2030, USD (Million)
- 5.1. Market Overview
- 5.2. Growth & Revenue Analysis: 2021 Versus 2030
- 5.3. Market Segmentation
- 5.3.1. Manufacturing Execution System (MES)
- 5.3.2. Programmable Logic Control (PLC)
- 5.3.3. Supervisory Control and Data Acquisition (SCADA)
- 5.3.4. Enterprise Resource Planning (ERP)
- 5.3.5. Distributed Control System (DCS)
- 5.3.6. Human-Machine Interface (HMI)
- 5.3.7. Plant Asset Management (PAM)
6. Smart Factory Market: By Application, 2020-2030, USD (Million)
- 6.1. Market Overview
- 6.2. Growth & Revenue Analysis: 2021 Versus 2030
- 6.3. Market Segmentation
- 6.3.1. Automotive
- 6.3.2. Aerospace & Defense
- 6.3.3. Food & Beverages
- 6.3.4. Electronics & Electrical
- 6.3.5. Chemical
- 6.3.6. Pharmaceuticals
- 6.3.7. Energy & Utility
- 6.3.8. Mining
- 6.3.9. Others
7. North America Smart Factory Market, 2020-2030, USD (Million)
- 7.1. Market Overview
- 7.2. Smart Factory Market: By Componenteting & Advertising, 2020-2030, USD (Million)
- 7.3. Smart Factory Market: By Solution, 2020-2030, USD (Million)
- 7.4. Smart Factory Market: By Application, 2020-2030, USD (Million)
- 7.5.Smart Factory Market: By Region, 2020-2030, USD (Million)
- 7.5.1.North America
- 7.5.1.1. U.S.
- 7.5.1.2. Canada
- 7.5.1.3. Rest of North America
- 7.5.1.North America
8. UK and European Union Smart Factory Market, 2020-2030, USD (Million)
- 8.1. Market Overview
- 8.2. Smart Factory Market: By Componenteting & Advertising, 2020-2030, USD (Million)
- 8.3. Smart Factory Market: By Solution, 2020-2030, USD (Million)
- 8.4. Smart Factory Market: By Application, 2020-2030, USD (Million)
- 8.5.Smart Factory Market: By Region, 2020-2030, USD (Million)
- 8.5.1.UK and European Union
- 8.5.1.1. UK
- 8.5.1.2. Germany
- 8.5.1.3. Spain
- 8.5.1.4. Italy
- 8.5.1.5. France
- 8.5.1.6. Rest of Europe
- 8.5.1.UK and European Union
9. Asia Pacific Smart Factory Market, 2020-2030, USD (Million)
- 9.1. Market Overview
- 9.2. Smart Factory Market: By Componenteting & Advertising, 2020-2030, USD (Million)
- 9.3. Smart Factory Market: By Solution, 2020-2030, USD (Million)
- 9.4. Smart Factory Market: By Application, 2020-2030, USD (Million)
- 9.5.Smart Factory Market: By Region, 2020-2030, USD (Million)
- 9.5.1.Asia Pacific
- 9.5.1.1. China
- 9.5.1.2. Japan
- 9.5.1.3. India
- 9.5.1.4. Australia
- 9.5.1.5. South Korea
- 9.5.1.6. Rest of Asia Pacific
- 9.5.1.Asia Pacific
10. Latin America Smart Factory Market, 2020-2030, USD (Million)
- 10.1. Market Overview
- 10.2. Smart Factory Market: By Componenteting & Advertising, 2020-2030, USD (Million)
- 10.3. Smart Factory Market: By Solution, 2020-2030, USD (Million)
- 10.4. Smart Factory Market: By Application, 2020-2030, USD (Million)
- 10.5.Smart Factory Market: By Region, 2020-2030, USD (Million)
- 10.5.1.Latin America
- 10.5.1.1. Brazil
- 10.5.1.2. Mexico
- 10.5.1.3. Rest of Latin America
- 10.5.1.Latin America
11. Middle East and Africa Smart Factory Market, 2020-2030, USD (Million)
- 11.1. Market Overview
- 11.2. Smart Factory Market: By Componenteting & Advertising, 2020-2030, USD (Million)
- 11.3. Smart Factory Market: By Solution, 2020-2030, USD (Million)
- 11.4. Smart Factory Market: By Application, 2020-2030, USD (Million)
- 11.5.Smart Factory Market: By Region, 2020-2030, USD (Million)
- 11.5.1.Middle East and Africa
- 11.5.1.1. GCC
- 11.5.1.2. Africa
- 11.5.1.3. Rest of Middle East and Africa
- 11.5.1.Middle East and Africa
12. Company Profile
- 12.1. ABB Ltd.
- 12.1.1. Company Overview
- 12.1.2. Financial Performance
- 12.1.3. Product Portfolio
- 12.1.4. Strategic Initiatives
- 12.2. Emerson Electric
- 12.2.1. Company Overview
- 12.2.2. Financial Performance
- 12.2.3. Product Portfolio
- 12.2.4. Strategic Initiatives
- 12.3. FANUC
- 12.3.1. Company Overview
- 12.3.2. Financial Performance
- 12.3.3. Product Portfolio
- 12.3.4. Strategic Initiatives
- 12.4. General Electric
- 12.4.1. Company Overview
- 12.4.2. Financial Performance
- 12.4.3. Product Portfolio
- 12.4.4. Strategic Initiatives
- 12.5. Honeywell International Inc.
- 12.5.1. Company Overview
- 12.5.2. Financial Performance
- 12.5.3. Product Portfolio
- 12.5.4. Strategic Initiatives
- 12.6. Mitsubishi Electric
- 12.6.1. Company Overview
- 12.6.2. Financial Performance
- 12.6.3. Product Portfolio
- 12.6.4. Strategic Initiatives
- 12.7. Robert Bosch
- 12.7.1. Company Overview
- 12.7.2. Financial Performance
- 12.7.3. Product Portfolio
- 12.7.4. Strategic Initiatives
- 12.8. Rockwell Automation
- 12.8.1. Company Overview
- 12.8.2. Financial Performance
- 12.8.3. Product Portfolio
- 12.8.4. Strategic Initiatives
- 12.9. Schneider Electric
- 12.9.1. Company Overview
- 12.9.2. Financial Performance
- 12.9.3. Product Portfolio
- 12.9.4. Strategic Initiatives
- 12.10. Siemens AG
- 12.10.1. Company Overview
- 12.10.2. Financial Performance
- 12.10.3. Product Portfolio
- 12.10.4. Strategic Initiatives
- 12.11. Yokogawa Electric
- 12.11.1. Company Overview
- 12.11.2. Financial Performance
- 12.11.3. Product Portfolio
- 12.11.4. Strategic Initiatives