|
|
市場調査レポート
商品コード
1633720
スマートファクトリーの市場規模、シェア、動向分析レポート:フィールドデバイス別、技術別、用途別、地域別、セグメント予測、2025年~2030年Smart Factory Market Size, Share & Trends Analysis Report By Field Devices, By Technology, By Application, By Region, And Segment Forecasts, 2025 - 2030 |
||||||

|
|||||||
カスタマイズ可能
|
|||||||


| スマートファクトリーの市場規模、シェア、動向分析レポート:フィールドデバイス別、技術別、用途別、地域別、セグメント予測、2025年~2030年 |
|
出版日: 2024年12月02日
発行: Grand View Research
ページ情報: 英文 150 Pages
納期: 2~10営業日
|

全表示
- 概要
- 図表
- 目次
スマートファクトリーの市場の成長と動向:
Grand View Research, Inc.の最新レポートによると、スマートファクトリーの世界市場規模は2030年までに2,726億4,000万米ドルに達すると予測されています。
同市場は2025年から2030年にかけてCAGR 10.0%で成長すると予測されています。スマートファクトリー市場は近年著しい成長を遂げているが、その主な要因はいくつかあります。これらには、モノのインターネット(IoT)、AI、機械学習(ML)、産業オートメーションなどのデジタル技術を統合することを特徴とするインダストリー4.0のコンセプトの採用が増加していることが含まれます。これらの技術は業務効率を高め、リアルタイムのデータ分析を可能にし、俊敏で応答性の高い製造プロセスを育成します。
さらに、コスト最適化と資源効率化の必要性から、ダウンタイムの削減、無駄の最小化、資源配分の改善を約束するスマート・ファクトリー・ソリューションへの投資が企業に促されています。さらに、持続可能性と環境への関心の高まりにより、製造業者はエネルギー消費の監視と最適化を行い、カーボンフットプリントを削減するためにスマートファクトリーの導入に傾倒しています。
さらに、コネクテッドデバイスとIoTやクラウドコンピューティングの統合などの技術的進歩が開発要因として作用しています。自動マテリアルハンドリング、電子的・機械的組立、製品テストはすべて、こうした最先端技術によって容易になります。力センサーはまた、研磨、バフ研磨、バリ取りの際に一定の力を維持し、統計的工程管理(SPC)システムのデータを収集し、部品の適切な挿入を保証するためにスマートファクトリーで使用されています。産業用モノのインターネット(IIoT)の導入や、複雑な自動車部品や医療部品の生産におけるスマートファクトリーソリューションの利用拡大など、その他の側面も、予測期間中にスマートファクトリー分野を推進すると予想されます。
スマートファクトリー市場で事業を展開するいくつかの企業は、より多くの顧客基盤に対応し、業界における足場を強化するために、合併、買収、パートナーシップ、製品提供を強化するための技術革新などの戦略を採用しています。例えば、ABBロボティクスは2022年10月、史上最小の産業用ロボットIRB 1010を発表しました。このコンパクトなシステムは、電子機器メーカーがスマートウォッチ、センサー、イヤホン、ヘルシートラッカーなどのデバイスの生産性を向上させるために開発されました。
ABB Roboticsのこの産業用ロボットは、高い可搬質量と精度を備えています。このコンパクトなシステムは、電子機器メーカーが自動化によってイヤホン、ヘルシートラッカー、スマートウォッチ、センサーなどのデバイスの生産を強化するのを支援するために作られました。このような進歩は、今後数年間のスマートファクトリー産業の成長を促進するものと思われます。
スマートファクトリーの市場のレポートハイライト
- 技術別では、分散制御システム(DCS)分野が2024年に最大の市場シェアを占めました。これは、新興経済諸国における飲食品、鉱業・金属、冶金、エレクトロニクスなどの産業部門からの投資が増加しているためです。
- フィールドデバイスに基づくと、センサセグメントは、低消費電力と統合されたコンピューティング能力による自給自足の増加により、2030年までに最も高いCAGRで拡大する見込みです。
- アプリケーション別では、自動車分野が2024年に最大の収益シェアを占め、予測期間中も同じ傾向が続くと予想されます。自動車メーカーは、生産の最適化と運用コストの削減のため、スマート・マニュファクチャリングと自動化の開発に多額の投資を行っています。
- アジア太平洋地域市場は、2024年に最大の収益シェアを占めました。これは、発展途上国が国際的な製造基準や動向に遅れないよう、スマート技術に多額の投資を行っているためです。
目次
第1章 調査手法と範囲
第2章 エグゼクティブサマリー
第3章 スマートファクトリーの市場- 業界展望
- 市場系統の見通し
- 業界バリューチェーン分析
- 市場力学
- 業界分析ツール
- スマートファクトリーの市場:新興技術
第4章 スマートファクトリーの市場:技術推定・動向分析
- セグメントダッシュボード
- スマートファクトリーの市場:技術変動分析 100万米ドル、2024年および2030年
- 分散制御システム(DCS)
- エンタープライズリソースプランニング(ERP)
- ヒューマンマシンインターフェース(HMI)
- 製造実行システム(MES)
- 製品ライフサイクル管理(PLM)
- プログラムロジックコントローラ(PLC)
- 監視制御およびデータ収集(SCADA)
- その他
第5章 スマートファクトリーの市場:フィールドデバイスの推定・動向分析
- セグメントダッシュボード
- スマートファクトリーの市場:フィールドデバイスの変動分析 100万米ドル、2024年および2030年
- センサー
- 産業用ロボット
- マシンビジョンシステム
- その他
第6章 スマートファクトリーの市場:用途の推定・動向分析
- セグメントダッシュボード
- スマートファクトリーの市場:用途の変動分析、100万米ドル、2024年および2030年
- 航空宇宙および防衛
- 自動車
- エネルギーと電力
- 飲食品
- ヘルスケア
- 半導体・エレクトロニクス
- 石油・ガス
- その他
第7章 地域推定・動向分析
- 地域別スマートファクトリーの市場、2024年および2030年
- 北米
- 北米スマートファクトリーの市場の推定と予測、2018年-2030年
- 米国
- カナダ
- メキシコ
- 欧州
- 欧州のスマートファクトリーの市場推計・予測、2018年-2030年
- 英国
- ドイツ
- フランス
- イタリア
- フランス
- アジア太平洋
- アジア太平洋地域のスマートファクトリーの市場推計・予測、2018年-2030年
- 中国
- 日本
- インド
- 韓国
- オーストラリア
- ラテンアメリカ
- ラテンアメリカのスマートファクトリーの市場推計・予測、2018年-2030年
- ブラジル
- 中東およびアフリカ
- 中東およびアフリカのスマートファクトリーの市場推計・予測、2018年-2030年
- アラブ首長国連邦
- サウジアラビア
- 南アフリカ
第8章 スマートファクトリーの市場-競合情勢
- 企業分類
- 企業の市場ポジショニング
- 企業ヒートマップ分析
- 企業プロファイル/上場企業
- Emerson Electric Co.
- KUKA AG
- Siemens AG
- GE Vernova(General Electric Company)
- Rockwell Automation, Inc.
- Schiender Electric
- Honeywell International, Inc.
- ABB Ltd.
- Mitsubishi Electric Corporation
- Fanuc Corporation
- Cisco System Inc.
- Dassault Systemes SE
List of Tables
- Table 1 Global smart factory market size estimates & forecasts 2018 - 2030 (USD Billion)
- Table 2 Global smart factory market, by region 2018 - 2030 (USD Billion)
- Table 3 Global smart factory market, by technology 2018 - 2030 (USD Billion)
- Table 4 Global smart factory market, by field devices 2018 - 2030 (USD Billion)
- Table 5 Global smart factory market, by application 2018 - 2030 (USD Billion)
- Table 6 Distributed Control Systems (DCS) smart factory market, by region 2018 - 2030 (USD Billion)
- Table 7 Enterprise Resource Planning (ERP) smart factory market, by region 2018 - 2030 (USD Billion)
- Table 8 Human Machine Interface (HMI) smart factory market, by region 2018 - 2030 (USD Billion)
- Table 9 Manufacturing Execution System (MES) smart factory market, by region 2018 - 2030 (USD Billion)
- Table 10 Product Life Cycle Management (PLM) smart factory market, by region 2018 - 2030 (USD Billion)
- Table 11 Program Logic Controller (PLC) smart factory market, by region 2018 - 2030 (USD Billion)
- Table 12 Supervisory Controller and Data Acquisition (SCADA) smart factory market, by region 2018 - 2030 (USD Billion)
- Table 13 Others smart factory market, by region 2018 - 2030 (USD Billion)
- Table 14 Sensors smart factory market, by region 2018 - 2030 (USD Billion)
- Table 15 Industrial robotics smart factory market, by region 2018 - 2030 (USD Billion)
- Table 16 Machine vision systems smart factory market, by region 2018 - 2030 (USD Billion)
- Table 17 Others smart factory market, by region 2018 - 2030 (USD Billion)
- Table 18 Aerospace & defense smart factory market, by region 2018 - 2030 (USD Billion)
- Table 19 Automotive smart factory market, by region 2018 - 2030 (USD Billion)
- Table 20 Energy & power smart factory market, by region 2018 - 2030 (USD Billion)
- Table 21 Food & beverages smart factory market, by region 2018 - 2030 (USD Billion)
- Table 22 Healthcare smart factory market, by region 2018 - 2030 (USD Billion)
- Table 23 Semiconductor & electronics smart factory market, by region 2018 - 2030 (USD Billion)
- Table 24 Oil & gas smart factory market, by region 2018 - 2030 (USD Billion)
- Table 25 Others smart factory market, by region 2018 - 2030 (USD Billion)
- Table 26 North America smart factory market, by technology 2018 - 2030 (USD Billion)
- Table 27 North America smart factory market, by field devices 2018 - 2030 (USD Billion)
- Table 28 North America smart factory market, by application 2018 - 2030 (USD Billion)
- Table 29 U.S. smart factory market, by technology 2018 - 2030 (USD Billion)
- Table 30 U.S. smart factory market, by field devices 2018 - 2030 (USD Billion)
- Table 31 U.S. smart factory market, by application 2018 - 2030 (USD Billion)
- Table 32 Canada smart factory market, by technology 2018 - 2030 (USD Billion)
- Table 33 Canada smart factory market, by field devices 2018 - 2030 (USD Billion)
- Table 34 Canada smart factory market, by application 2018 - 2030 (USD Billion)
- Table 35 Mexico smart factory market, by technology 2018 - 2030 (USD Billion)
- Table 36 Mexico smart factory market, by field devices 2018 - 2030 (USD Billion)
- Table 37 Mexico smart factory market, by application 2018 - 2030 (USD Billion)
- Table 38 Europe smart factory market, by technology 2018 - 2030 (USD Billion)
- Table 39 Europe smart factory market, by field devices 2018 - 2030 (USD Billion)
- Table 40 Europe smart factory market, by application 2018 - 2030 (USD Billion)
- Table 41 UK smart factory market, by technology 2018 - 2030 (USD Billion)
- Table 42 UK smart factory market, by field devices 2018 - 2030 (USD Billion)
- Table 43 UK smart factory market, by application 2018 - 2030 (USD Billion)
- Table 44 Germany smart factory market, by technology 2018 - 2030 (USD Billion)
- Table 45 Germany smart factory market, by field devices 2018 - 2030 (USD Billion)
- Table 46 Germany smart factory market, by application 2018 - 2030 (USD Billion)
- Table 47 France smart factory market, by technology 2018 - 2030 (USD Billion)
- Table 48 France smart factory market, by field devices 2018 - 2030 (USD Billion)
- Table 49 France smart factory market, by application 2018 - 2030 (USD Billion)
- Table 50 Italy smart factory market, by technology 2018 - 2030 (USD Billion)
- Table 51 Italy smart factory market, by field devices 2018 - 2030 (USD Billion)
- Table 52 Italy smart factory market, by application 2018 - 2030 (USD Billion)
- Table 53 Spain smart factory market, by technology 2018 - 2030 (USD Billion)
- Table 54 Spain smart factory market, by field devices 2018 - 2030 (USD Billion)
- Table 55 Spain smart factory market, by application 2018 - 2030 (USD Billion)
- Table 56 Asia-Pacific smart factory market, by technology 2018 - 2030 (USD Billion)
- Table 57 Asia-Pacific smart factory market, by field devices 2018 - 2030 (USD Billion)
- Table 58 Asia-Pacific smart factory market, by application 2018 - 2030 (USD Billion)
- Table 59 China smart factory market, by technology 2018 - 2030 (USD Billion)
- Table 60 China smart factory market, by field devices 2018 - 2030 (USD Billion)
- Table 61 China smart factory market, by application 2018 - 2030 (USD Billion)
- Table 62 Japan smart factory market, by technology 2018 - 2030 (USD Billion)
- Table 63 Japan smart factory market, by field devices 2018 - 2030 (USD Billion)
- Table 64 Japan smart factory market, by application 2018 - 2030 (USD Billion)
- Table 65 India smart factory market, by technology 2018 - 2030 (USD Billion)
- Table 66 India smart factory market, by field devices 2018 - 2030 (USD Billion)
- Table 67 India smart factory market, by application 2018 - 2030 (USD Billion)
- Table 68 South Korea smart factory market, by technology 2018 - 2030 (USD Billion)
- Table 69 South Korea smart factory market, by field devices 2018 - 2030 (USD Billion)
- Table 70 South Korea smart factory market, by application 2018 - 2030 (USD Billion)
- Table 71 Latin America smart factory market, by technology 2018 - 2030 (USD Billion)
- Table 72 Latin America smart factory market, by field devices 2018 - 2030 (USD Billion)
- Table 73 Latin America smart factory market, by application 2018 - 2030 (USD Billion)
- Table 74 Brazil smart factory market, by technology 2018 - 2030 (USD Billion)
- Table 75 Brazil smart factory market, by field devices 2018 - 2030 (USD Billion)
- Table 76 Brazil smart factory market, by application 2018 - 2030 (USD Billion)
- Table 77 Middle East & Africa smart factory market, by technology 2018 - 2030 (USD Billion)
- Table 78 Middle East & Africa smart factory market, by field devices 2018 - 2030 (USD Billion)
- Table 79 Middle East & Africa smart factory market, by application 2018 - 2030 (USD Billion)
- Table 80 South Africa smart factory market, by technology 2018 - 2030 (USD Billion)
- Table 81 South Africa smart factory market, by field devices 2018 - 2030 (USD Billion)
- Table 82 South Africa smart factory market, by application 2018 - 2030 (USD Billion)
- Table 83 Saudi Arabia smart factory market, by technology 2018 - 2030 (USD Billion)
- Table 84 Saudi Arabia smart factory market, by field devices 2018 - 2030 (USD Billion)
- Table 85 Saudi Arabia smart factory market, by application 2018 - 2030 (USD Billion)
- Table 86 UAE smart factory market, by technology 2018 - 2030 (USD Billion)
- Table 87 UAE smart factory market, by field devices 2018 - 2030 (USD Billion)
- Table 88 UAE smart factory market, by application 2018 - 2030 (USD Billion)
List of Figures
- Fig. 1 Smart factory market segmentation
- Fig. 2 Information procurement
- Fig. 3 Data analysis models
- Fig. 4 Market formulation and validation
- Fig. 5 Data validating & publishing
- Fig. 6 Smart factory market snapshot
- Fig. 7 Smart factory market segment snapshot
- Fig. 8 Smart factory market competitive landscape snapshot
- Fig. 9 Market research process
- Fig. 10 Market driver relevance analysis (current & future impact)
- Fig. 11 Market restraint relevance analysis (current & future impact)
- Fig. 12 Smart factory market, by technology, key takeaways, 2018 - 2030, revenue (USD Billion)
- Fig. 13 Smart factory market, by technology: market share, 2022 & 2030
- Fig. 14 Distributed control systems (DCS) market estimates & forecasts, 2018 - 2030 (USD Billion)
- Fig. 15 Enterprise resource planning (ERP) market estimates & forecasts, 2018 - 2030 (USD Billion)
- Fig. 16 Human machine interface (HMI) market estimates & forecasts, 2018 - 2030 (USD Billion)
- Fig. 17 Manufacturing execution system (MES) market estimates & forecasts, 2018 - 2030 (USD Billion)
- Fig. 18 Product life cycle management (PLM)market estimates & forecasts, 2018 - 2030 (USD Billion)
- Fig. 19 Program logic controller (PLC) market estimates & forecasts, 2018 - 2030 (USD Billion)
- Fig. 20 Supervisory controller and data acquisition (SCADA) market estimates & forecasts, 2018 - 2030 (USD Billion)
- Fig. 21 Others market estimates & forecasts, 2018 - 2030 (USD Billion)
- Fig. 22 Smart factory market, by field devices, key takeaways, 2018 - 2030, revenue (USD Billion)
- Fig. 23 Smart factory market, by field devices: market share, 2022 & 2030
- Fig. 24 Sensors market estimates & forecasts, 2018 - 2030 (USD Billion)
- Fig. 25 Industrial robotics market estimates & forecasts, 2018 - 2030 (USD Billion)
- Fig. 26 Machine vision systems market estimates & forecasts, 2018 - 2030 (USD Billion)
- Fig. 27 Others market estimates & forecasts, 2018 - 2030 (USD Billion)
- Fig. 28 Smart factory market, by application, key takeaways, 2018 - 2030, revenue (USD Billion)
- Fig. 29 Smart factory market, by application: market share, 2022 & 2030
- Fig. 30 Aerospace & defense market estimates & forecasts, 2018 - 2030 (USD Billion)
- Fig. 31 Automotive market estimates & forecasts, 2018 - 2030 (USD Billion)
- Fig. 32 Energy & power market estimates & forecasts, 2018 - 2030 (USD Billion)
- Fig. 33 Food and beverages market estimates & forecasts, 2018 - 2030 (USD Billion)
- Fig. 34 Healthcare market estimates & forecasts, 2018 - 2030 (USD Billion)
- Fig. 35 Semiconductor & electronics market estimates & forecasts, 2018 - 2030 (USD Billion)
- Fig. 36 Oil & gas market estimates & forecasts, 2018 - 2030 (USD Billion)
- Fig. 37 Others market estimates & forecasts, 2018 - 2030 (USD Billion)
- Fig. 38 Regional marketplace: key takeaways
- Fig. 39 North America smart factory market estimates & forecast, 2018 - 2030 (USD Billion)
- Fig. 40 U.S. Smart factory market estimates & forecast, 2018 - 2030 (USD Billion)
- Fig. 41 Canada smart factory market estimates & forecast, 2018 - 2030 (USD Billion)
- Fig. 42 Mexico smart factory market estimates & forecast, 2018 - 2030 (USD Billion)
- Fig. 43 Europe smart factory market estimates & forecast, 2018 - 2030 (USD Billion)
- Fig. 44 Germany smart factory market estimates & forecast, 2018 - 2030 (USD Billion)
- Fig. 45 UK Smart factory market estimates & forecast, 2018 - 2030 (USD Billion)
- Fig. 46 France smart factory market estimates & forecast, 2018 - 2030 (USD Billion)
- Fig. 47 Italy smart factory market estimates & forecast, 2018 - 2030 (USD Billion)
- Fig. 48 Spain smart factory market estimates & forecast, 2018 - 2030 (USD Billion)
- Fig. 49 Asia pacific smart factory market estimates & forecast, 2018 - 2030 (USD Billion)
- Fig. 50 China smart factory market estimates & forecast, 2018 - 2030 (USD Billion)
- Fig. 51 Japan smart factory market estimates & forecast, 2018 - 2030 (USD Billion)
- Fig. 52 India smart factory market estimates & forecast, 2018 - 2030 (USD Billion)
- Fig. 53 South Korea smart factory market estimates & forecast, 2018 - 2030 (USD Billion)
- Fig. 54 Australia smart factory market estimates & forecast, 2018 - 2030 (USD Billion)
- Fig. 55 Latin America smart factory market estimates & forecast, 2018 - 2030 (USD Billion)
- Fig. 56 Brazil smart factory market estimates & forecast, 2018 - 2030 (USD Billion)
- Fig. 57 MEA smart factory market estimates & forecast, 2018 - 2030 (USD Billion)
- Fig. 58 Saudi Arabia smart factory market estimates & forecast, 2018 - 2030 (USD Billion)
- Fig. 59 South Africa smart factory market estimates & forecast, 2018 - 2030 (USD Billion)
- Fig. 60 UAE smart factory market estimates & forecast, 2018 - 2030 (USD Billion)
- Fig. 61 Key company categorization
- Fig. 62 Strategy framework
Smart Factory Market Growth & Trends:
The global smart factory market size is anticipated to reach USD 272.64 billion by 2030, according to a new report by Grand View Research, Inc. The market is projected to grow at a CAGR of 10.0% from 2025 to 2030. The market for smart factory has experienced remarkable growth in recent years, primarily attributed to several factors. These include the increasing adoption of Industry 4.0 concepts characterized by integrating digital technologies such as the Internet of Things (IoT), AI, Machine Learning (ML), and industrial automation. These technologies enhance operational efficiency and enable real-time data analysis, fostering agile and responsive manufacturing processes.
Moreover, the need for cost optimization and resource efficiency has prompted businesses to invest in smart factory solutions, as they promise reduced downtime, minimized wastage, and improved resource allocation. Besides, the growing emphasis on sustainability and environmental concerns has led manufacturers to gravitate towards the adoption of smart factories to monitor and optimize energy consumption and reduce their carbon footprint.
Additionally, technological advancements such as integrating connected devices with IoT and cloud computing act as development factors. Automated material handling, electronic and mechanical assembly, and product testing are all made easier with these cutting-edge technologies. Force sensors are also used in smart factories to maintain constant force during polishing, buffing, and deburring, collect data for statistical process control (SPC) systems, and ensure proper component insertion. Additional aspects, including the inclusion of the Industrial Internet of Things (IIoT) and the growing usage of smart factory solutions for the production of complex automotive and medical components, are expected to propel the smart factory sector during the forecast period.
Several companies operating in the market for smart factory adopt strategies such as mergers, acquisitions, partnerships, and innovations to enhance their product offerings to cater to the larger customer base and strengthen their foothold in the industry. For instance, in October 2022, ABB Robotics launched the IRB 1010, the smallest-ever industrial robot. The compact system is developed to help electronics manufacturers improve the production of devices such as smart watches, sensors, earphones, and health trackers.
This industrial robot by ABB Robotics also comes with a high payload capacity and accuracy. The compact system is created to assist electronics manufacturers in enhancing their production of devices such as earphones, health trackers, smartwatches, and sensors through automation. Such advancements are poised to fuel the growth of the smart factory industry in the coming years.
Smart Factory Market Report Highlights:
- Based on technology, the Distributed Control Systems (DCS) segment accounted for the largest market share in 2024. This is attributed to the growing investments from the industrial sector, such as food & beverage, mining & metal, metallurgy, and electronics, in developing economies
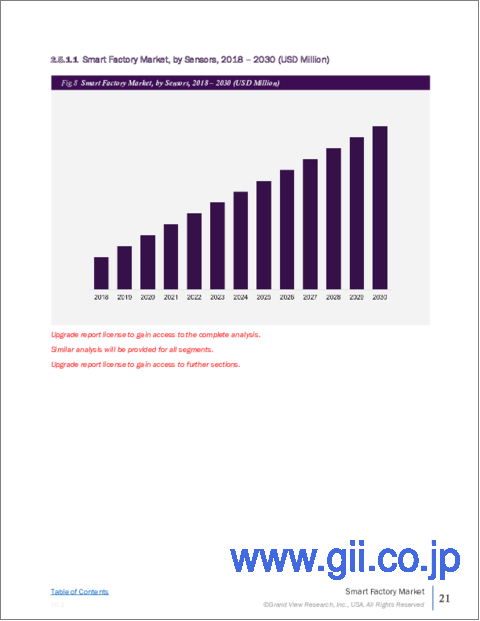
- Based on field devices, the sensors segment is expected to expand at the highest CAGR by 2030, owing to their increasing self-sufficiency with low power consumption and integrated computing abilities
- Based on application, the automotive segment accounted for the largest revenue share in 2024 and is expected to continue the same trend over the forecast period. Automotive manufacturers are investing heavily in the development of smart manufacturing and automation to optimize production and reduce operating costs
- The Asia Pacific regional market accounted for the largest revenue share in 2024. This is attributed to the heavy investments of developing countries in smart technologies to keep abreast of international manufacturing standards and trends
Table of Contents
Chapter 1. Methodology and Scope
- 1.1. Market Segmentation & Scope
- 1.2. Market Definitions
- 1.3. Information Procurement
- 1.3.1. Information analysis
- 1.3.2. Market formulation & data visualization
- 1.3.3. Data validation & publishing
- 1.4. 1.4 Research Scope and Assumptions
- 1.4.1. List to Data Sources
Chapter 2. Executive Summary
- 2.1. Smart Factory Market Snapshot
- 2.2. Smart Factory Market- Segment Snapshot (1/2)
- 2.3. Smart Factory Market- Segment Snapshot (2/2)
- 2.4. Smart Factory Market- Competitive Landscape Snapshot
Chapter 3. Smart factory market - Industry Outlook
- 3.1. Market Lineage Outlook
- 3.2. Industry Value Chain Analysis
- 3.3. Market Dynamics
- 3.3.1. Market Driver Analysis
- 3.3.2. Market Restraint Analysis
- 3.3.3. Industry Challenges
- 3.3.4. Industry Opportunities
- 3.4. Industry Analysis Tools
- 3.4.1. Porter's five forces analysis
- 3.4.2. Macroeconomic analysis
- 3.5. Smart Factory Market: Emerging Technologies
Chapter 4. Smart Factory Market: Technology Estimates & Trend Analysis
- 4.1. Segment Dashboard
- 4.2. Smart Factory Market: Technology Movement Analysis, USD Million, 2024 & 2030
- 4.3. Distributed Control Systems (DCS)
- 4.3.1. Distributed Control Systems Market Revenue Estimates and Forecasts, 2018 - 2030 (USD million)
- 4.4. Enterprise Resource Planning (ERP)
- 4.4.1. Enterprise Resource Planning (ERP) Market Revenue Estimates and Forecasts, 2018 - 2030 (USD million)
- 4.5. Human Machine Interface (HMI)
- 4.5.1. Human Machine Interface Market Revenue Estimates and Forecasts, 2018 - 2030 (USD million)
- 4.6. Manufacturing Execution System (MES)
- 4.6.1. Manufacturing Execution Systems Market Revenue Estimates and Forecasts, 2018 - 2030 (USD million)
- 4.7. Product Life Cycle Management (PLM)
- 4.7.1. Product Life Cycle Management (PLM) Market Revenue Estimates and Forecasts, 2018 - 2030 (USD million)
- 4.8. Program Logic Controller (PLC)
- 4.8.1. Program Logic Controller (PLC) Market Revenue Estimates and Forecasts, 2018 - 2030 (USD million)
- 4.9. Supervisory Controller and Data Acquisition (SCADA)
- 4.9.1. Supervisory Controller and Data Acquisition (SCADA) Market Revenue Estimates and Forecasts, 2018 - 2030 (USD million)
- 4.10. Others
- 4.10.1. Others Market Revenue Estimates and Forecasts, 2018 - 2030 (USD million)
Chapter 5. Smart Factory Market: Field Devices Estimates & Trend Analysis
- 5.1. Segment Dashboard
- 5.2. Smart Factory Market: Field Devices Movement Analysis, USD Million, 2024 & 2030
- 5.3. Sensors
- 5.3.1. Sensors Market Revenue Estimates and Forecasts, 2018 - 2030 (USD million)
- 5.4. Industrial Robotics
- 5.4.1. Industrial Robots Market Revenue Estimates and Forecasts, 2018 - 2030 (USD million)
- 5.5. Machine Vision Systems
- 5.5.1. Machine Vision Systems Market Revenue Estimates and Forecasts, 2018 - 2030 (USD million)
- 5.6. Others
- 5.6.1. Others Market Revenue Estimates and Forecasts, 2018 - 2030 (USD million)
Chapter 6. Smart Factory Market: Application Estimates & Trend Analysis
- 6.1. Segment Dashboard
- 6.2. Smart Factory Market: Application Movement Analysis, USD Million, 2024 & 2030
- 6.3. Aerospace & Defense
- 6.3.1. Aerospace & Defense Market Revenue Estimates and Forecasts, 2018 - 2030 (USD million)
- 6.4. Automotive
- 6.4.1. Automotive Market Revenue Estimates and Forecasts, 2018 - 2030 (USD million)
- 6.5. Energy & Power
- 6.5.1. Energy & Power Market Revenue Estimates and Forecasts, 2018 - 2030 (USD million)
- 6.6. Food and Beverages
- 6.6.1. Food and Beverages Market Revenue Estimates and Forecasts, 2018 - 2030 (USD million)
- 6.7. Healthcare
- 6.7.1. Healthcare Market Revenue Estimates and Forecasts, 2018 - 2030 (USD million)
- 6.8. Semiconductor & Electronics
- 6.8.1. Semiconductors & Electronics Market Revenue Estimates and Forecasts, 2018 - 2030 (USD million)
- 6.9. Oil & Gas
- 6.9.1. Oil & Gas Market Revenue Estimates and Forecasts, 2018 - 2030 (USD million)
- 6.10. Others
- 6.10.1. Others Market Revenue Estimates and Forecasts, 2018 - 2030 (USD million)
Chapter 7. Regional Estimates & Trend Analysis
- 7.1. Smart Factory Market by Region, 2024 & 2030
- 7.2. North America
- 7.2.1. North America Smart Factory Market Estimates & Forecasts, 2018 - 2030 (USD Billion)
- 7.2.2. U.S.
- 7.2.2.1. U.S. Smart Factory Market Estimates and Forecasts, 2018 - 2030 (USD million)
- 7.2.3. Canada
- 7.2.3.1. Canada Smart Factory Market Estimates and Forecasts, 2018 - 2030 (USD million)
- 7.2.4. Mexico
- 7.2.4.1. Mexico Smart Factory Market Estimates and Forecasts, 2018 - 2030 (USD million)
- 7.3. Europe
- 7.3.1. Europe Smart Factory Market Estimates and Forecasts, 2018 - 2030 (USD million)
- 7.3.2. UK
- 7.3.2.1. UK Smart Factory Market Estimates and Forecasts, 2018 - 2030 (USD million)
- 7.3.3. Germany
- 7.3.3.1. Germany Smart Factory Market Estimates and Forecasts, 2018 - 2030 (USD million)
- 7.3.4. France
- 7.3.4.1. France Smart Factory Market Estimates and Forecasts, 2018 - 2030 (USD million)
- 7.3.5. Italy
- 7.3.5.1. Italy Smart Factory Market Estimates and Forecasts, 2018 - 2030 (USD million)
- 7.3.6. France
- 7.3.6.1. Spain Smart Factory Market Estimates and Forecasts, 2018 - 2030 (USD million)
- 7.3.6.2.
- 7.4. Asia Pacific
- 7.4.1. Asia Pacific Smart Factory Market Estimates and Forecasts, 2018 - 2030 (USD million)
- 7.4.2. China
- 7.4.2.1. China Smart Factory Market Estimates and Forecasts, 2018 - 2030 (USD million)
- 7.4.3. Japan
- 7.4.3.1. Japan Smart Factory Market Estimates and Forecasts, 2018 - 2030 (USD million)
- 7.4.4. India
- 7.4.4.1. India Smart Factory Market Estimates and Forecasts, 2018 - 2030 (USD million)
- 7.4.5. South Korea
- 7.4.5.1. South Korea Smart Factory Market Estimates and Forecasts, 2018 - 2030 (USD million)
- 7.4.6. Australia
- 7.4.6.1. Australia Smart Factory Market Estimates and Forecasts, 2018 - 2030 (USD million)
- 7.5. Latin America
- 7.5.1. Latin America Smart Factory Market Estimates and Forecasts, 2018 - 2030 (USD million)
- 7.5.2. Brazil
- 7.5.2.1. Brazil Smart Factory Market Estimates and Forecasts, 2018 - 2030 (USD million)
- 7.6. Middle East and Africa
- 7.6.1. Middle East and Africa Smart Factory Market Estimates and Forecasts, 2018 - 2030 (USD million)
- 7.6.2. UAE
- 7.6.2.1. UAE Smart Factory Market Estimates and Forecasts, 2018 - 2030 (USD million)
- 7.6.3. Saudi Arabia
- 7.6.3.1. Saudi Arabia Smart Factory Market Estimates and Forecasts, 2018 - 2030 (USD million)
- 7.6.4. South Africa
- 7.6.4.1. South Africa Smart Factory Market Estimates and Forecasts, 2018 - 2030 (USD million)
Chapter 8. Smart factory market - Competitive Landscape
- 8.1. Company Categorization
- 8.2. Company Market Positioning
- 8.3. Company Heat Map Analysis
- 8.4. Company Profiles/Listing
- 8.4.1. Emerson Electric Co.
- 8.4.1.1. Participant's Overview
- 8.4.1.2. Financial Performance
- 8.4.1.3. Product Benchmarking
- 8.4.1.4. Recent Developments
- 8.4.2. KUKA AG
- 8.4.2.1. Participant's Overview
- 8.4.2.2. Financial Performance
- 8.4.2.3. Product Benchmarking
- 8.4.2.4. Recent Developments
- 8.4.3. Siemens AG
- 8.4.3.1. Participant's Overview
- 8.4.3.2. Financial Performance
- 8.4.3.3. Product Benchmarking
- 8.4.3.4. Recent Developments
- 8.4.4. GE Vernova (General Electric Company)
- 8.4.4.1. Participant's Overview
- 8.4.4.2. Financial Performance
- 8.4.4.3. Product Benchmarking
- 8.4.4.4. Recent Developments
- 8.4.5. Rockwell Automation, Inc.
- 8.4.5.1. Participant's Overview
- 8.4.5.2. Financial Performance
- 8.4.5.3. Product Benchmarking
- 8.4.5.4. Recent Developments
- 8.4.6. Schiender Electric
- 8.4.6.1. Participant's Overview
- 8.4.6.2. Financial Performance
- 8.4.6.3. Product Benchmarking
- 8.4.6.4. Recent Developments
- 8.4.7. Honeywell International, Inc.
- 8.4.7.1. Participant's Overview
- 8.4.7.2. Financial Performance
- 8.4.7.3. Product Benchmarking
- 8.4.7.4. Recent Developments
- 8.4.8. ABB Ltd.
- 8.4.8.1. Participant's Overview
- 8.4.8.2. Financial Performance
- 8.4.8.3. Product Benchmarking
- 8.4.8.4. Recent Developments
- 8.4.9. Mitsubishi Electric Corporation
- 8.4.9.1. Participant's Overview
- 8.4.9.2. Financial Performance
- 8.4.9.3. Product Benchmarking
- 8.4.9.4. Recent Developments
- 8.4.10. Fanuc Corporation
- 8.4.10.1. Participant's Overview
- 8.4.10.2. Financial Performance
- 8.4.10.3. Product Benchmarking
- 8.4.10.4. Recent Developments
- 8.4.11. Cisco System Inc.
- 8.4.11.1. Participant's Overview
- 8.4.11.2. Financial Performance
- 8.4.11.3. Product Benchmarking
- 8.4.11.4. Recent Developments
- 8.4.12. Dassault Systemes S.E
- 8.4.12.1. Participant's Overview
- 8.4.12.2. Financial Performance
- 8.4.12.3. Product Benchmarking
- 8.4.12.4. Recent Developments
- 8.4.1. Emerson Electric Co.
