|
|
市場調査レポート
商品コード
1269569
欧州のデジタルゲーミング市場:2023年Europe Digital Gaming Market 2023 |
||||||
| 欧州のデジタルゲーミング市場:2023年 |
|
出版日: 2023年04月27日
発行: yStats.com
ページ情報: 英文 60 Pages
納期: 即日から翌営業日
|
- 全表示
- 概要
- 目次
世界のゲーミング市場の収益規模は上昇傾向にあり、2022年には1,800億ユーロに近い規模を示しています。また、2022年から2025年にかけては、約5%のCAGRで成長し、数十億ユーロの規模に達すると予測されています。
欧州は、アジア太平洋、北米に次ぐ第3位のシェアを占め、2022年には300億ユーロに近い収益規模を示しています。ゲームプレーヤー数においても、欧州は2022年に全体の10分の1以上のシェアを示しています。
当レポートでは、欧州のデジタルゲーミングの市場を調査し、世界、欧州全体、主要国における主要動向、収益の推移・予測、プレーヤー数の推移・予測、デバイスおよびプラットフォームの好み、課金に関する動向などをまとめています。
目次
目次:
第1章 マネジメントサマリー
第2章 世界
- デジタルゲーミング市場動向の概要
- ゲーミング市場収益の推移・予測
- ビデオゲーミングの総収益の推移・予測
- ゲーミング市場収益:セグメント別
- ゲーミング収益の内訳:セグメント別
- ゲーミング市場収益:地域別
- ゲーミング収益の内訳:地域別
- モバイルゲーミング収益の国別シェア
- ゲーミングプレイヤー総数の推移・予測
- プレイヤー総数の地域別内訳
- ゲーミングプレイヤー数:セグメント別
- プレーヤーがビデオゲーミングをするために最もよく使われるデバイス
- 最も好まれるゲーミングプラットフォーム:世代別
- モバイルゲーミング収益のチャネル別シェア
- iOSモバイルゲーミングの年間収益
- Google Playモバイルゲーミングの年間収益
- アプリ内ビデオゲーミング広告の総収益
- 従来の代替手段と比較した没入型ゲームで最も好ましいアクティビティトップ5
- プレーヤーが積極的に参加したいと考えているゲーミング関連の主な側面
- ゲーミング内購入にお金を費やすことを好むプレーヤーの割合
- プレーヤーが行うゲーミング内購入の上位
- メタバースで購入を行う理由トップ3
- オンラインゲーミング売上トップ10
- Apple App Storeでのオンラインゲーミングトップ売上トップ10
- Google Playストアのオンラインゲーミングトップ売上トップ10
第3章 欧州
- 地域別
- デジタルゲーミング市場の動向:概要
- 英国
- ドイツ
- フランス
- スペイン
- イタリア
- ロシア
"The gaming market revenue is predicted to maintain continuous growth between 2022 and 2025, backed by government initiatives, especially in Europe, to boost growth further": new yStats.com report.
The growth of digital gaming globally and especially in Europe soars in the backdrop of initiatives taken by the European Union
The gaming market revenue worldwide is seen to be rising and reached a value close to EUR 180 billion as of 2022. Furthermore, the gaming market revenue is forecasted to grow at a CAGR of nearly +5% between 2022 and 2025, reaching a value in the billions of euros, as revealed by the new yStats.com report. The boom of the overall gaming market shaped consumer expectations, and brands and gaming companies invested in better gaming processors, improved graphics, advanced games, and gaming hardware, among others, leading to more satisfaction for gamers. The European digital gaming market is no exception to these changes within the digital gaming market and is also booming in terms of revenue and viewership, making it one of the fast-growing regions when it comes to gaming. Moreover, Europe accounted for the third-largest share of total gaming revenue after Asia-Pacific and North America, generating estimated revenue of close to EUR 30 billion as of 2022. In terms of the number of gaming players too, Europe constituted a share of more than one-tenth of the total gaming players as of 2022. To further boost the digital gaming market, the European Union has laid down some initiatives in which it aims to invest more than EUR 15 million, as per a source cited in the new yStats.com report. Apart from this, the European Video Game Society project was introduced in January 2022 to evaluate policies and approaches supporting the gaming industry in Europe.
Mobile gaming is yet another emerging trend transforming the digital gaming market in Europe
The mobile gaming market has accelerated following the shift of several digital gamers towards mobile gaming and the rising use of mobile devices as preferred gaming platforms across nations in Europe. The popularity of mobile gaming has gained traction among various companies such as Netflix, Google, and Amazon, among others, with Netflix introducing Netflix Gaming as an initiative to set its foot in the digital gaming market in Europe, as revealed by the new yStats.com report. Western Europe is emerging as a hub of mobile gaming, with the region ranking 3rd in terms of mobile gaming revenue after Eastern Asia and North America. Furthermore, gamers in countries such as the UK, Germany, and France are leaning towards using smartphones and mobile devices as their most preferred gaming platforms. While more than half of surveyed gamers in Germany used smartphones for playing games, nearly half of them indicated they were using consoles such as Nintendo, Xbox, and PlayStation as of 2022. However, in terms of age groups, smartphones, laptops, and tablets were the top three most preferred gaming platforms among gamers in the age range of 16-29 years, while gamers belonging to the age group of 65+ were seen to be using desktop and consoles the most as of July 2022. With more than two-thirds of surveyed internet users in France claiming to play games at least occasionally as of September 2022, smartphones and consoles were the most preferred gaming platforms for gamers during the same period, according to the new yStats.com report.
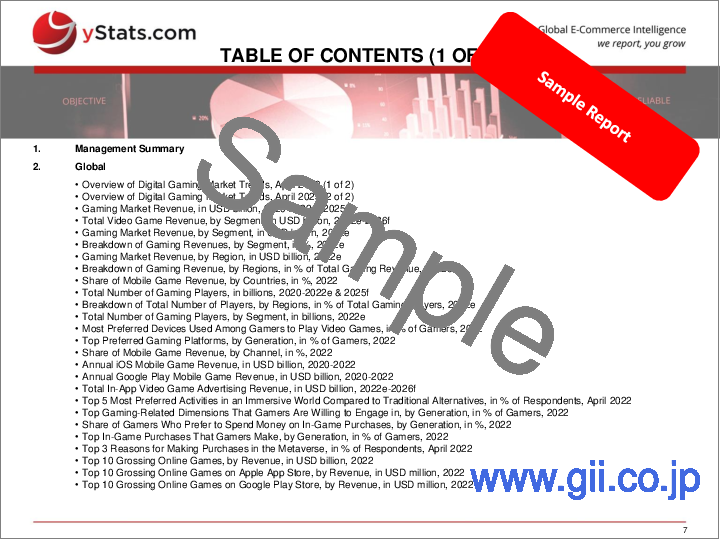
Table of Contents
1. Management Summary
2. Global
- Overview of Digital Gaming Market Trends, April 2023 (1 of 2)
- Overview of Digital Gaming Market Trends, April 2023 (2 of 2)
- Gaming Market Revenue, in USD billion, 2020-2022 & 2025f
- Total Video Game Revenue, by Segment, in USD billion, 2022e-2026f
- Gaming Market Revenue, by Segment, in USD billion, 2022e
- Breakdown of Gaming Revenues, by Segment, in %, 2022e
- Gaming Market Revenue, by Region, in USD billion, 2022e
- Breakdown of Gaming Revenue, by Regions, in % of Total Gaming Revenue, 2022e
- Share of Mobile Game Revenue, by Countries, in %, 2022
- Total Number of Gaming Players, in billions, 2020-2022e & 2025f
- Breakdown of Total Number of Players, by Regions, in % of Total Gaming Players, 2022e
- Total Number of Gaming Players, by Segment, in billions, 2022e
- Most Preferred Devices Used Among Gamers to Play Video Games, in % of Gamers, 2022
- Top Preferred Gaming Platforms, by Generation, in % of Gamers, 2022
- Share of Mobile Game Revenue, by Channel, in %, 2022
- Annual iOS Mobile Game Revenue, in USD billion, 2020-2022
- Annual Google Play Mobile Game Revenue, in USD billion, 2020-2022
- Total In-App Video Game Advertising Revenue, in USD billion, 2022e-2026f
- Top 5 Most Preferred Activities in an Immersive World Compared to Traditional Alternatives, in % of Respondents, April 2022
- Top Gaming-Related Dimensions That Gamers Are Willing to Engage in, by Generation, in % of Gamers, 2022
- Share of Gamers Who Prefer to Spend Money on In-Game Purchases, by Generation, in %, 2022
- Top In-Game Purchases That Gamers Make, by Generation, in % of Gamers, 2022
- Top 3 Reasons for Making Purchases in the Metaverse, in % of Respondents, April 2022
- Top 10 Grossing Online Games, by Revenue, in USD billion, 2022
- Top 10 Grossing Online Games on Apple App Store, by Revenue, in USD million, 2022
- Top 10 Grossing Online Games on Google Play Store, by Revenue, in USD million, 2022
3. Europe
- 3.1. Regional
- Overview of Digital Gaming Market Trends, April 2023
- 3.2. UK
- Total Video Game Sales, by Segment, in USD billion, 2022
- Ranking of Devices Used for Gaming, in % of Adults, January 2022
- Top Activities for Which Users Use the Metaverse, incl. "Gaming", in % of Metaverse Users, October 2022
- Top Barriers to Adoption of the Metaverse, in % of Gamers, March 2022
- Share of Gamers Who Consider By-Passing Purchase of Gaming Hardware in Favor of the Cloud, in %, March 2022
- Share of Gamers Who Used or Plan to Use Popular Cloud Gaming Services Such as Xbox Game Pass, in %, March 2022
- 3.3. Germany
- Breakdown of Computer and Video Games Sales, by Segment, in EUR billion, H1 2021 & H1 2022
- Share of Respondents Playing Video Games, by Age, in %, 2022e
- Preferred Device Used for Playing Video Games, by Age, in % of Gamers, July 2022
- Share of Gamers Who Believe Mobile Gaming is Getting Technically Closer to PC and Console, in %, August 2022
- Share of Gamers Who Spent Money on Video or Computer Games in the Last 12 Months, in %, July 2022
- Top Activities On Which Gamers Spent Their Money, in % of Gamers, July 2022
- 3.4. France
- Share of Internet Users Who Claim to Play Video Games At least Occasionally, in %, September 2022
- Preferred Devices Used for Gaming, in % of Gamers, September 2022
- Share of Solo Players Who Prefer to Play Video Games Either Online or Locally, in %, September 2022
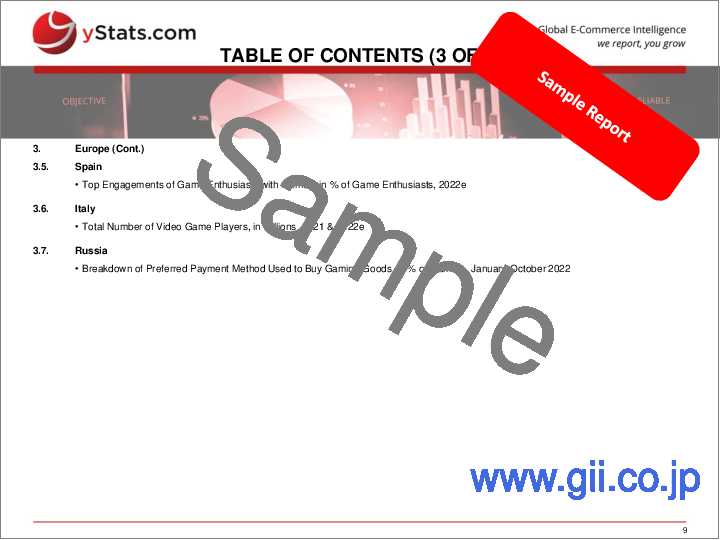
- 3.5. Spain
- Top Engagements of Game Enthusiasts with Games, in % of Game Enthusiasts, 2022e
- 3.6. Italy
- Total Number of Video Game Players, in millions, 2021 & 2022e
- 3.7. Russia
- Breakdown of Preferred Payment Method Used to Buy Gaming Goods, in % of Gamers, January-October 2022


