|
|
市場調査レポート
商品コード
1237826
越境B2C Eコマースの世界市場 (2023年)Global Cross-Border B2C E-Commerce Market 2023 |
||||||
| 越境B2C Eコマースの世界市場 (2023年) |
|
出版日: 2023年03月14日
発行: yStats.com
ページ情報: 英文 125 Pages
納期: 即日から翌営業日
|
- 全表示
- 概要
- 目次
越境B2C Eコマースを含めた、世界の越境Eコマース市場は、今後4年間で2桁の成長を遂げると予測されています。
越境B2C Eコマース市場が徐々に進化する中、越境B2C決済の取引額は、2020年から2022年にかけて増加傾向を示しています。越境オンラインショッピングでは、カードベースの支払い方法が最も好まれる支払い方法の一つですが、PayPalやAliPayなどのモバイルウォレットは、地域間のオンライン買い物客の間で人気を博しています。
パンデミック中およびパンデミック後のオンラインショッピングの需要の高まりにより、越境B2C Eコマースへの移行が徐々に進みました。2021年11月現在、世界のオンライン買い物客の4分の1以上が、より低価格で高品質な商品のため、越境購入を好んでおり、衣類、アパレル、フットウェアは、オンライン買い物客の3分の1以上が最も購入するカテゴリーとなっています。中国は、世界的に好まれる越境購入先であり、ギリシャ、ラトビア、米国、インドネシアなどで最も高いシェアを獲得しています。しかし、2021年時点のEコマース市場における同国のシェアは、2020年時点のシェアと比較して減少しています。また、直近の越境購入国別では、日本、インド、英国、ニュージーランド、米国における中国のシェアは、2020年のシェアと比較して低下しています。
当レポートでは、世界の越境B2C Eコマース市場の最新動向について分析し、市場の基本構造や主な傾向、全体的な市場規模 (取引額・取引件数、ショッピング客の人数など)、地域別・国別の詳細動向、消費者の選好・選択状況などを調査しております。
目次
第1章 経営の概要
第2章 世界
- 越境B2C Eコマース市場の概要 (2022年11月)
- 越境B2C Eコマースの市場規模 (単位:1兆米ドル、2022年・2026年)
- 越境購入を行うオンラインショッピング客の割合:国別 (2022年9月)
- 国際的に販売している小売業者の割合 (国別:2022年9月)
- 越境Eコマースの取引額:Eコマース総取引額に対するシェア (2023年)
- 国外で購入したオンラインショッピング客の割合 (2019年・2021年)
- 2020年よりも今の方が、越境ショッピングに慣れているオンラインショッピング客の割合 (2022年1月)
- ブランド製品を国際的に購入するオンラインショッピング客の間で優先されるプラットフォーム:オンラインショッピング客のシェア (2022年7月)
- 越境ショッピングに使用される、上位のオンラインプラットフォームの内訳:越境購入のシェア (2022年10月)
- 海外のオンライン購入に最も使用されたデバイスの内訳:オンラインショッピング客の割合 (2022年7月)
- 市場を使用する代わりに、国際的なブランドから直接購入することを好むショッピング客のシェア (世代別、ショッピング客の割合 (2022年第2四半期))
- 国際的に高級品を購入したショッピング客の割合:主要国別 (2022年第2四半期)
- 高級品の越境購入で最も人気のある市場:ショッピング客の割合 (2022年第2四半期)
- 高級品越境購入で、オンラインで購入した商品をすぐに受け取るために実店舗でのショッピング体験を差し控えることをいとわない、ショッピング客の割合 (2022年第2四半期)
- ショッピング客が国際的に購入する、上位の高級品カテゴリー:ショッピング客の割合 (2022年第2四半期)
- 越境B2C Eコマースで購入された、上位の製品カテゴリー:オンラインショッピング客の割合 (2022年10月)
- オンラインショッピング客の割合における、越境オンライン購入のシェア (金額ベース、2022年10月)
- オンラインショッピング客に対する、越境オンライン購入の内訳 (製品重量ベース、2021年10月)
- 越境ショッピングの主な理由:回答者の割合 (2022年9月)
- 越境ショッピングの主な理由:世代別、回答者の割合 (2021年11月)
- 海外でオンラインショッピングをする際にカートを放棄する主な理由:オンラインショッピング客の割合 (2022年7月)
- オンラインショッピング客の割合における、越境オンライン購入の割合:配送速度別 (2022年10月)
- 直近にB2C Eコマースの購入を行った主要国:オンラインショッピング客の割合 (2022年10月)
- 越境オンライン購入頻度の内訳:世代別、回答者の割合 (2021年11月)
- オンラインショッピング客が将来、国内/国外の小売業者からオンライン購入する意向の内訳 (2022年10月)
- 越境決済の取引額:B2B・B2C・C2B・C2C別 (単位:1兆米ドル、2020年~2022年)
- 越境ショッピング用B2C Eコマースアプリ:上位10種のダウンロード件数 (2020年、2021年第1四半期~2021年第3四半期)
- 最も多くダウンロードされた、越境ショッピング用B2C Eコマースアプリ:上位10種のダウンロード数別 (単位:100万件、2022年上半期)
第3章 アジア太平洋
- 日本
- 韓国
- オーストラリア
- シンガポール
- ニュージーランド
- 中国
- インド
- インドネシア
- マレーシア
第4章 欧州
- ドイツ
- イタリア
- スペイン
- 英国
- フランス
- スウェーデン
- オランダ
- オーストリア
- ベルギー
- スイス
- アイルランド
- デンマーク
- フィンランド
- アイスランド
- ルクセンブルク
- ポルトガル
- ロシア
- トルコ
- ギリシャ
- ハンガリー
- クロアチア
- スロベニア
- エストニア
- リトアニア
- ラトビア
- キプロス
第5章 北米
- 米国
- カナダ
第6章 ラテンアメリカ
- ブラジル
- メキシコ
- コロンビア
- チリ
第7章 中東・アフリカ
- サウジアラビア
- アラブ首長国連邦
The cross-border E-Commerce market inclusive of the B2C E-Commerce is forecasted to witness a double-digit growth in the next four years": new yStats.com report.
Digital wallets are gaining momentum as the preferred cross-border B2C E-Commerce payment method
As the cross-border B2C E-Commerce market is gradually evolving, the transaction value of cross-border B2C payments has shown an increasing trend between 2020 and 2022. Although card-based payment methods are among the most preferred payment methods for online cross-border shopping, mobile wallets such as PayPal, AliPay among others are gaining popularity among online shoppers across regions, according to the new yStats.com report. For instance, Japan and Singapore accounted for more than half of online shoppers using credit cards to pay for their cross-border purchases as of January 2022. While digital wallets such as PayPal and Alipay were preferred among nearly half the online shoppers in Australia and China respectively, the growth of cross-border B2C E-Commerce across Asia-Pacific also led to an emergence of embedded finance options to pay for cross-border purchases. Companies such as PayPal and Currency Cloud support the embedded finance ecosystem across Asia-Pacific. Payments via mobile phones, websites, and wearable devices are becoming popular in the region due to the rise of QR codes and tokenization, as spelled out by the new yStats.com report. The popularity of digital wallets is not limited to Asia-Pacific and can even be seen across Europe. For example, PayPal, followed by credit card and direct transfer were the top 3 cross-border payment methods that online shoppers used as of April 2022. Similarly, Italy also saw more than half of online shoppers inclining towards PayPal when it came to their cross-border purchases as of January 2022.
Clothing and footwear accounted for the most bought product categories, with China being the preferred purchase destination
The growing demand for online shopping during and post pandemic also led to the gradual shift towards cross-border B2C E-Commerce. More than one-fourth online shoppers globally preferred cross-border purchases due to lower prices and better quality of products as of November 2021, with clothing, apparel and footwear being the most purchased categories among more than one-third of online shoppers. Fashion items such as clothing and footwear were also popular cross-border purchase categories among more than half of online shoppers in Germany and the Netherlands as of H1 2022, as revealed by the new yStats.com report. Furthermore, more than half of online shoppers in Luxembourg also preferred to purchase clothing, footwear, and accessories via online cross-border channels as of 2021. While in China and Australia online shoppers inclined more towards the purchase of cosmetics and games & toys respectively when it came to online shopping. China was the preferred cross-border purchase destination worldwide, with its share being the highest in Greece, Latvia, USA, and Indonesia among other nations. Despite this, the country's share in E-Commerce market decline as of 2021 in comparison to its share in 2020. Moreover, in terms of the country of most recent cross-border purchase, China's share in Japan, India, UK, New Zealand, as well as the U.S. saw a dip compared to its share in 2020.
Table of Contents
1. Management Summary
2. Global
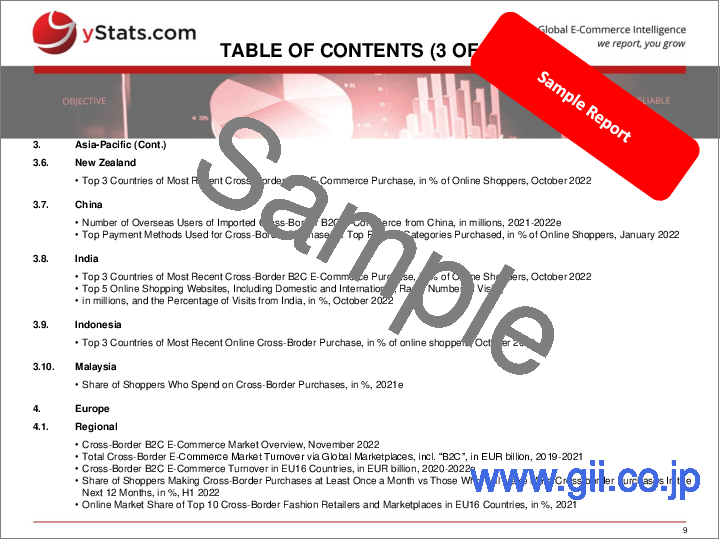
- Cross-Border B2C E-Commerce Market Overview, November 2022
- Cross-Border B2C E-Commerce Market Size, in USD trillion, 2022e & 2026f
- Share of Online Shoppers Making Cross-Border Purchases, by Select Countries, in %, September 2022
- Share of Retailers Selling Internationally, by Select Countries, in %, September 2022
- Share of Cross-Border E-Commerce Value of Total E-Commerce Transactions, in %, 2023f
- Share of Online Shoppers Who Made Purchases Outside Their Country, in %, 2019 & 2021
- Share of Online Shoppers Who Are More Comfortable With Cross-Border Shopping Now Than in 2020, in %, January 2022
- Preferred Platforms Among Online Shoppers for Buying a Branded Product Internationally, in % of Online Shoppers, July 2022
- Breakdown of Top Online Platforms Used for Cross-Border Shopping, in % of Cross-Border Purchases, October 2022
- Breakdown of the Most Used Devices for Making International Online Purchase, in % of Online Shoppers, July 2022
- Share of Shoppers Who Prefer to Buy Directly From International Brands Instead of Using Marketplaces, by Generation, in % of Shoppers, Q2 2022
- Share of Shoppers From Select Countries Who Shopped for Luxury Products Internationally, in %, Q2 2022
- Most Popular Market for the Purchase of Cross-Border Luxury Products, in % of Shoppers, Q2 2022
- Share of Luxury Cross-Border Shoppers Who Are Willing to Forgo In-Store Shopping Experience to Receive Their Products Quickly When Purchased Online, in %, Q2 2022
- Top Luxury Product Categories That Shoppers Buy Internationally, in % of Shoppers, Q2 2022
- Top Product Categories Purchased via Cross-Border B2C E-Commerce, in % of Online Shoppers, October 2022
- Share of Cross-Border Online Purchases, by Product Value, in % of Online Shoppers, October 2022
- Breakdown of Cross-Border Online Purchases, by Product Weight, in % of Online Shoppers, October 2021
- Top Reasons for Cross-Border Shopping, in % of Respondents, September 2022
- Top Reasons for Making Cross-Border Purchases, by Generation, in % of Respondents, November 2021
- Top Reasons for Cart Abandonment When Shopping Online Internationally, in % of Online Shoppers, July 2022
- Share of Cross-Border Online Purchases, by Delivery Speed, in % of Online Shoppers, October 2022
- Top Countries From Where The Most Recent Cross-Border B2C E-Commerce Purchases Were Made, in % of Online Shoppers, October 2022
- Breakdown of Cross-Border Online Purchase Frequency, by Generation, in % of Respondents, November 2021
- Breakdown of Online Shoppers' Future Intentions to Buy Online From Domestic and Foreign Retailers, in %, October 2022
- Cross-Border Payment Transaction Value, by B2B, B2C, C2B and C2C, in USD trillion, 2020-2022f
- Top 10 Shopping Apps by Downloads, incl. "Cross-Border B2C E-Commerce Apps", 2020 & Q1 2021-Q3 2021
- 10 Most Downloaded Shopping Apps, incl. "Cross-Border B2C E-Commerce Apps", by Number of Downloads, in millions, H1 2022
3. Europe
- 3.1. Regional
- Cross-Border B2C E-Commerce Market Overview, November 2022
- Total Cross-Border E-Commerce Market Turnover via Global Marketplaces, incl. "B2C", in EUR billion, 2019-2021
- Cross-Border B2C E-Commerce Turnover in EU16 Countries, in EUR billion, 2020-2022e
- Share of Shoppers Making Cross-Border Purchases at Least Once a Month vs Those Who Will Make More Cross-border Purchases In the Next 12 Months, in %, H1 2022
- Online Market Share of Top 10 Cross-Border Fashion Retailers and Marketplaces in EU16 Countries, in %, 2021
- Cross-Border Online Shopper Penetration, by EU and Selected Non-EU Countries, in % of Individuals, 2021 (1 of 2)
- Cross-Border Online Shopper Penetration, by EU and Selected Non-EU Countries, in % of Individuals, 2021 (2 of 2)
- 3.2. Germany
- Breakdown of E-Commerce Companies Selling Abroad, by Customer Segment & Country, incl. "B2C", in %, April 2022
- Top Purchase Categories When Shopping Cross-Border, in % of Online Shoppers, H1 2022
- Top Payment Methods That Are Most Suitable for International B2C E-Commerce of Retail sellers, in % of Companies, April 2022
- 3.3. Italy
- Breakdown of Cross-Border B2C E-Commerce Sales Trends, in % of Companies, 2020 & 2021
- Top Payment Methods Used by Online Shoppers for Their Cross-Border Purchases, in % of Online Shoppers, January 2022
- 3.4. Spain
- Breakdown of B2C E-Commerce Purchase Revenue, by Place of Origin, in % of Revenue, Q2 2021
- 3.5. UK
- Cross-Border E-Commerce Sales, incl."B2C", in EUR billion, 2020-2021
- Share of Online Shoppers Who Avoid Buying from Abroad Due to Additional Taxes and Charges, in %, & Top Factors That Will Drive Cross-Border Purchases, in % of Online Shoppers, 2021
- Share of Online Shoppers Who Made Cross-Border Purchases, in %, & Top Product Categories Purchased Cross-Border, in % of Online Shoppers, January 2022
- 3.6. France
- Top Purchase Channels From Where Online Shoppers Buy Their Cross-Border Purchases, in % of Online Shoppers, January 2022
- 3.7. Sweden
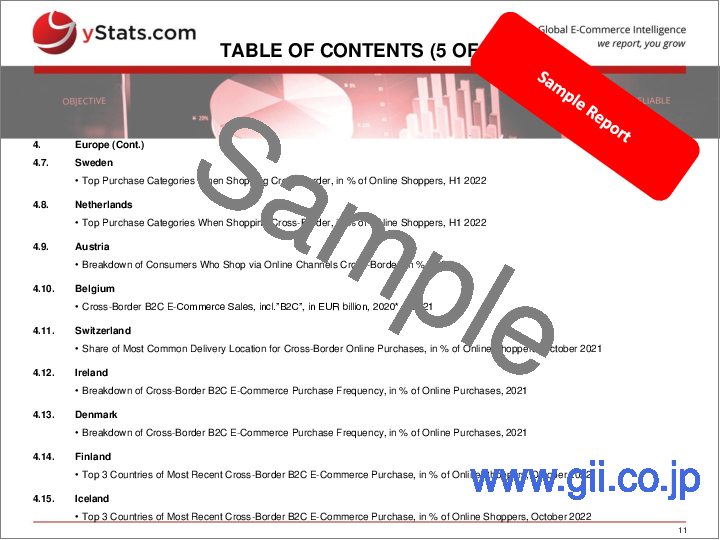
- Top Purchase Categories When Shopping Cross-Border, in % of Online Shoppers, H1 2022
- 3.8. Netherlands
- Top Purchase Categories When Shopping Cross-Border, in % of Online Shoppers, H1 2022
- 3.9. Austria
- Breakdown of Consumers Who Shop via Online Channels Cross-Border, in %, 2021
- 3.10. Belgium
- Cross-Border B2C E-Commerce Sales, incl."B2C", in EUR billion, 2020* & 2021
- 3.11. Switzerland
- Share of Most Common Delivery Location for Cross-Border Online Purchases, in % of Online Shoppers, October 2021
- 3.12. Ireland
- Breakdown of Cross-Border B2C E-Commerce Purchase Frequency, in % of Online Purchases, 2021
- 3.13. Denmark
- Breakdown of Cross-Border B2C E-Commerce Purchase Frequency, in % of Online Purchases, 2021
- 3.14. Finland
- Top 3 Countries of Most Recent Cross-Border B2C E-Commerce Purchase, in % of Online Shoppers, October 2022
- 3.15. Iceland
- Top 3 Countries of Most Recent Cross-Border B2C E-Commerce Purchase, in % of Online Shoppers, October 2022
- 3.16. Luxembourg
- Share of Top Cross-Border B2C E-Commerce Purchase Categories, in % of Cross-Border B2C E-Commerce Purchases, 2021
- 3.17. Portugal
- Share of Individuals Purchasing Products Online Nationally and Cross-Border, in %, 2021
- 3.18. Russia
- Share of Cross-Border B2C E-Commerce Trade in Total B2C E-Commerce Trade, in %, Q4 2021 & H1 2022
- 3.19. Turkey
- Breakdown of Domestic and Foreign Distribution of B2C E-Commerce Expenditure, in %, H1 2022
- 3.20. Greece
- Top 3 Countries of Most Recent Cross-Border B2C E-Commerce Purchase, in % of Online Shoppers, October 2022
- 3.21. Hungary
- Share of Online Shoppers Whose Cross-Border B2C E-Commerce Purchase Was Delivered in 15-29 Days, in %, October 2021
- 3.22. Croatia
- Share of Most Recent Cross-Border B2C E-Commerce Purchases Made via eBay, in %, October 2022
- 3.23. Slovenia
- Top 3 Countries of Most Recent Cross-Border B2C E-Commerce Purchase, in % of Online Shoppers, October 2022
- 3.24. Estonia
- Share of Most Common Delivery Location for Cross-Border Online Purchases, in % of Respondents, October 2021
- 3.25. Lithuania
- Share of Most Recent Cross-Border B2C E-Commerce Purchases Made via Alibaba/AliExpress, in %, October 2022
- 3.26. Latvia
- Top 3 Countries of Most Recent Online Cross-Broder Purchase, in % of Online Shoppers, October 2022
- 3.27. Cyprus
- Top 3 Countries of Most Recent Online Cross-Broder Purchase, in % of Online Shoppers, October 2022


