|
|
市場調査レポート
商品コード
1298479
シリコンフォトニクスの世界市場調査レポート:産業分析、市場規模、シェア、成長、動向、2023~2030年予測Global Silicon Photonics Market Research Report - Industry Analysis, Size, Share, Growth, Trends and Forecast 2023 to 2030 |
||||||
|
|
|||||||
カスタマイズ可能
|
|||||||


| シリコンフォトニクスの世界市場調査レポート:産業分析、市場規模、シェア、成長、動向、2023~2030年予測 |
|
出版日: 2023年06月01日
発行: Value Market Research
ページ情報: 英文 190 Pages
納期: 即日から翌営業日
|

- 全表示
- 概要
- 図表
- 目次
シリコンフォトニクスの世界需要は、2022年の29億米ドルから2030年にはほぼ225億6,000万米ドルの市場規模に達すると推定され、調査期間2023~2030年のCAGRは29.23%です。
シリコンフォトニクスは、光源、検出器、変調器、導波路などの光学部品やデバイスをシリコンベースのプラットフォームに集積する技術です。フォトニクスとマイクロエレクトロニクスの分野を融合し、シリコンベースの材料と製造技術を使って光の操作と伝送を可能にします。従来、電子デバイスは電気信号の操作に基づいていたが、フォトニクスは光の操作に焦点を当てています。この技術は、高い屈折率や確立された半導体製造プロセスとの互換性といったシリコン独自の特性を活用することで、この2つの領域のギャップを埋めるものです。
市場力学
データ集約型アプリケーション、クラウド・コンピューティング、5G、AI、IoTによる高速データ伝送需要と帯域幅の増大が、シリコンフォトニクスの採用を後押ししています。フォトニックコンポーネントを既存のシリコンベースのエレクトロニクス技術と統合することで、従来のフォトニクス技術と比較して性能、エネルギー効率、コスト効率の向上が可能になるため、大きな促進要因となっています。また、エネルギー効率と消費電力の低減も市場を牽引しており、シリコンフォトニクスは電気的相互接続よりも消費電力の点で有利です。拡張性と費用対効果は、この技術が確立された半導体製造プロセスと互換性を持つことで達成され、低コストでの大量生産が容易になります。製造技術とパッケージング技術の進歩により、シリコンフォトニクスデバイスの性能と信頼性がさらに向上し、商業的な実現可能性が高まっています。
この調査レポートは、ポーターのファイブフォースモデル、市場魅力度分析、バリューチェーン分析をカバーしています。これらのツールは、業界の構造を明確に把握し、世界レベルでの競合の魅力を評価するのに役立ちます。さらに、これらのツールはシリコンフォトニクスの世界市場における各セグメントを包括的に評価することもできます。シリコンフォトニクス産業の成長と動向は、この調査に全体的なアプローチを提供します。
地域分析
本セクションでは、北米、欧州、アジア太平洋、ラテンアメリカ、中東アフリカにおけるシリコンフォトニクス市場の現在と将来の需要を強調する地域展望をカバーします。さらに、すべての主要地域における個々のアプリケーションセグメントの需要、推定・予測にも焦点を当てています。
この調査レポートはまた、市場の主要企業の包括的なプロファイルと世界の競合情勢の詳細な見解もカバーしています。このセクションは、主要なM&A、将来的な能力、パートナーシップ、財務概要、提携、新製品開発、新製品発売などの様々な戦略的発展を含む競合情勢の全体像で構成されています。
目次
第1章 序文
第2章 エグゼクティブサマリー
- 市場のハイライト
- 世界市場スナップショット
第3章 シリコンフォトニクス:産業分析
- イントロダクション:市場力学
- 市場促進要因
- 市場抑制要因
- 機会
- 業界動向
- ポーターのファイブフォース分析
- 市場魅力度分析
第4章 バリューチェーン分析
- バリューチェーン分析
- 原材料分析
- 原材料リスト
- 原材料メーカーリスト
- 主要原材料の価格動向
- 潜在的バイヤーのリスト
- マーケティングチャネル
- 直接マーケティング
- 間接マーケティング
- 市場開拓動向
第5章 シリコンフォトニクスの世界市場分析:製品別
- 製品別概要
- 実績データと予測データ
- 製品別分析
- トランシーバー
- 可変光減衰器
- スイッチ
- ケーブル
- センサー
第6章 シリコンフォトニクスの世界市場分析:コンポーネント別
- コンポーネント別概要
- 実績データと予測データ
- コンポーネント別分析
- レーザー
- 変調器
- 光検出器
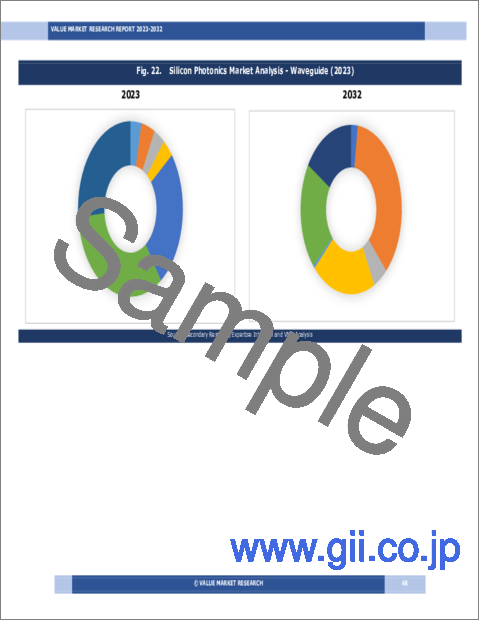
第7章 シリコンフォトニクスの世界市場分析:導波路別
- 導波路別概要
- 実績データと予測データ
- 導波路別分析
- 400-1,500 NM
- 1,310-1,550 NM
- 900-7,000 NM
第8章 シリコンフォトニクスの世界市場分析:アプリケーション別
- 概要:アプリケーション別
- 実績データと予測データ
- 分析:アプリケーション別
- 自動車
- データセンターと高性能コンピューティング
- 通信
- 軍事、防衛、航空宇宙
- 医療およびライフサイエンス
- その他の用途
第9章 シリコンフォトニクスの世界市場分析:地域別
- 地域別展望
- イントロダクション
- 北米の販売分析
- 概要、実績と予測データの販売分析
- 北米セグメント別の販売分析
- 北米:国別の販売分析
- 米国の販売分析
- カナダの販売分析
- メキシコの販売分析
- 欧州の販売分析
- 概要、実績と予測データの販売分析
- 欧州セグメント別の販売分析
- 欧州:国別の販売分析
- 英国の販売分析
- フランスの販売分析
- ドイツの販売分析
- イタリアの販売分析
- ロシアの販売分析
- その他欧州の販売分析
- アジア太平洋地域の販売分析
- 概要、実績と予測データの販売分析
- アジア太平洋地域セグメント別の販売分析
- アジア太平洋:国別の販売分析
- 中国の販売分析
- インドの販売分析
- 日本の販売分析
- 韓国の販売分析
- オーストラリアの販売分析
- その他アジア太平洋地域の販売分析
- ラテンアメリカの販売分析
- 概要、実績と予測データの販売分析
- ラテンアメリカセグメント別の販売分析
- ラテンアメリカ:国別の販売分析
- ブラジルの販売分析
- アルゼンチンの販売分析
- ペルーの販売分析
- チリの販売分析
- その他ラテンアメリカ地域の販売分析
- 中東・アフリカの販売分析
- 概要、実績と予測データの販売分析
- 中東.アフリカセグメント別の販売分析
- 中東.アフリカ:国別の販売分析
- サウジアラビアの販売分析
- UAEの販売分析
- イスラエルの販売分析
- 南アフリカの販売分析
- その他中東とアフリカの販売分析
第10章 シリコンフォトニクス企業の競合情勢
- シリコンフォトニクス市場競合
- 提携・協力・合意
- 合併・買収
- 新製品発表
- その他の開発
第11章 企業プロファイル
- 企業シェア分析
- 市場集中度
- Cisco Systems Inc.(US)
- 会社概要
- 企業収益
- 製品
- 最近の動向
- Intel Corporation(US)
- 会社概要
- 企業収益
- 製品
- 最近の動向
- MACOM Technology Solutions(US)
- 会社概要
- 企業収益
- 製品
- 最近の動向
- GlobalFoundries Inc.(US)
- 会社概要
- 企業収益
- 製品
- 最近の動向
- Lumentum Operations LLC(US)
- 会社概要
- 企業収益
- 製品
- 最近の動向
- Marvell Technology Inc.(US)
- 会社概要
- 企業収益
- 製品
- 最近の動向
- Coherent Corporation(US)
- 会社概要
- 企業収益
- 製品
- 最近の動向
- International Business Machines Corporation(IBM)(US)
- 会社概要
- 企業収益
- 製品
- 最近の動向
- STMicroelectronics N.V.(US)
- 会社概要
- 企業収益
- 製品
- 最近の動向
- Rockley Photonics Holdings Limited(US)
- 会社概要
- 企業収益
- 製品
- 最近の動向
*企業プロファイル、財務情報、直近の開発状況は、非公開会社の場合、入手可能な情報、または掲載されていない場合があります。
LIST OF TABLES
- Market Snapshot
- Drivers : Impact Analysis
- Restraints : Impact Analysis
- List of Raw Material
- List of Raw Material Manufactures
- List of Potential Buyers
- Analysis by Product (USD MN)
- Transceivers Market Sales by Geography (USD MN)
- Variable Optical Attenuators Market Sales by Geography (USD MN)
- Switches Market Sales by Geography (USD MN)
- Cables Market Sales by Geography (USD MN)
- Sensors Market Sales by Geography (USD MN)
- Analysis Market by Component (USD MN)
- Lasers Market Sales by Geography (USD MN)
- Modulators Market Sales by Geography (USD MN)
- Photo Detectors Market Sales by Geography (USD MN)
- Analysis by Waveguide (USD MN)
- 400-1,500 NM Market Sales by Geography (USD MN)
- 1,310-1,550 NM Market Sales by Geography (USD MN)
- 900-7,000 NM Market Sales by Geography (USD MN)
- Analysis by Application (USD MN)
- Automotive Market Sales by Geography (USD MN)
- Data Centre And High-Performance Computing Market Sales by Geography (USD MN)
- Telecommunications Market Sales by Geography (USD MN)
- Military, Defense, And Aerospace Market Sales by Geography (USD MN)
- Medical And Life Sciences Market Sales by Geography (USD MN)
- Other Applications Market Sales by Geography (USD MN)
- Global Silicon Photonics Market Sales by Geography (USD MN)
- North America Market Analysis (USD MN)
- United State Market Analysis (USD MN)
- Canada Market Analysis (USD MN)
- Mexico Market Analysis (USD MN)
- Europe Market Analysis (USD MN)
- Europe Market Estimate by Country (USD MN)
- United Kingdom Market Analysis (USD MN)
- France Market Analysis (USD MN)
- Germany Market Analysis (USD MN)
- Italy Market Analysis (USD MN)
- Russia Market Analysis (USD MN)
- Spain Market Analysis (USD MN)
- Rest of Europe Market Analysis (USD MN)
- Asia Pacific Market Analysis (USD MN)
- China Market Analysis (USD MN)
- Japan Market Analysis (USD MN)
- India Market Analysis (USD MN)
- South Korea Market Analysis (USD MN)
- Australia Market Analysis (USD MN)
- Rest of Asia Pacific Market Analysis (USD MN)
- Latin America Market Analysis (USD MN)
- Brazil Market Analysis (USD MN)
- Argentina Market Analysis (USD MN)
- Peru Market Analysis (USD MN)
- Chile Market Analysis (USD MN)
- Rest of Latin America Market Analysis (USD MN)
- Middle East & Africa Market Analysis (USD MN)
- Saudi Arabia Market Analysis (USD MN)
- UAE Market Analysis (USD MN)
- Israel Market Analysis (USD MN)
- South Africa Market Analysis (USD MN)
- Rest of Middle East and Africa Market Analysis (USD MN)
- Partnership/Collaboration/Agreement
- Mergers And Acquisition
LIST OF FIGURES
- Research Scope of Silicon Photonics
- Market Research Process
- Market Research Methodology
- Global Silicon Photonics Market Size, by Region (USD MN)
- Porters Five Forces Analysis
- Market Attractiveness Analysis by Product
- Market Attractiveness Analysis by Component
- Market Attractiveness Analysis by Waveguide
- Market Attractiveness Analysis by Application
- Market Attractiveness Analysis by Region
- Value Chain Analysis
- Global Market Analysis by Product (USD MN)
- Transceivers Market Sales by Geography (USD MN)
- Variable Optical Attenuators Market Sales by Geography (USD MN)
- Switches Market Sales by Geography (USD MN)
- Cables Market Sales by Geography (USD MN)
- Sensors Market Sales by Geography (USD MN)
- Global Market Analysis by Component (USD MN)
- Lasers Market Sales by Geography (USD MN)
- Modulators Market Sales by Geography (USD MN)
- Photo Detectors Market Sales by Geography (USD MN)
- Global Market Analysis by Waveguide (USD MN)
- 400-1,500 NM Market Sales by Geography (USD MN)
- 1,310-1,550 NM Market Sales by Geography (USD MN)
- 900-7,000 NM Market Sales by Geography (USD MN)
- Global Market Analysis by Application (USD MN)
- Automotive Market Sales by Geography (USD MN)
- Data Centre And High-Performance Computing Market Sales by Geography (USD MN)
- Telecommunications Market Sales by Geography (USD MN)
- Military, Defense, And Aerospace Market Sales by Geography (USD MN)
- Medical And Life Sciences Market Sales by Geography (USD MN)
- Other Applications Market Sales by Geography (USD MN)
- Global Market Sales (USD MN)
- North America Market Sales (USD MN)
- Europe Market Sales (USD MN)
- Asia Pacific Market Sales (USD MN)
- Latin America Market Sales (USD MN)
- Middle East & Africa Market Sales (USD MN)
- Recent Development in Industry
- Top Company Market Share Analysis
Kindly note that the above listed are the basic tables and figures of the and are not limited to the TOC.
The global demand for Silicon Photonics Market is presumed to reach the market size of nearly USD 22.56 BN by 2030 from USD 2.9 BN in 2022 with a CAGR of 29.23% under the study period 2023 - 2030.
Silicon photonics is a technology that integrates optical components and devices, such as light sources, detectors, modulators, and waveguides, onto silicon-based platforms. It combines the fields of photonics and microelectronics, enabling the manipulation and transmission of light using silicon-based materials and fabrication techniques. Traditionally, electronic devices have been based on the manipulation of electrical signals, while photonics focuses on the manipulation of light. This technology bridges the gap between these two domains by leveraging the unique properties of silicon, such as its high refractive index and compatibility with established semiconductor manufacturing processes.
MARKET DYNAMICS:
The increasing high-speed data transmission demand and higher bandwidth due to data-intensive applications, cloud computing, 5G, AI, and IoT are propelling the adoption of silicon photonics. The integration of photonic components with existing silicon-based electronic technologies is a significant driving factor, as it enables improved performance, energy efficiency, and cost-effectiveness compared to traditional photonics technologies. Energy efficiency and lower power consumption are also driving the market, with silicon photonics offering advantages over electrical interconnects in terms of power requirements. Scalability and cost-effectiveness are achieved through the compatibility of this technology with established semiconductor manufacturing processes, facilitating mass production at a lower cost. Ongoing advancements in manufacturing and packaging techniques are further enhancing the performance and reliability of silicon photonics devices, making them more commercially viable.
The research covers Porter's Five Forces Model, Market Attractiveness Analysis, and Value Chain analysis. These tools help to get a clear picture of the industry's structure and evaluate the competition attractiveness at a global level. Additionally, these tools also give an inclusive assessment of each segment in the global market of silicon photonics. The growth and trends of silicon photonics industry provide a holistic approach to this study.
MARKET SEGMENTATION:
This section of the silicon photonics market provides detailed data on the segments at country and regional level, thereby assisting the strategist in identifying the target demographics for the respective product or services with the upcoming opportunities.
By Product
- Transceivers
- Variable Optical Attenuators
- Switches
- Cables
- Sensors
By Component
- Lasers
- Modulators
- Photo Detectors
By Waveguide
- 400-1,500 Nm
- 1,310-1,550 Nm
- 900-7,000 Nm
By Application
- Automotive
- Data Centre And High-Performance Computing
- Telecommunications
- Military, Defense, And Aerospace
- Medical And Life Sciences
- Other Applications
REGIONAL ANALYSIS:
This section covers the regional outlook, which accentuates current and future demand for the Silicon Photonics market across North America, Europe, Asia-Pacific, Latin America, and Middle East & Africa. Further, the focuses on demand, estimation, and forecast for individual application segments across all the prominent regions.
The research also covers the comprehensive profiles of the key players in the market and an in-depth view of the competitive landscape worldwide. The major players in the silicon photonics market include Cisco Systems, Inc. (US), Intel Corporation (US), MACOM Technology Solutions (US), GlobalFoundries Inc. (US), Lumentum Operations LLC (US), Marvell Technology, Inc. (US), Coherent Corporation (US), International Business Machines Corporation (IBM) (US), STMicroelectronics N.V. (US), Rockley Photonics Holdings Limited (US). This section consists of a holistic view of the competitive landscape that includes various strategic developments such as key mergers & acquisitions, future capacities, partnerships, financial overviews, collaborations, new product developments, new product launches, and other developments.
In case you have any custom requirements, do write to us. Our research team can offer a customized as per your need.
TABLE OF CONTENTS
1 . PREFACE
- 1.1. Description
- 1.1.1. Objective
- 1.1.2. Target Audience
- 1.1.3. Unique Selling Proposition (USP) & offerings
- 1.2. Research Scope
- 1.3. Research Methodology
- 1.3.1. Market Research Process
- 1.3.2. Market Research Methodology
2 . EXECUTIVE SUMMARY
- 2.1. Highlights of Market
- 2.2. Global Market Snapshot
3 . SILICON PHOTONICS - INDUSTRY ANALYSIS
- 3.1. Introduction - Market Dynamics
- 3.2. Market Drivers
- 3.3. Market Restraints
- 3.4. Opportunities
- 3.5. Industry Trends
- 3.6. Porter's Five Force Analysis
- 3.7. Market Attractiveness Analysis
- 3.7.1 Market Attractiveness Analysis By Product
- 3.7.2 Market Attractiveness Analysis By Component
- 3.7.3 Market Attractiveness Analysis By Waveguide
- 3.7.4 Market Attractiveness Analysis By Application
- 3.7.5 Market Attractiveness Analysis By Region
4 . VALUE CHAIN ANALYSIS
- 4.1. Value Chain Analysis
- 4.2. Raw Material Analysis
- 4.2.1. List of Raw Materials
- 4.2.2. Raw Material Manufactures List
- 4.2.3. Price Trend of Key Raw Materials
- 4.3. List of Potential Buyers
- 4.4. Marketing Channel
- 4.4.1. Direct Marketing
- 4.4.2. Indirect Marketing
- 4.4.3. Marketing Channel Development Trend
5 . GLOBAL SILICON PHOTONICS MARKET ANALYSIS BY PRODUCT
- 5.1 Overview by Product
- 5.2 Historical and Forecast Data
- 5.3 Analysis by Product
- 5.4 Transceivers Historic and Forecast Sales by Regions
- 5.5 Variable Optical Attenuators Historic and Forecast Sales by Regions
- 5.6 Switches Historic and Forecast Sales by Regions
- 5.7 Cables Historic and Forecast Sales by Regions
- 5.8 Sensors Historic and Forecast Sales by Regions
6 . GLOBAL SILICON PHOTONICS MARKET ANALYSIS BY COMPONENT
- 6.1 Overview by Component
- 6.2 Historical and Forecast Data
- 6.3 Analysis by Component
- 6.4 Lasers Historic and Forecast Sales by Regions
- 6.5 Modulators Historic and Forecast Sales by Regions
- 6.6 Photo Detectors Historic and Forecast Sales by Regions
7 . GLOBAL SILICON PHOTONICS MARKET ANALYSIS BY WAVEGUIDE
- 7.1 Overview by Waveguide
- 7.2 Historical and Forecast Data
- 7.3 Analysis by Waveguide
- 7.4 400-1,500 NM Historic and Forecast Sales by Regions
- 7.5 1,310-1,550 NM Historic and Forecast Sales by Regions
- 7.6 900-7,000 NM Historic and Forecast Sales by Regions
8 . GLOBAL SILICON PHOTONICS MARKET ANALYSIS BY APPLICATION
- 8.1 Overview by Application
- 8.2 Historical and Forecast Data
- 8.3 Analysis by Application
- 8.4 Automotive Historic and Forecast Sales by Regions
- 8.5 Data Centre And High-Performance Computing Historic and Forecast Sales by Regions
- 8.6 Telecommunications Historic and Forecast Sales by Regions
- 8.7 Military, Defense, And Aerospace Historic and Forecast Sales by Regions
- 8.8 Medical And Life Sciences Historic and Forecast Sales by Regions
- 8.9 Other Applications Historic and Forecast Sales by Regions
9 . GLOBAL SILICON PHOTONICS MARKET ANALYSIS BY GEOGRAPHY
- 9.1. Regional Outlook
- 9.2. Introduction
- 9.3. North America Sales Analysis
- 9.3.1. Overview, Historic and Forecast Data Sales Analysis
- 9.3.2. North America By Segment Sales Analysis
- 9.3.3. North America By Country Sales Analysis
- 9.3.4. United State Sales Analysis
- 9.3.5. Canada Sales Analysis
- 9.3.6. Mexico Sales Analysis
- 9.4. Europe Sales Analysis
- 9.4.1. Overview, Historic and Forecast Data Sales Analysis
- 9.4.2. Europe by Segment Sales Analysis
- 9.4.3. Europe by Country Sales Analysis
- 9.4.4. United Kingdom Sales Analysis
- 9.4.5. France Sales Analysis
- 9.4.6. Germany Sales Analysis
- 9.4.7. Italy Sales Analysis
- 9.4.8. Russia Sales Analysis
- 9.4.9. Rest Of Europe Sales Analysis
- 9.5. Asia Pacific Sales Analysis
- 9.5.1. Overview, Historic and Forecast Data Sales Analysis
- 9.5.2. Asia Pacific by Segment Sales Analysis
- 9.5.3. Asia Pacific by Country Sales Analysis
- 9.5.4. China Sales Analysis
- 9.5.5. India Sales Analysis
- 9.5.6. Japan Sales Analysis
- 9.5.7. South Korea Sales Analysis
- 9.5.8. Australia Sales Analysis
- 9.5.9. Rest Of Asia Pacific Sales Analysis
- 9.6. Latin America Sales Analysis
- 9.6.1. Overview, Historic and Forecast Data Sales Analysis
- 9.6.2. Latin America by Segment Sales Analysis
- 9.6.3. Latin America by Country Sales Analysis
- 9.6.4. Brazil Sales Analysis
- 9.6.5. Argentina Sales Analysis
- 9.6.6. Peru Sales Analysis
- 9.6.7. Chile Sales Analysis
- 9.6.8. Rest of Latin America Sales Analysis
- 9.7. Middle East & Africa Sales Analysis
- 9.7.1. Overview, Historic and Forecast Data Sales Analysis
- 9.7.2. Middle East & Africa by Segment Sales Analysis
- 9.7.3. Middle East & Africa by Country Sales Analysis
- 9.7.4. Saudi Arabia Sales Analysis
- 9.7.5. UAE Sales Analysis
- 9.7.6. Israel Sales Analysis
- 9.7.7. South Africa Sales Analysis
- 9.7.8. Rest Of Middle East And Africa Sales Analysis
10 . COMPETITIVE LANDSCAPE OF THE SILICON PHOTONICS COMPANIES
- 10.1. Silicon Photonics Market Competition
- 10.2. Partnership/Collaboration/Agreement
- 10.3. Merger And Acquisitions
- 10.4. New Product Launch
- 10.5. Other Developments
11 . COMPANY PROFILES OF SILICON PHOTONICS INDUSTRY
- 11.1. Company Share Analysis
- 11.2. Market Concentration Rate
- 11.3. Cisco Systems Inc. (US)
- 11.3.1. Company Overview
- 11.3.2. Company Revenue
- 11.3.3. Products
- 11.3.4. Recent Developments
- 11.4. Intel Corporation (US)
- 11.4.1. Company Overview
- 11.4.2. Company Revenue
- 11.4.3. Products
- 11.4.4. Recent Developments
- 11.5. MACOM Technology Solutions (US)
- 11.5.1. Company Overview
- 11.5.2. Company Revenue
- 11.5.3. Products
- 11.5.4. Recent Developments
- 11.6. GlobalFoundries Inc. (US)
- 11.6.1. Company Overview
- 11.6.2. Company Revenue
- 11.6.3. Products
- 11.6.4. Recent Developments
- 11.7. Lumentum Operations LLC (US)
- 11.7.1. Company Overview
- 11.7.2. Company Revenue
- 11.7.3. Products
- 11.7.4. Recent Developments
- 11.8. Marvell Technology Inc. (US)
- 11.8.1. Company Overview
- 11.8.2. Company Revenue
- 11.8.3. Products
- 11.8.4. Recent Developments
- 11.9. Coherent Corporation (US)
- 11.9.1. Company Overview
- 11.9.2. Company Revenue
- 11.9.3. Products
- 11.9.4. Recent Developments
- 11.10. International Business Machines Corporation (IBM) (US)
- 11.10.1. Company Overview
- 11.10.2. Company Revenue
- 11.10.3. Products
- 11.10.4. Recent Developments
- 11.11. STMicroelectronics N.V. (US)
- 11.11.1. Company Overview
- 11.11.2. Company Revenue
- 11.11.3. Products
- 11.11.4. Recent Developments
- 11.12. Rockley Photonics Holdings Limited (US)
- 11.12.1. Company Overview
- 11.12.2. Company Revenue
- 11.12.3. Products
- 11.12.4. Recent Developments