|
|
市場調査レポート
商品コード
1778884
ジェネリック医薬品市場- 世界の産業規模、シェア、動向、機会、予測、タイプ別、用途別、ドラッグデリバリー別、形態別、供給源別、流通チャネル別、地域別、競合別、2020~2030年予測Generic Drugs Market - Global Industry Size, Share, Trends, Opportunity, and Forecast, Segmented By Type, By Application, By Drug Delivery, By Form, By Source, By Distribution Channel, By Region and Competition, 2020-2030F |
||||||
|
|||||||
カスタマイズ可能
|
|||||||

| ジェネリック医薬品市場- 世界の産業規模、シェア、動向、機会、予測、タイプ別、用途別、ドラッグデリバリー別、形態別、供給源別、流通チャネル別、地域別、競合別、2020~2030年予測 |
|
出版日: 2025年07月29日
発行: TechSci Research
ページ情報: 英文 185 Pages
納期: 2~3営業日
|

全表示
- 概要
- 目次
ジェネリック医薬品の世界市場規模は2024年に4,434億4,000万米ドルとなり、予測期間では2030年までCAGR 6.27%で安定した成長が予測されています。
ジェネリック医薬品の世界市場は、慢性疾患の増加、ヘルスケアコストの増加、手頃な治療オプションの必要性など、いくつかの主要な要因によって牽引されています。ジェネリック医薬品は、先発医薬品に代わる費用対効果の高い選択肢を提供し、より多くの人々が利用できるようにします。先発医薬品の特許が切れると、ジェネリック医薬品メーカーが市場に参入する機会が生まれ、競争が激化して価格が下がります。医療費削減のためにジェネリック医薬品の使用を促進する政府の取り組みは、市場の成長をさらに後押しします。生物製剤のジェネリック医薬品に対する需要の高まりや、新興市場におけるジェネリック医薬品製造能力の拡大も市場拡大に寄与しています。世界のジェネリック医薬品市場は、手頃な価格、入手しやすさ、市場競争によって持続的な成長が見込まれています。ジェネリック医薬品とバイオシミラーが米国のヘルスケア支出全体に占める割合はわずか1.2%であり、その費用対効果の高さが際立っています。
| 市場概要 | |
|---|---|
| 予測期間 | 2026~2030年 |
| 市場規模:2024年 | 4,434億4,000万米ドル |
| 市場規模:2030年 | 6,408億8,000万米ドル |
| CAGR:2025~2030年 | 6.27% |
| 急成長セグメント | 低分子ジェネリック医薬品 |
| 最大市場 | 北米 |
市場促進要因
費用対効果と手頃な価格
市場課題
規制上のハードルと承認プロセス
主要市場動向
ジェネリック生物製剤(バイオシミラー)の進歩
目次
第1章 概要
第2章 調査手法
第3章 エグゼクティブサマリー
第4章 顧客の声
第5章 世界のジェネリック医薬品市場展望
- 市場規模・予測
- 金額別
- 市場シェア・予測
- タイプ別(低分子ジェネリック医薬品、バイオシミラー)
- 用途別(心血管疾患、糖尿病、神経学、腫瘍学、抗炎症疾患、その他)
- ドラッグデリバリー(経口、局所、非経口、その他)
- 形態別(錠剤、カプセル剤、注射剤、その他)
- 供給源別(社内と契約製造組織)
- 流通チャネル別(病院薬局、小売薬局、オンライン薬局、その他)
- 地域別
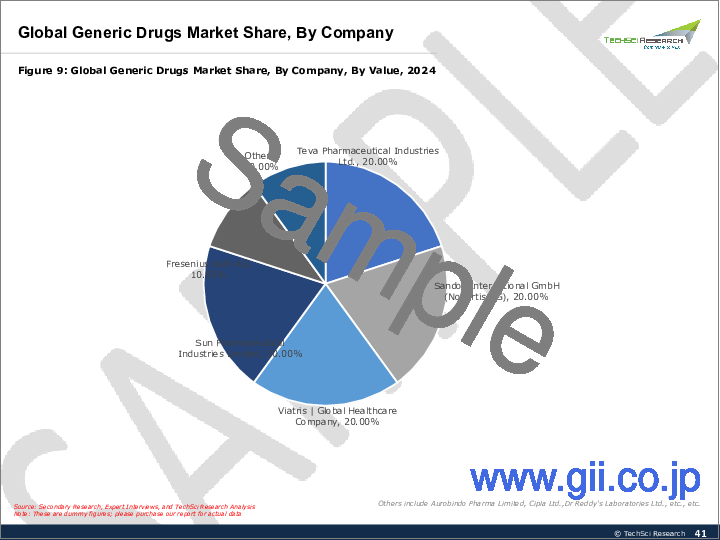
- 企業別(2024年)
- 市場マップ
第6章 北米のジェネリック医薬品市場展望
- 市場規模・予測
- 市場シェア・予測
- 北米:国別分析
- 米国
- カナダ
- メキシコ
第7章 欧州のジェネリック医薬品市場展望
- 市場規模・予測
- 市場シェア・予測
- 欧州:国別分析
- ドイツ
- 英国
- イタリア
- フランス
- スペイン
第8章 アジア太平洋のジェネリック医薬品市場展望
- 市場規模・予測
- 市場シェア・予測
- アジア太平洋:国別分析
- 中国
- インド
- 日本
- 韓国
- オーストラリア
第9章 南米のジェネリック医薬品市場展望
- 市場規模・予測
- 市場シェア・予測
- 南米:国別分析
- ブラジル
- アルゼンチン
- コロンビア
第10章 中東・アフリカのジェネリック医薬品市場展望
- 市場規模・予測
- 市場シェア・予測
- 中東・アフリカ:国別分析
- 南アフリカ
- サウジアラビア
- アラブ首長国連邦
第11章 市場力学
- 促進要因
- 課題
第12章 市場動向と発展
- 合併と買収
- 製品上市
第13章 ポーターのファイブフォース分析
- 産業内の競合
- 新規参入の可能性
- サプライヤーの力
- 顧客の力
- 代替品の脅威
第14章 競合情勢
- Teva Pharmaceutical Industries Ltd.
- Sandoz International GmbH
- Viatris Inc.
- Sun Pharmaceutical Industries Ltd.
- Fresenius Kabi AG
- STADA Arzneimittel AG
- Aurobindo Pharma Limited
- Dr Reddy's Laboratories Ltd.
- Cipla Ltd.
- Novo Nordisk A/S
- Abbott Laboratories Inc.
- Endo International plc
- Sanofi S.A.
- Aspen Pharmacare Holdings Limited
- Lupin Limited
第15章 戦略的提言
第16章 調査会社について・免責事項
Global Generic Drugs Market was valued at USD 443.44 Billion in 2024 and is anticipated to project steady growth in the forecast period with a CAGR of 6.27% through 2030. The Global Generic Drugs Market is primarily driven by several key factors, including the rising prevalence of chronic diseases, increasing healthcare costs, and the need for affordable treatment options. Generic drugs offer a cost-effective alternative to brand-name medications, making them accessible to a broader population. Patent expirations of branded drugs create opportunities for generic manufacturers to enter the market, leading to increased competition and lower prices. Government initiatives promoting the use of generic drugs to reduce healthcare expenditures further fuel market growth. The growing demand for generic versions of biologic drugs and the expansion of generic drug manufacturing capabilities in emerging markets also contribute to the market's expansion. The Global Generic Drugs Market is poised for sustained growth driven by affordability, accessibility, and market competition. Generics and biosimilars represent just 1.2% of total U.S. healthcare spending, underscoring their cost-effectiveness.
| Market Overview | |
|---|---|
| Forecast Period | 2026-2030 |
| Market Size 2024 | USD 443.44 Billion |
| Market Size 2030 | USD 640.88 Billion |
| CAGR 2025-2030 | 6.27% |
| Fastest Growing Segment | Small Molecule Generics |
| Largest Market | North America |
Key Market Drivers
Cost-effectiveness and Affordability
The affordability and accessibility of generic drugs compared to their brand-name counterparts constitute a pivotal factor driving their widespread adoption and market expansion on a global scale. Generic medications, renowned for their lower price points, serve as indispensable alternatives for patients and healthcare systems grappling with constrained budgets or exorbitant out-of-pocket expenses associated with branded pharmaceuticals. In regions where healthcare resources are scarce or where patients bear a substantial burden of medication costs, the cost-effectiveness of generic drugs emerges as a cornerstone of healthcare provision. The considerable price differentials between generic and brand-name medications facilitate broader access to essential treatments, ensuring that individuals can afford the medications they need to manage their health conditions effectively.
A fundamental driver of the cost-effectiveness of generic drugs lies in the expiration of patents on brand-name medications. Upon patent expiry, generic manufacturers gain the legal right to produce and distribute equivalent versions of the drug, igniting competition within the pharmaceutical market. This competitive landscape fosters price reductions as generic manufacturers leverage economies of scale, streamlined production processes, and reduced research and development costs to offer their products at significantly lower prices.
Key Market Challenges
Regulatory Hurdles and Approval Processes
One of the primary challenges confronting the Global Generic Drugs Market is navigating the complex regulatory landscape governing generic drug approval processes. Regulatory agencies worldwide, including the U.S. Food and Drug Administration (FDA), the European Medicines Agency (EMA), and others, enforce stringent standards and requirements for the approval of generic medications. Generic manufacturers must demonstrate bioequivalence, pharmaceutical equivalence, and therapeutic equivalence to the reference brand-name drug through comprehensive analytical and clinical studies. The regulatory pathway for generic drug approval often entails navigating intricate legal frameworks, conducting extensive pharmacokinetic and pharmacodynamic studies, and adhering to stringent quality assurance standards, all of which pose formidable barriers to entry for manufacturers. Disparities in regulatory requirements between different regions and countries necessitate meticulous compliance with diverse regulatory mandates, adding complexity and uncertainty to the generic drug approval process.
Key Market Trends
Advancements in Generic Biologics (Biosimilars)
The emergence of biosimilars heralds a transformative paradigm shift within the pharmaceutical landscape, ushering in a new era of accessibility, affordability, and innovation in biologic drug therapy. Biosimilars, colloquially referred to as generic versions of biologic drugs, constitute a rapidly burgeoning segment of the generic drugs market, poised to revolutionize the treatment landscape across a diverse array of therapeutic domains. This paradigmatic evolution is underpinned by significant advancements in biotechnology and regulatory frameworks governing biosimilar approval, which collectively catalyze the development, commercialization, and widespread adoption of biosimilar therapies as compelling alternatives to their costly brand-name counterparts. In 2023, the average out-of-pocket cost for a generic drug was USD 7.05, compared to $27.10 for a brand-name drug.
The ascendancy of biosimilars as a burgeoning force within the generic drugs market is predicated upon the intricate interplay between scientific innovation and regulatory harmonization. Pioneering breakthroughs in biotechnological methodologies have empowered manufacturers to elucidate the complex structural and functional attributes of biologic drugs with unparalleled precision and fidelity, thereby facilitating the rational design and engineering of biosimilar formulations that closely mimic the reference biologic products. Leveraging state-of-the-art analytical techniques, manufacturers can meticulously characterize the physicochemical properties, pharmacokinetic profiles, and immunogenicity profiles of biosimilars, ensuring their comparability to the reference biologic drugs with utmost rigor and scientific rigor.
Key Market Players
- Teva Pharmaceutical Industries Ltd.
- Sandoz International GmbH
- Viatris Inc.
- Sun Pharmaceutical Industries Ltd.
- Fresenius Kabi AG
- STADA Arzneimittel AG
- Aurobindo Pharma Limited
- Dr Reddy's Laboratories Ltd.
- Cipla Ltd.
- Novo Nordisk A/S
- Abbott Laboratories Inc.
- Endo International plc
- Sanofi S.A.
- Aspen Pharmacare Holdings Limited
- Lupin Limited
Report Scope:
In this report, the Global Generic Drugs Market has been segmented into the following categories, in addition to the industry trends which have also been detailed below:
Generic Drugs Market, By Type:
- Small Molecule Generics
- Biosimilars
Generic Drugs Market, By Application:
- Cardiovascular Diseases
- Diabetes
- Neurology
- Oncology
- Anti-Inflammatory Diseases
- Others
Generic Drugs Market, By Drug Delivery:
- Oral
- Topical
- Parenteral
- Others
Generic Drugs Market, By Form:
- Tablet
- Capsule
- Injection
- Others
Generic Drugs Market, By Source:
- In House
- Contract Manufacturing Organizations
Generic Drugs Market, By Distribution Channel:
- Hospital Pharmacies
- Retail Pharmacies
- Online Pharmacies
- Others
Generic Drugs Market, By Region:
- North America
- United States
- Canada
- Mexico
- Europe
- France
- United Kingdom
- Italy
- Germany
- Spain
- Asia-Pacific
- China
- India
- Japan
- Australia
- South Korea
- South America
- Brazil
- Argentina
- Colombia
- Middle East & Africa
- South Africa
- Saudi Arabia
- UAE
Competitive Landscape
Company Profiles: Detailed analysis of the major companies present in the Global Generic Drugs Market.
Available Customizations:
Global Generic Drugs market report with the given market data, TechSci Research offers customizations according to a company's specific needs. The following customization options are available for the report:
Company Information
- Detailed analysis and profiling of additional market players (up to five).
Table of Contents
1. Product Overview
- 1.1. Market Definition
- 1.2. Scope of the Market
- 1.2.1. Markets Covered
- 1.2.2. Years Considered for Study
- 1.2.3. Key Market Segmentations
2. Research Methodology
- 2.1. Objective of the Study
- 2.2. Baseline Methodology
- 2.3. Key Industry Partners
- 2.4. Major Association and Secondary Sources
- 2.5. Forecasting Methodology
- 2.6. Data Triangulation & Validations
- 2.7. Assumptions and Limitations
3. Executive Summary
- 3.1. Overview of the Market
- 3.2. Overview of Key Market Segmentations
- 3.3. Overview of Key Market Players
- 3.4. Overview of Key Regions/Countries
- 3.5. Overview of Market Drivers, Challenges, Trends
4. Voice of Customer
5. Global Generic Drugs Market Outlook
- 5.1. Market Size & Forecast
- 5.1.1. By Value
- 5.2. Market Share & Forecast
- 5.2.1. By Type (Small Molecule Generics and Biosimilars)
- 5.2.2. By Application (Cardiovascular Diseases, Diabetes, Neurology, Oncology, Anti-Inflammatory Diseases, Others)
- 5.2.3. By Drug Delivery (Oral, Topical, Parenteral, Others)
- 5.2.4. By Form (Tablet, Capsule, Injection, Others)
- 5.2.5. By Source (In House and Contract Manufacturing Organizations)
- 5.2.6. By Distribution Channel (Hospital Pharmacies, Retail Pharmacies, Online Pharmacies, Others)
- 5.2.7. By Region
- 5.2.8. By Company (2024)
- 5.3. Market Map
6. North America Generic Drugs Market Outlook
- 6.1. Market Size & Forecast
- 6.1.1. By Value
- 6.2. Market Share & Forecast
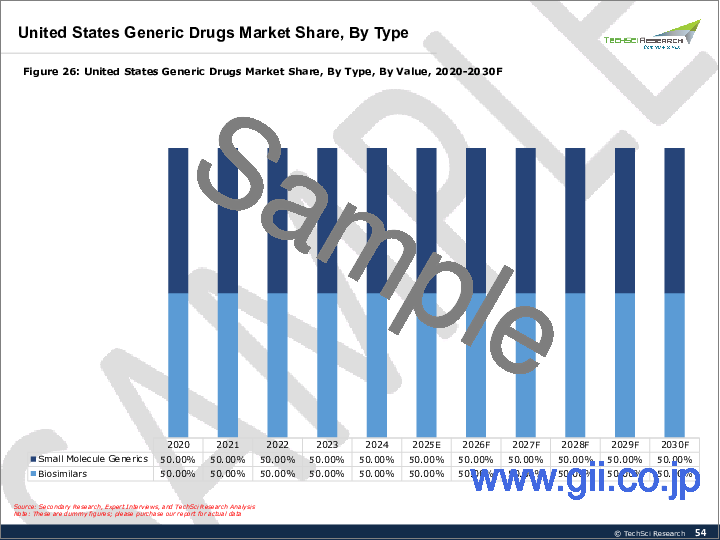
- 6.2.1. By Type
- 6.2.2. By Application
- 6.2.3. By Drug Delivery
- 6.2.4. By Form
- 6.2.5. By Source
- 6.2.6. By Distribution Channel
- 6.2.7. By Country
- 6.3. North America: Country Analysis
- 6.3.1. United States Generic Drugs Market Outlook
- 6.3.1.1. Market Size & Forecast
- 6.3.1.1.1. By Value
- 6.3.1.2. Market Share & Forecast
- 6.3.1.2.1. By Type
- 6.3.1.2.2. By Application
- 6.3.1.2.3. By Drug Delivery
- 6.3.1.2.4. By Form
- 6.3.1.2.5. By Source
- 6.3.1.2.6. By Distribution Channel
- 6.3.1.1. Market Size & Forecast
- 6.3.2. Canada Generic Drugs Market Outlook
- 6.3.2.1. Market Size & Forecast
- 6.3.2.1.1. By Value
- 6.3.2.2. Market Share & Forecast
- 6.3.2.2.1. By Type
- 6.3.2.2.2. By Application
- 6.3.2.2.3. By Drug Delivery
- 6.3.2.2.4. By Form
- 6.3.2.2.5. By Source
- 6.3.2.2.6. By Distribution Channel
- 6.3.2.1. Market Size & Forecast
- 6.3.3. Mexico Generic Drugs Market Outlook
- 6.3.3.1. Market Size & Forecast
- 6.3.3.1.1. By Value
- 6.3.3.2. Market Share & Forecast
- 6.3.3.2.1. By Type
- 6.3.3.2.2. By Application
- 6.3.3.2.3. By Drug Delivery
- 6.3.3.2.4. By Form
- 6.3.3.2.5. By Source
- 6.3.3.2.6. By Distribution Channel
- 6.3.3.1. Market Size & Forecast
- 6.3.1. United States Generic Drugs Market Outlook
7. Europe Generic Drugs Market Outlook
- 7.1. Market Size & Forecast
- 7.1.1. By Value
- 7.2. Market Share & Forecast
- 7.2.1. By Type
- 7.2.2. By Application
- 7.2.3. By Drug Delivery
- 7.2.4. By Form
- 7.2.5. By Source
- 7.2.6. By Distribution Channel
- 7.2.7. By Country
- 7.3. Europe: Country Analysis
- 7.3.1. Germany Generic Drugs Market Outlook
- 7.3.1.1. Market Size & Forecast
- 7.3.1.1.1. By Value
- 7.3.1.2. Market Share & Forecast
- 7.3.1.2.1. By Type
- 7.3.1.2.2. By Application
- 7.3.1.2.3. By Drug Delivery
- 7.3.1.2.4. By Form
- 7.3.1.2.5. By Source
- 7.3.1.2.6. By Distribution Channel
- 7.3.1.1. Market Size & Forecast
- 7.3.2. United Kingdom Generic Drugs Market Outlook
- 7.3.2.1. Market Size & Forecast
- 7.3.2.1.1. By Value
- 7.3.2.2. Market Share & Forecast
- 7.3.2.2.1. By Type
- 7.3.2.2.2. By Application
- 7.3.2.2.3. By Drug Delivery
- 7.3.2.2.4. By Form
- 7.3.2.2.5. By Source
- 7.3.2.2.6. By Distribution Channel
- 7.3.2.1. Market Size & Forecast
- 7.3.3. Italy Generic Drugs Market Outlook
- 7.3.3.1. Market Size & Forecast
- 7.3.3.1.1. By Value
- 7.3.3.2. Market Share & Forecasty
- 7.3.3.2.1. By Type
- 7.3.3.2.2. By Application
- 7.3.3.2.3. By Drug Delivery
- 7.3.3.2.4. By Form
- 7.3.3.2.5. By Source
- 7.3.3.2.6. By Distribution Channel
- 7.3.3.1. Market Size & Forecast
- 7.3.4. France Generic Drugs Market Outlook
- 7.3.4.1. Market Size & Forecast
- 7.3.4.1.1. By Value
- 7.3.4.2. Market Share & Forecast
- 7.3.4.2.1. By Type
- 7.3.4.2.2. By Application
- 7.3.4.2.3. By Drug Delivery
- 7.3.4.2.4. By Form
- 7.3.4.2.5. By Source
- 7.3.4.2.6. By Distribution Channel
- 7.3.4.1. Market Size & Forecast
- 7.3.5. Spain Generic Drugs Market Outlook
- 7.3.5.1. Market Size & Forecast
- 7.3.5.1.1. By Value
- 7.3.5.2. Market Share & Forecast
- 7.3.5.2.1. By Type
- 7.3.5.2.2. By Application
- 7.3.5.2.3. By Drug Delivery
- 7.3.5.2.4. By Form
- 7.3.5.2.5. By Source
- 7.3.5.2.6. By Distribution Channel
- 7.3.5.1. Market Size & Forecast
- 7.3.1. Germany Generic Drugs Market Outlook
8. Asia-Pacific Generic Drugs Market Outlook
- 8.1. Market Size & Forecast
- 8.1.1. By Value
- 8.2. Market Share & Forecast
- 8.2.1. By Type
- 8.2.2. By Application
- 8.2.3. By Drug Delivery
- 8.2.4. By Form
- 8.2.5. By Source
- 8.2.6. By Distribution Channel
- 8.2.7. By Country
- 8.3. Asia-Pacific: Country Analysis
- 8.3.1. China Generic Drugs Market Outlook
- 8.3.1.1. Market Size & Forecast
- 8.3.1.1.1. By Value
- 8.3.1.2. Market Share & Forecast
- 8.3.1.2.1. By Type
- 8.3.1.2.2. By Application
- 8.3.1.2.3. By Drug Delivery
- 8.3.1.2.4. By Form
- 8.3.1.2.5. By Source
- 8.3.1.2.6. By Distribution Channel
- 8.3.1.1. Market Size & Forecast
- 8.3.2. India Generic Drugs Market Outlook
- 8.3.2.1. Market Size & Forecast
- 8.3.2.1.1. By Value
- 8.3.2.2. Market Share & Forecast
- 8.3.2.2.1. By Type
- 8.3.2.2.2. By Application
- 8.3.2.2.3. By Drug Delivery
- 8.3.2.2.4. By Form
- 8.3.2.2.5. By Source
- 8.3.2.2.6. By Distribution Channel
- 8.3.2.1. Market Size & Forecast
- 8.3.3. Japan Generic Drugs Market Outlook
- 8.3.3.1. Market Size & Forecast
- 8.3.3.1.1. By Value
- 8.3.3.2. Market Share & Forecast
- 8.3.3.2.1. By Type
- 8.3.3.2.2. By Application
- 8.3.3.2.3. By Drug Delivery
- 8.3.3.2.4. By Form
- 8.3.3.2.5. By Source
- 8.3.3.2.6. By Distribution Channel
- 8.3.3.1. Market Size & Forecast
- 8.3.4. South Korea Generic Drugs Market Outlook
- 8.3.4.1. Market Size & Forecast
- 8.3.4.1.1. By Value
- 8.3.4.2. Market Share & Forecast
- 8.3.4.2.1. By Type
- 8.3.4.2.2. By Application
- 8.3.4.2.3. By Drug Delivery
- 8.3.4.2.4. By Form
- 8.3.4.2.5. By Source
- 8.3.4.2.6. By Distribution Channel
- 8.3.4.1. Market Size & Forecast
- 8.3.5. Australia Generic Drugs Market Outlook
- 8.3.5.1. Market Size & Forecast
- 8.3.5.1.1. By Value
- 8.3.5.2. Market Share & Forecast
- 8.3.5.2.1. By Type
- 8.3.5.2.2. By Application
- 8.3.5.2.3. By Drug Delivery
- 8.3.5.2.4. By Form
- 8.3.5.2.5. By Source
- 8.3.5.2.6. By Distribution Channel
- 8.3.5.1. Market Size & Forecast
- 8.3.1. China Generic Drugs Market Outlook
9. South America Generic Drugs Market Outlook
- 9.1. Market Size & Forecast
- 9.1.1. By Value
- 9.2. Market Share & Forecast
- 9.2.1. By Type
- 9.2.2. By Application
- 9.2.3. By Drug Delivery
- 9.2.4. By Form
- 9.2.5. By Source
- 9.2.6. By Distribution Channel
- 9.2.7. By Country
- 9.3. South America: Country Analysis
- 9.3.1. Brazil Generic Drugs Market Outlook
- 9.3.1.1. Market Size & Forecast
- 9.3.1.1.1. By Value
- 9.3.1.2. Market Share & Forecast
- 9.3.1.2.1. By Type
- 9.3.1.2.2. By Application
- 9.3.1.2.3. By Drug Delivery
- 9.3.1.2.4. By Form
- 9.3.1.2.5. By Source
- 9.3.1.2.6. By Distribution Channel
- 9.3.1.1. Market Size & Forecast
- 9.3.2. Argentina Generic Drugs Market Outlook
- 9.3.2.1. Market Size & Forecast
- 9.3.2.1.1. By Value
- 9.3.2.2. Market Share & Forecast
- 9.3.2.2.1. By Type
- 9.3.2.2.2. By Application
- 9.3.2.2.3. By Drug Delivery
- 9.3.2.2.4. By Form
- 9.3.2.2.5. By Source
- 9.3.2.2.6. By Distribution Channel
- 9.3.2.1. Market Size & Forecast
- 9.3.3. Colombia Generic Drugs Market Outlook
- 9.3.3.1. Market Size & Forecast
- 9.3.3.1.1. By Value
- 9.3.3.2. Market Share & Forecast
- 9.3.3.2.1. By Type
- 9.3.3.2.2. By Application
- 9.3.3.2.3. By Drug Delivery
- 9.3.3.2.4. By Form
- 9.3.3.2.5. By Source
- 9.3.3.2.6. By Distribution Channel
- 9.3.3.1. Market Size & Forecast
- 9.3.1. Brazil Generic Drugs Market Outlook
10. Middle East and Africa Generic Drugs Market Outlook
- 10.1. Market Size & Forecast
- 10.1.1. By Value
- 10.2. Market Share & Forecast
- 10.2.1. By Type
- 10.2.2. By Application
- 10.2.3. By Drug Delivery
- 10.2.4. By Form
- 10.2.5. By Source
- 10.2.6. By Distribution Channel
- 10.2.7. By Country
- 10.3. MEA: Country Analysis
- 10.3.1. South Africa Generic Drugs Market Outlook
- 10.3.1.1. Market Size & Forecast
- 10.3.1.1.1. By Value
- 10.3.1.2. Market Share & Forecast
- 10.3.1.2.1. By Type
- 10.3.1.2.2. By Application
- 10.3.1.2.3. By Drug Delivery
- 10.3.1.2.4. By Form
- 10.3.1.2.5. By Source
- 10.3.1.2.6. By Distribution Channel
- 10.3.1.1. Market Size & Forecast
- 10.3.2. Saudi Arabia Generic Drugs Market Outlook
- 10.3.2.1. Market Size & Forecast
- 10.3.2.1.1. By Value
- 10.3.2.2. Market Share & Forecast
- 10.3.2.2.1. By Type
- 10.3.2.2.2. By Application
- 10.3.2.2.3. By Drug Delivery
- 10.3.2.2.4. By Form
- 10.3.2.2.5. By Source
- 10.3.2.2.6. By Distribution Channel
- 10.3.2.1. Market Size & Forecast
- 10.3.3. UAE Generic Drugs Market Outlook
- 10.3.3.1. Market Size & Forecast
- 10.3.3.1.1. By Value
- 10.3.3.2. Market Share & Forecast
- 10.3.3.2.1. By Type
- 10.3.3.2.2. By Application
- 10.3.3.2.3. By Drug Delivery
- 10.3.3.2.4. By Form
- 10.3.3.2.5. By Source
- 10.3.3.2.6. By Distribution Channel
- 10.3.3.1. Market Size & Forecast
- 10.3.1. South Africa Generic Drugs Market Outlook
11. Market Dynamics
- 11.1. Drivers
- 11.2. Challenges
12. Market Trends & Developments
- 12.1. Merger & Acquisition (If Any)
- 12.2. Product Launches (If Any)
- 12.3. Recent Developments
13. Porter's Five Forces Analysis
- 13.1. Competition in the Industry
- 13.2. Potential of New Entrants
- 13.3. Power of Suppliers
- 13.4. Power of Customers
- 13.5. Threat of Substitute Products
14. Competitive Landscape
- 14.1. Teva Pharmaceutical Industries Ltd.
- 14.1.1. Business Overview
- 14.1.2. Company Snapshot
- 14.1.3. Products & Services
- 14.1.4. Financials (As Reported)
- 14.1.5. Recent Developments
- 14.1.6. Key Personnel Details
- 14.1.7. SWOT Analysis
- 14.2. Sandoz International GmbH
- 14.3. Viatris Inc.
- 14.4. Sun Pharmaceutical Industries Ltd.
- 14.5. Fresenius Kabi AG
- 14.6. STADA Arzneimittel AG
- 14.7. Aurobindo Pharma Limited
- 14.8. Dr Reddy's Laboratories Ltd.
- 14.9. Cipla Ltd.
- 14.10. Novo Nordisk A/S
- 14.11. Abbott Laboratories Inc.
- 14.12. Endo International plc
- 14.13. Sanofi S.A.
- 14.14. Aspen Pharmacare Holdings Limited
- 14.15. Lupin Limited