|
|
市場調査レポート
商品コード
1379535
スマートポート市場-世界の産業規模、シェア、動向、機会、予測:技術別、処理能力別、港湾技術別、地域別、競合、2018~2028年Smart Port Market - Global Industry Size, Share, Trends, Opportunity, and Forecast Segmented By Technology, By Throughput Capacity, By Port Technology, By Region, Competition 2018-2028 |
||||||
|
|
|||||||
カスタマイズ可能
|
|||||||


| スマートポート市場-世界の産業規模、シェア、動向、機会、予測:技術別、処理能力別、港湾技術別、地域別、競合、2018~2028年 |
|
出版日: 2023年10月03日
発行: TechSci Research
ページ情報: 英文 190 Pages
納期: 2~3営業日
|

- 全表示
- 概要
- 目次
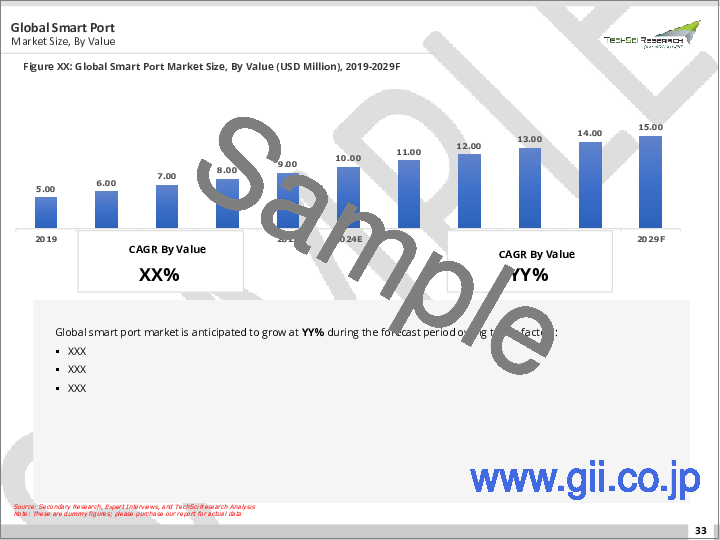
スマートポートの世界市場規模は2022年に12億5,000万米ドルとなり、2028年までのCAGRは12.36%で、予測期間中に力強い成長が予測されています。
スマートポートとは、デジタル技術と革新的なソリューションを活用して、船舶交通管理、貨物処理、セキュリティ、環境持続可能性、物流など、港湾運営のさまざまな側面を改善する港湾のことです。これには、モノのインターネット(IoT)センサー、人工知能(AI)、データ分析、自動化、ブロックチェーン、通信ネットワークなど、プロセスを合理化し意思決定を強化するために港湾業務に適用される幅広い技術やソリューションが含まれます。スマートポートの狙いは、リソースの利用を最適化し、混雑を緩和し、遅延を最小限に抑え、港を経由する商品やサービスの全体的な流れを改善し、コスト削減と生産性向上につなげることにあります。セキュリティ対策の強化は、テロ、密輸、サイバー攻撃などさまざまな脅威から港湾を守るために極めて重要です。スマートポートでは、高度な監視システム、生体認証、入退室管理などを駆使してセキュリティを強化しています。スマート港湾はまた、設備の電化、排出ガス監視、再生可能エネルギー源の利用など、環境に配慮した技術や慣行を導入することで、環境フットプリントの削減にも注力しています。スマートポート市場の港湾は、海運会社、物流プロバイダー、税関当局などを含む港湾利害関係者間のリアルタイムのデータ共有とコラボレーションを可能にするデジタルプラットフォームとシステムを通じて相互接続されています。
主な市場促進要因
人工知能(AI)、モノのインターネット(IoT)技術の採用
| 市場概要 | |
|---|---|
| 予測期間 | 2024~2028年 |
| 2022年の市場規模 | 12億5,000万米ドル |
| 2028年の市場規模 | 32億5,000万米ドル |
| CAGR 2023~2028年 | 12.36% |
| 急成長セグメント | 海港 |
| 最大市場 | アジア太平洋 |
人工知能(AI)、モノのインターネット(IoT)、ブロックチェーン、プロセス自動化など複数の技術が、従来の港湾をスマート港湾に変えるために利用されています。これらの技術は、従来のインフラをデジタル化されたものに変えるために、個別に、あるいは組み合わせて導入されます。スマート港湾は、従来の港湾と比較して、人為的な混乱の減少、運用経費の制限、インテリジェントな意思決定、より予測可能なパフォーマンスなど、いくつかの利点を提供します。これらの利点はすべて、生産性の向上につながり、港湾4.0の展望を切り開くものです。
海上輸送の進歩
海上輸送は国際貿易にとって極めて重要です。国連貿易開発会議(UNCTAD)によれば、国際貿易量の約80%は海上輸送によるものであり、ほとんどの発展途上国ではその割合はさらに高くなっています。この輸送チャネルは、道路、鉄道、航空輸送よりも安価で、国際貿易の実現可能性が高いです。UNCTADによると、世界の海上貿易は2021年度に4.1%成長し、2022年から2026年までは年率2.4%以上の緩やかな成長率でさらに拡大すると予想されています。世界の海運船隊の成長も同様の動向を示し、2021年には3.0%増となっています。2021年の海上貿易は、在庫の積み増しや在庫の積み増しだけでなく、溜まりに溜まった需要の掘り起こしによって回復しました。また、消費パターンがサービスからモノへとシフトし、典型的なものとしては健康用品や医薬品、家庭用事務機器などがあり、ショッピングパターンの変化やeコマース部門の拡大もあっています。パンデミックによる2020年の厳しい状況の後、2021年に需要が急激に高まった結果、船腹やコンテナ、設備が不足しました。いくつかの船主は、この需給ギャップを埋めるために、新造船の調達や改造船の利用に頼っています。アジア太平洋は近年、豊富な原材料と労働力を背景に、世界の製造拠点として台頭してきました。そのため、この地域では、製造品や原材料の輸出の増加により、コンテナ船の需要が著しく高いです。また、UNCTAD Review of Maritime Transport 2021によると、アジアは世界の海上貿易の54%という驚異的なシェアを占めており、今後も増加することが予想され、港湾活動の需要を牽引します。したがって、海上貿易活動の増加がスマートポート市場の需要を促進します。
主な市場課題
実装とメンテナンスの高コスト
先進技術の導入と維持にかかるコストの高さは、スマートポート市場にとって重要な課題です。スマートポートは、リアルタイムの情報を提供し、オペレーションを最適化するために、IoTセンサー、ビッグデータ分析、自動化などのデジタル技術に大きく依存しています。しかし、これらの技術は、特に小規模な港湾や発展途上国の港湾にとっては、導入と維持にコストがかかる可能性があります。
先進技術のコストは、多くの港湾事業者にとって参入の大きな障壁となっています。例えば、IoTセンサーを導入するには、ハードウェアやソフトウェアに多額の投資を行い、高度なデータ分析機能を開発する必要があります。同様に、自律走行車やロボットなどの自動化技術を導入するには、設備やインフラに多額の投資が必要となります。
主な市場動向
エコ技術と持続可能な実践の採用増加
環境に優しい技術や持続可能な手法の採用が増加していることは、スマートポート市場に大きな機会をもたらしています。海運業界は、世界の二酸化炭素排出量の約3%を占めるなど、世界の温室効果ガス排出に大きく貢献しています。その結果、海運業界は環境への影響を削減し、より持続可能な慣行へと移行する必要に迫られています。
スマート・ポートは、環境フットプリントを減少させる持続可能な慣行やエコ技術を採用することで、この好機から利益を得る有利な立場にあります。これには、太陽光発電や風力発電などの再生可能エネルギーの採用、エネルギー効率の高い照明や空調システムの導入、電気自動車やハイブリッド車の採用などが含まれます。
リアルタイム情報とサプライチェーンの可視性に対する需要の広がり
リアルタイムの情報とサプライチェーンの可視性に対する需要の高まりは、スマートポート市場の重要な促進要因です。世界の貿易量の増加が続く中、サプライチェーンはますます複雑化しており、商品や設備の動きに関するタイムリーで正確なデータが不可欠となっています。スマートポートは、IoTセンサー、ビッグデータ分析、自動化などの先進技術を採用してこのようなリアルタイム情報を提供し、港湾事業者が業務を最適化してコストを削減できるようにします。リアルタイム情報は、企業が問題を迅速に特定して解決し、サプライチェーン全体の効率を向上させるのに役立つため、効果的なサプライチェーン管理には不可欠です。スマート・ポートは、貨物の動き、在庫レベル、設備の位置などに関するリアルタイムのデータを提供し、港湾事業者がリアルタイムで業務を監視・管理できるようにします。
セグメント別洞察
技術別洞察
プロセスオートメーション分野は、2022年の世界収益シェアの30%以上を占めました。また、このセグメントは予測期間中に大幅なCAGRを記録すると予測されています。自動化プロセスを支援するためのソフトウェア導入が、各港湾で人気を集めています。人間の介入を制限し、それによって重要な業務に集中するため、港湾当局は、船舶の請求書発行や港のゲート操作を含む冗長な作業のために、ソフトウェア支援ロボットの配備を増やしています。自動化の程度は、検討中の作業/業務によって異なり、プロセス自動化ソフトウェアと複数の技術の統合が必要になることもあります。しかし、プロセス・オートメーションは、それ自体が独立した技術として、ドック・オペレーターに計り知れない成長機会を提供しています。
技術・セグメントには、ブロックチェーン、IoT、AIといった他の技術も含まれます。港湾では、ドッキング作業に関連する膨大な量の定量データや事務作業が発生します。技術の導入は、ドック業務を簡素化するだけでなく、長期的にはコスト削減にもつながります。例えば、スマートセンサーを使用することで、港湾当局は各資産の性能をリアルタイムで評価し、必要なときにいつでも予防保全措置を講じることができ、それによって運営コストを削減することができます。
処理能力別洞察
2022年のスマート港湾市場では、処理能力の高い港湾が45%以上の収益シェアを占め、最大のシェアを占めています。1,800万TEU以上の処理能力を持つ港湾がこのセグメントに含まれます。多忙を極める港湾のシェアが急上昇している主な理由は、その港湾容量と処理される業務数であり、そのため当局は業務効率を達成するためにある程度の自動化を導入する必要に迫られています。さらに、これらの港湾は実質的に高収益をあげているため、自動化への投資を容易に行うことができます。
その他のセグメントには、中程度の繁忙港とほとんど繁忙のない港があります。処理能力が500万TEUから1,800万TEUの港湾は「中程度に忙しい港湾」、500万TEU以下の港湾は「ほとんど忙しくない港湾」に分類されます。予測期間中、最も導入が見込まれるのは「中程度に忙しい」港湾セグメントです。かなりの投資能力があり、オペレーションの数が少ないため、技術統合に伴う複雑さが少ないことが、このセグメントの成長を促進すると予想されます。
地域別洞察
アジア太平洋は、2022年に大きな収益シェアを占め、世界のスマートポート市場のリーダーとしての地位を確立しています。アジア太平洋は市場を独占し、2022年の世界収益シェアの35%以上を占めています。この地域は、高い処理能力を持つ主要港の存在によって特徴付けられ、それによって世界最大のシェアに貢献しています。中国、日本、韓国、シンガポールなどの国々は、大量の貿易活動を伴う主要な貿易拠点として認識されています。前述の要因は、特に台湾や中国を含む国々から比較的低コストで技術を入手できることと相まって、この地域の力強い成長を確実なものにしています。
目次
第1章 サービス概要
- 市場の定義
- 市場の範囲
- 対象市場
- 調査対象年
- 主要市場セグメンテーション
第2章 調査手法
第3章 エグゼクティブサマリー
第4章 顧客の声
第5章 スマートポートの世界市場展望
- 市場規模と予測
- 金額別
- 市場シェアと予測
- 技術別(プロセス自動化、ブロックチェーン、モノのインターネット(IoT)、人工知能(AI))
- 処理能力別(かなり混雑、中程度、ほとんど混雑していない)
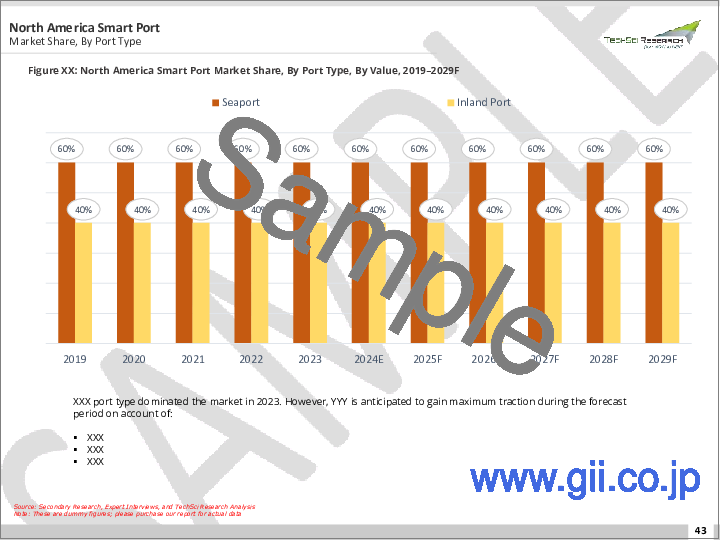
- 港湾技術別(海港・内港)
- 地域別
- 企業別(2022年)
- 市場マップ
第6章 北米のスマートポート市場展望
- 市場規模・予測
- 金額別
- 市場シェアと予測
- 技術別
- 処理能力別
- 港湾技術別
- 国別
- 北米:国別分析
- 米国
- カナダ
- メキシコ
第7章 アジア太平洋のスマートポート市場展望
- 市場規模・予測
- 金額別
- 市場シェアと予測
- 技術別
- 処理能力別
- 港湾技術別
- 国別
- アジア太平洋:国別分析
- 中国
- インド
- 日本
- 韓国
- インドネシア
第8章 欧州のスマートポート市場展望
- 市場規模・予測
- 金額別
- 市場シェアと予測
- 技術別
- 処理能力別
- 港湾技術別
- 国別
- 欧州:国別分析
- ドイツ
- 英国
- フランス
- ロシア
- スペイン
第9章 南米のスマートポート市場展望
- 市場規模・予測
- 金額別
- 市場シェアと予測
- 技術別
- 処理能力別
- 港湾技術別
- 国別
- 南米:国別分析
- ブラジル
- アルゼンチン
第10章 中東・アフリカのスマートポート市場展望
- 市場規模・予測
- 金額別
- 市場シェアと予測
- 技術別
- 処理能力別
- 港湾技術別
- 国別
- 中東・アフリカ:国別分析
- サウジアラビア
- 南アフリカ
- アラブ首長国連邦
- イスラエル
- エジプト
第11章 市場力学
- 促進要因
- 課題
第12章 市場動向と発展
第13章 企業プロファイル
- ROYAL HASKONINGDHV
- ABB
- Trelleborg AB
- Accenture
- PORT OF ROTTERDAM
- Ramboll Group A/S
- Abu Dhabi Ports
- IBM
- Navis
- Awake.AI
第14章 戦略的提言
第15章 調査会社について・免責事項
Global Smart Port Market has valued at USD 1.25 Billion in 2022 and is anticipated to project robust growth in the forecast period with a CAGR of 12.36 % through 2028. A smart port is a seaport or harbor that utilizes digital technologies and innovative solutions to improve various aspects of its operations, including but not limited to vessel traffic management, cargo handling, security, environmental sustainability, and logistics. This encompasses a wide range of technologies and solutions, such as Internet of Things (IoT) sensors, artificial intelligence (AI), data analytics, automation, blockchain, and communication networks, which are applied to port operations to streamline processes and enhance decision-making. Smart ports aim to optimize the use of resources, reduce congestion, minimize delays, and improve the overall flow of goods and services through the port, leading to cost savings and improved productivity. Enhanced security measures are crucial for protecting ports from various threats, including terrorism, smuggling, and cyberattacks. Smart ports use advanced surveillance systems, biometrics, and access control to bolster security. Smart ports also focus on reducing their environmental footprint by implementing green technologies and practices, such as electrification of equipment, emissions monitoring, and the use of renewable energy sources. Ports in the smart port market are interconnected through digital platforms and systems that enable real-time data sharing and collaboration among port stakeholders, including shipping companies, logistics providers, customs authorities, and more.
Key Market Drivers
Adoption of Artificial Intelligence (AI), Internet of Things (IoT) Technologies
| Market Overview | |
|---|---|
| Forecast Period | 2024-2028 |
| Market Size 2022 | USD 1.25 Billion |
| Market Size 2028 | USD 3.25 Billion |
| CAGR 2023-2028 | 12.36% |
| Fastest Growing Segment | Seaport |
| Largest Market | Asia-Pacific |
Several technologies including Artificial Intelligence (AI), Internet of Things (IoT), blockchain, and process automation are used for transforming a traditional port into a smart port. These technologies are either deployed separately or in combination to transform the conventional infrastructure into a digitalized one. The smart port offers several benefits over traditional port including reduced human-related disruptions, limited operational expenses, intelligent decision making, and more predictable performance. All these benefits offered results in increased productivity thereby paving the way for a sighted vision of Port 4.0.
Besides these benefits, growing technological innovation and resulting ease in technology integration are increasing the uptake of smart technologies across all types of ports. National and international trade through maritime transport has significantly increased over the years. Benefits such as lower transportation costs have resulted in the growing preference for marine transport. The rise in global trade activities worldwide has increased the burden on shipyards and decks. An increase in the number of operations has forced the harbor authorities to embrace smart technologies and solutions for automating several harbor operations. The outbreak of the COVID-19 pandemic and resulting lockdowns imposed to contain the spread of the virus has put a heavy burden on the industries that are highly dependent on the workforce for conducting operations, and the marine industry is no exception. The unavailability of the workforce at full potential has necessitated harbor authorities to embrace automation. The pandemic, therefore, is envisaged as a catalyst in the development of smart ports.
Growing advancements in Maritime transport
Maritime transport is crucial for international trade. The main transport mode for global trade is ocean shipping, and as per UNCTAD, around 80% of the volume of international trade in goods is carried by sea, and the percentage is even higher for most developing countries. This channel of transport is cheaper and more feasible for international trade than the road, rail, and air transport. According to UNCTAD, global maritime trade grew by 4.1% in the fiscal year 2021 and is expected to further swell at a moderate annual rate of more than 2.4% from 2022 to 2026. The growth of the global shipping fleet showed similar trends, and it grew by 3.0% in 2021. Maritime trade bounced back in 2021 owing to the unlocking of pent-up demand, as well as restocking and building inventory. There was also a shift in consumption patterns away from services toward goods, typically health products and pharmaceuticals, as well as home office equipment, along with changes in shopping patterns and the expansion of the e-commerce sector. The sudden boost in demand in 2021 after the grim situation in 2020 due to the pandemic resulted in shortages of shipping capacity and containers and equipment. Several shipowners are resorting to procuring newbuild or using retrofitted vessels to bridge this demand-supply gap. Asia Pacific has emerged as a global manufacturing hub in recent times, owing to its wealth of raw materials and manpower. Thus, the demand for container ships is significantly high in this region, owing to an increase in the export of manufactured and raw goods. Also, according to the UNCTAD Review of Maritime Transport 2021, Asia accounted for a staggering 54% share of the global maritime trade, which is expected to increase, driving the demand for port activities. Therefore, increasing maritime trade activities to drive demand for smart port market.
Key Market Challenges
High cost of implementation and maintenance
The high cost of implementing and maintaining advanced technologies is a significant challenge for the smart port market. Smart ports rely heavily on digital technologies like IoT sensors, big data analytics, and automation to provide real-time information and optimize operations. However, these technologies can be costly to implement and maintain, particularly for smaller ports or those in developing countries.
The cost of advanced technologies is a major barrier to entry for many port operators. For instance, implementing IoT sensors requires significant investments in hardware, and software, and developing sophisticated data analytics capabilities. Likewise, introducing automation technologies such as autonomous vehicles and robotics requires substantial investments in equipment and infrastructure.
Key Market Trends
Increasing adoption of green technologies and sustainable practices
The increasing adoption of green technologies and sustainable practices presents a significant opportunity for the smart port market. The shipping industry is a significant contributor to global greenhouse gas emissions, accounting for around 3% of global carbon dioxide emissions. As a result, the industry is under mounting pressure to reduce its environmental impact and transition towards more sustainable practices.
Smart ports are in a favorable position to benefit from this opportunity by adopting sustainable practices and green technologies that decrease their environmental footprint. This includes the adoption of renewable energy sources such as solar and wind power, implementing energy-efficient lighting and HVAC systems, and embracing electric and hybrid vehicles.
Spreading demand for real-time information and supply chain visibility
The increasing demand for real-time information and supply chain visibility is a significant driver for the smart port market. As global trade volumes continue to rise, supply chains are becoming increasingly complex, and timely and accurate data on the movement of goods and equipment is essential. Smart ports employ advanced technologies like IoT sensors, big data analytics, and automation to provide this real-time information, enabling port operators to optimize their operations and reduce costs. Real-time information is critical for effective supply chain management as it helps businesses quickly identify and resolve issues, improving the overall efficiency of the supply chain. Smart ports offer real-time data on cargo movement, inventory levels, and equipment location, among other factors, allowing port operators to monitor and manage their operations in real-time.
Segmental Insights
Technology Insights
The process automation segment accounted for more than 30% of the global revenue share in 2022. The segment is also forecasted to register a substantial CAGR during the forecast period. The deployment of could-based software to assist the automation process is gaining traction across ports. To limit human intervention and thereby focus on critical operational tasks, port authorities are increasingly deploying software-assisted robots for redundant tasks including ship invoicing and port gate operations. The degree of automation depends on the task/operation under consideration, which may sometimes involve the integration of multiple technologies with process automation software. However, process automation, as a separate standalone technology itself offers immense growth opportunities for dock operators.
The technology segment also includes other technologies such as blockchain, IoT, and AI. The Port generates a humongous amount of quantitative data and paperwork related to docking operations. The implementation of technology will not only simplify dock operations but also save costs in a longer run. For instance, using smart sensors, harbor authorities can assess the performance of each asset in real-time, undertake preventive maintenance measures whenever required, and thereby reduce the operating costs.
Throughput Capacity Insights
The extensively busy segment accounted for the largest share in the smart port market with more than 45% revenue share in 2022. Ports that have a throughput capacity of over 18 million TEU are included in this segment. The primary reason for the soaring share of extensively busy ports is their capacity and the number of operations processed, which has been compelling authorities to implement some level of automation for attaining operational efficiency. Further, these ports generate substantially high revenues, enabling them to easily invest in automation.
The other segments include moderately busy and scarcely busy ports. The ports that involve a throughput capacity of 5 to 18 million Twenty-foot Equivalent Unit (TEU) are classified under moderately busy and those that involve below 5 million TEU capacity; are classified under scarcely busy port segment. The moderately busy segment is anticipated to witness the highest adoption over the forecast period. The considerable investment capacity coupled with a lesser number of operations and therefore less complexity involved in technology integration is expected to propel the segment growth.
Regional Insights
The Asia Pacific region has established itself as the leader in the Global Smart Port Market with a significant revenue share in 2022. Asia Pacific dominated the market and accounted for more than 35% of the global revenue share in 2022. The region is characterized by the presence of major ports with high throughput capacity, thereby contributing to the largest share worldwide. Countries such as China, Japan, South Korea, and Singapore are the major countries recognized as prime trading points involving large amounts of trade activities. The aforementioned factors coupled with the availability of technologies at a relatively lower cost, especially from countries including Taiwan and China has ensured strong growth in the region. .
Key Market Players
- Cavagna Group
- ROYAL HASKONINGDHV
- ABB
- Trelleborg AB
- Accenture
- PORT OF ROTTERDAM
- Ramboll Group A/S
- Abu Dhabi Ports
- IBM
- Navis
- Awake.AI
Report Scope:
In this report, the Global Smart Port Market has been segmented into the following categories, in addition to the industry trends which have also been detailed below:
Global Smart Port Market, By Technology:
- Process Automation
- Blockchain
- Internet of Things (IoT)
- Artificial Intelligence (AI)
Global Smart Port Market, By Throughput Capacity:
- Extensively Busy
- Moderately Busy
- Scarcely Busy
Global Smart Port Market, By Port Technology:
- Seaport
- Inland Port
Global Smart Port Market, By Region:
- North America
- United States
- Canada
- Mexico
- Asia-Pacific
- China
- India
- Japan
- South Korea
- Indonesia
- Europe
- Germany
- United Kingdom
- France
- Russia
- Spain
- South America
- Brazil
- Argentina
- Middle East & Africa
- Saudi Arabia
- South Africa
- Egypt
- UAE
- Israel
Competitive Landscape
- Company Profiles: Detailed analysis of the major companies present in the Global Smart Port Market.
Available Customizations:
- Global Smart Port Market report with the given market data, Tech Sci Research offers customizations according to a company's specific needs. The following customization options are available for the report:
Company Information
- Detailed analysis and profiling of additional market players (up to five).
Table of Contents
1. Service Overview
- 1.1. Market Definition
- 1.2. Scope of the Market
- 1.3. Markets Covered
- 1.4. Years Considered for Study
- 1.5. Key Market Segmentations
2. Research Methodology
- 2.1. Objective of the Study
- 2.2. Baseline Methodology
- 2.3. Key Industry Partners
- 2.4. Major Association and Secondary Sources
- 2.5. Forecasting Methodology
- 2.6. Data Triangulation & Validation
- 2.7. Assumptions and Limitations
3. Executive Summary
4. Voice of Customers
5. Global Smart Port Market Outlook
- 5.1. Market Size & Forecast
- 5.1.1. By Value
- 5.2. Market Share & Forecast
- 5.2.1. By Technology (Process Automation, Blockchain, Internet of Things (IoT), Artificial Intelligence (AI))
- 5.2.2. By Throughput Capacity (Extensively Busy, Moderately Busy, Scarcely Busy)
- 5.2.3. By Port Technology (Seaport & Inland Port)
- 5.2.4. By Region
- 5.3. By Company (2022)
- 5.4. Market Map
6. North America Smart Port Market Outlook
- 6.1. Market Size & Forecast
- 6.1.1. By Value
- 6.2. Market Share & Forecast
- 6.2.1. By Technology
- 6.2.2. By Throughput Capacity
- 6.2.3. By Port Technology
- 6.2.4. By Country
- 6.3. North America: Country Analysis
- 6.3.1. United States Smart Port Market Outlook
- 6.3.1.1. Market Size & Forecast
- 6.3.1.1.1. By Value
- 6.3.1.2. Market Share & Forecast
- 6.3.1.2.1. By Technology
- 6.3.1.2.2. By Throughput Capacity
- 6.3.1.2.3. By Port Technology
- 6.3.1.1. Market Size & Forecast
- 6.3.2. Canada Smart Port Market Outlook
- 6.3.2.1. Market Size & Forecast
- 6.3.2.1.1. By Value
- 6.3.2.2. Market Share & Forecast
- 6.3.2.2.1. By Technology
- 6.3.2.2.2. By Throughput Capacity
- 6.3.2.2.3. By Port Technology
- 6.3.2.1. Market Size & Forecast
- 6.3.3. Mexico Smart Port Market Outlook
- 6.3.3.1. Market Size & Forecast
- 6.3.3.1.1. By Value
- 6.3.3.2. Market Share & Forecast
- 6.3.3.2.1. By Technology
- 6.3.3.2.2. By Throughput Capacity
- 6.3.3.2.3. By Port Technology
- 6.3.3.1. Market Size & Forecast
- 6.3.1. United States Smart Port Market Outlook
7. Asia-Pacific Smart Port Market Outlook
- 7.1. Market Size & Forecast
- 7.1.1. By Value
- 7.2. Market Share & Forecast
- 7.2.1. By Technology
- 7.2.2. By Throughput Capacity
- 7.2.3. By Port Technology
- 7.2.4. By Country
- 7.3. Asia-Pacific: Country Analysis
- 7.3.1. China Smart Port Market Outlook
- 7.3.1.1. Market Size & Forecast
- 7.3.1.1.1. By Value
- 7.3.1.2. Market Share & Forecast
- 7.3.1.2.1. By Technology
- 7.3.1.2.2. By Throughput Capacity
- 7.3.1.2.3. By Port Technology
- 7.3.1.1. Market Size & Forecast
- 7.3.2. India Smart Port Market Outlook
- 7.3.2.1. Market Size & Forecast
- 7.3.2.1.1. By Value
- 7.3.2.2. Market Share & Forecast
- 7.3.2.2.1. By Technology
- 7.3.2.2.2. By Throughput Capacity
- 7.3.2.2.3. By Port Technology
- 7.3.2.1. Market Size & Forecast
- 7.3.3. Japan Smart Port Market Outlook
- 7.3.3.1. Market Size & Forecast
- 7.3.3.1.1. By Value
- 7.3.3.2. Market Share & Forecast
- 7.3.3.2.1. By Technology
- 7.3.3.2.2. By Throughput Capacity
- 7.3.3.2.3. By Port Technology
- 7.3.3.1. Market Size & Forecast
- 7.3.4. South Korea Smart Port Market Outlook
- 7.3.4.1. Market Size & Forecast
- 7.3.4.1.1. By Value
- 7.3.4.2. Market Share & Forecast
- 7.3.4.2.1. By Technology
- 7.3.4.2.2. By Throughput Capacity
- 7.3.4.2.3. By Port Technology
- 7.3.4.1. Market Size & Forecast
- 7.3.5. Indonesia Smart Port Market Outlook
- 7.3.5.1. Market Size & Forecast
- 7.3.5.1.1. By Value
- 7.3.5.2. Market Share & Forecast
- 7.3.5.2.1. By Technology
- 7.3.5.2.2. By Throughput Capacity
- 7.3.5.2.3. By Port Technology
- 7.3.5.1. Market Size & Forecast
- 7.3.1. China Smart Port Market Outlook
8. Europe Smart Port Market Outlook
- 8.1. Market Size & Forecast
- 8.1.1. By Value
- 8.2. Market Share & Forecast
- 8.2.1. By Technology
- 8.2.2. By Throughput Capacity
- 8.2.3. By Port Technology
- 8.2.4. By Country
- 8.3. Europe: Country Analysis
- 8.3.1. Germany Smart Port Market Outlook
- 8.3.1.1. Market Size & Forecast
- 8.3.1.1.1. By Value
- 8.3.1.2. Market Share & Forecast
- 8.3.1.2.1. By Technology
- 8.3.1.2.2. By Throughput Capacity
- 8.3.1.2.3. By Port Technology
- 8.3.1.1. Market Size & Forecast
- 8.3.2. United Kingdom Smart Port Market Outlook
- 8.3.2.1. Market Size & Forecast
- 8.3.2.1.1. By Value
- 8.3.2.2. Market Share & Forecast
- 8.3.2.2.1. By Technology
- 8.3.2.2.2. By Throughput Capacity
- 8.3.2.2.3. By Port Technology
- 8.3.2.1. Market Size & Forecast
- 8.3.3. France Smart Port Market Outlook
- 8.3.3.1. Market Size & Forecast
- 8.3.3.1.1. By Value
- 8.3.3.2. Market Share & Forecast
- 8.3.3.2.1. By Technology
- 8.3.3.2.2. By Throughput Capacity
- 8.3.3.2.3. By Port Technology
- 8.3.3.1. Market Size & Forecast
- 8.3.4. Russia Smart Port Market Outlook
- 8.3.4.1. Market Size & Forecast
- 8.3.4.1.1. By Value
- 8.3.4.2. Market Share & Forecast
- 8.3.4.2.1. By Equipment Technology
- 8.3.4.2.2. By Reactor Technology
- 8.3.4.1. Market Size & Forecast
- 8.3.5. Spain Smart Port Market Outlook
- 8.3.5.1. Market Size & Forecast
- 8.3.5.1.1. By Value
- 8.3.5.2. Market Share & Forecast
- 8.3.5.2.1. By Technology
- 8.3.5.2.2. By Throughput Capacity
- 8.3.5.2.3. By Port Technology
- 8.3.5.1. Market Size & Forecast
- 8.3.1. Germany Smart Port Market Outlook
9. South America Smart Port Market Outlook
- 9.1. Market Size & Forecast
- 9.1.1. By Value
- 9.2. Market Share & Forecast
- 9.2.1. By Technology
- 9.2.2. By Throughput Capacity
- 9.2.3. By Port Technology
- 9.2.4. By Country
- 9.3. South America: Country Analysis
- 9.3.1. Brazil Smart Port Market Outlook
- 9.3.1.1. Market Size & Forecast
- 9.3.1.1.1. By Value
- 9.3.1.2. Market Share & Forecast
- 9.3.1.2.1. By Technology
- 9.3.1.2.2. By Throughput Capacity
- 9.3.1.2.3. By Port Technology
- 9.3.1.1. Market Size & Forecast
- 9.3.2. Argentina Smart Port Market Outlook
- 9.3.2.1. Market Size & Forecast
- 9.3.2.1.1. By Value
- 9.3.2.2. Market Share & Forecast
- 9.3.2.2.1. By Technology
- 9.3.2.2.2. By Throughput Capacity
- 9.3.2.2.3. By Port Technology
- 9.3.2.1. Market Size & Forecast
- 9.3.1. Brazil Smart Port Market Outlook
10. Middle East & Africa Smart Port Market Outlook
- 10.1. Market Size & Forecast
- 10.1.1. By Value
- 10.2. Market Share & Forecast
- 10.2.1. By Technology
- 10.2.2. By Throughput Capacity
- 10.2.3. By Port Technology
- 10.2.4. By Country
- 10.3. Middle East & Africa: Country Analysis
- 10.3.1. Saudi Arabia Smart Port Market Outlook
- 10.3.1.1. Market Size & Forecast
- 10.3.1.1.1. By Value
- 10.3.1.2. Market Share & Forecast
- 10.3.1.2.1. By Technology
- 10.3.1.2.2. By Throughput Capacity
- 10.3.1.2.3. By Port Technology
- 10.3.1.1. Market Size & Forecast
- 10.3.2. South Africa Smart Port Market Outlook
- 10.3.2.1. Market Size & Forecast
- 10.3.2.1.1. By Value
- 10.3.2.2. Market Share & Forecast
- 10.3.2.2.1. By Technology
- 10.3.2.2.2. By Throughput Capacity
- 10.3.2.2.3. By Port Technology
- 10.3.2.1. Market Size & Forecast
- 10.3.3. UAE Smart Port Market Outlook
- 10.3.3.1. Market Size & Forecast
- 10.3.3.1.1. By Value
- 10.3.3.2. Market Share & Forecast
- 10.3.3.2.1. By Technology
- 10.3.3.2.2. By Throughput Capacity
- 10.3.3.2.3. By Port Technology
- 10.3.3.1. Market Size & Forecast
- 10.3.4. Israel Smart Port Market Outlook
- 10.3.4.1. Market Size & Forecast
- 10.3.4.1.1. By Value
- 10.3.4.2. Market Share & Forecast
- 10.3.4.2.1. By Technology
- 10.3.4.2.2. By Throughput Capacity
- 10.3.4.2.3. By Port Technology
- 10.3.4.1. Market Size & Forecast
- 10.3.5. Egypt Smart Port Market Outlook
- 10.3.5.1. Market Size & Forecast
- 10.3.5.1.1. By Value
- 10.3.5.2. Market Share & Forecast
- 10.3.5.2.1. By Technology
- 10.3.5.2.2. By Throughput Capacity
- 10.3.5.2.3. By Port Technology
- 10.3.5.1. Market Size & Forecast
- 10.3.1. Saudi Arabia Smart Port Market Outlook
11. Market Dynamics
- 11.1. Drivers
- 11.2. Challenge
12. Market Trends & Developments
13. Company Profiles
- 13.1. ROYAL HASKONINGDHV.
- 13.1.1. Business Overview
- 13.1.2. Key Revenue and Financials
- 13.1.3. Recent Developments
- 13.1.4. Key Personnel
- 13.1.5. Key Product/Services
- 13.2. ABB.
- 13.2.1. Business Overview
- 13.2.2. Key Revenue and Financials
- 13.2.3. Recent Developments
- 13.2.4. Key Personnel
- 13.2.5. Key Product/Services
- 13.3. Trelleborg AB.
- 13.3.1. Business Overview
- 13.3.2. Key Revenue and Financials
- 13.3.3. Recent Developments
- 13.3.4. Key Personnel
- 13.3.5. Key Product/Services
- 13.4. Accenture.
- 13.4.1. Business Overview
- 13.4.2. Key Revenue and Financials
- 13.4.3. Recent Developments
- 13.4.4. Key Personnel
- 13.4.5. Key Product/Services
- 13.5. PORT OF ROTTERDAM.
- 13.5.1. Business Overview
- 13.5.2. Key Revenue and Financials
- 13.5.3. Recent Developments
- 13.5.4. Key Personnel
- 13.5.5. Key Product/Services
- 13.6. Ramboll Group A/S.
- 13.6.1. Business Overview
- 13.6.2. Key Revenue and Financials
- 13.6.3. Recent Developments
- 13.6.4. Key Personnel
- 13.6.5. Key Product/Services
- 13.7. Abu Dhabi Ports.
- 13.7.1. Business Overview
- 13.7.2. Key Revenue and Financials
- 13.7.3. Recent Developments
- 13.7.4. Key Personnel
- 13.7.5. Key Product/Services
- 13.8. IBM.
- 13.8.1. Business Overview
- 13.8.2. Key Revenue and Financials
- 13.8.3. Recent Developments
- 13.8.4. Key Personnel
- 13.8.5. Key Product/Services
- 13.9. Navis.
- 13.9.1. Business Overview
- 13.9.2. Key Revenue and Financials
- 13.9.3. Recent Developments
- 13.9.4. Key Personnel
- 13.9.5. Key Product/Services
- 13.10. Awake.AI.
- 13.10.1. Business Overview
- 13.10.2. Key Revenue and Financials
- 13.10.3. Recent Developments
- 13.10.4. Key Personnel
- 13.10.5. Key Product/Services
14. Strategic Recommendations
15. About Us & Disclaimer
