|
|
市場調査レポート
商品コード
1764963
欧州の価格設定ソフトウェア市場の2031年までの予測-地域別分析-タイプ別、企業規模別、産業別Europe Pricing Software Market Forecast to 2031 - Regional Analysis - by Type, Enterprise Size, and Industry Vertical |
||||||

|
|||||||
|
|||||||


| 欧州の価格設定ソフトウェア市場の2031年までの予測-地域別分析-タイプ別、企業規模別、産業別 |
|
出版日: 2025年04月14日
発行: The Insight Partners
ページ情報: 英文 183 Pages
納期: 即納可能
|

全表示
- 概要
- 図表
- 目次
欧州の価格設定ソフトウェア市場は、2023年に3億5,411万米ドルと評価され、2031年には8億1,667万米ドルに達すると予測され、2023~2031年にかけて11.0%のCAGRを記録すると予測されています。
製造業の継続的成長が欧州の価格設定ソフトウェア市場を牽引
ここ数年、工業化の進展により、製造業は生産高、製造企業の総数、製造部門のデジタル化動向の面で大きく拡大しています。例えば、国連が2023年に発表したデータによると、2015年の世界の製造業の生産指数は100であったが、2019年の指数は113に達しました。2021年第3四半期、世界の製造業指数は117に達しました。2023年、世界の製造業指数は120ポイントを超えました。自動車産業は、ここ数年力強い成長率を示している世界的に注目すべき産業の一つです。2023年に国際自動車工業会が発表したデータによると、2021年の自動車総生産台数は8,000万台だったが、2023年には9,300万台に増加しました。このような統計は、ここ数年の世界の製造業生産高の増加を示しています。このような製造業の成長は、競争上の優位性を獲得するためのツールの重要性を高め、最終的に価格最適化・管理ソフトウェアの需要を促進しています。
欧州の価格設定ソフトウェア市場概要
欧州のでは、BFSIを含むさまざまな産業でデジタル化が進んでいます。欧州のほぼすべての有名銀行がデジタルトランスフォーメーション戦略を掲げています。デジタルサービスや商品を24時間365日提供し、顧客体験を向上させることが、銀行のデジタル化計画の主要目標となっています。EUは、2030年までに企業のデジタル化に関する2つの主要目標を設定しています。それは、中小企業の90%以上が少なくとも基本的なレベルのデジタル集約度を達成すること、EU企業の75%がクラウドコンピューティングサービスを利用することです。EUによると、2023年には、全EU企業の70%以上が基本的なデジタル集約度を達成しています。中小企業の割合は69%であるのに対し、大企業は98%に達します。このように、欧州のにおけるデジタル化の進展は、収益性、売上高、市場力学、消費者行動などから利益を得るために、さまざまな産業にわたって企業が提供する製品の価格設定を管理する必要性を煽り、ひいては2023~2031年にかけて価格設定ソフトウェア市場を牽引すると予想されます。
欧州の価格設定ソフトウェア市場の収益と2031年までの予測(金額)
欧州の価格設定ソフトウェア市場セグメンテーション
欧州の価格設定ソフトウェア市場は、タイプ、企業規模、産業別、国別に分類されます。
タイプ別では、欧州の価格設定ソフトウェア市場はクラウドベースとオンプレミスに区分されます。2023年の欧州の価格設定ソフトウェア市場シェアでは、クラウドベースのセグメントが大きなシェアを占めています。
企業規模別では、欧州の価格設定ソフトウェア市場は中小企業と大企業に二分されます。2023年の欧州の価格設定ソフトウェア市場シェアでは、大企業セグメントが大きなシェアを占めています。
産業別では、欧州の価格設定ソフトウェア市場は、製造業、旅行・ホスピタリティ、IT・通信、小売・eコマース、飲食品、BSFI、その他に区分されます。2023年の欧州の価格設定ソフトウェア市場シェアでは、製造業セグメントが最大シェアを占めています。
国別に見ると、欧州の価格設定ソフトウェア市場はドイツ、フランス、イタリア、英国、ロシア、その他の欧州のに区分されます。2023年にはドイツセグメントが欧州の価格設定ソフトウェア市場で最大のシェアを占めています。
BOOPER、COMPETERA LIMITED、Epicor Software Corp、Eversight、Flintfox、Mercio、Minderest、Omniaretail B.V.、Price Edge、Price f(x)AG、PriceBeam、Pricemoov、PricingHUB、Prisync、PROS Holdings Inc、Reactev、RELEX Solutions、Retalon、Revalize, Inc、Sniffie Software Ltd.、Toptal, LLC、Toptal, LLC、Sniffie Software Ltd.Toptal, LLC、Vendavo, Inc、WEBCentric d.o.o、Wiser Solutions, Inc.、Zilliant, Inc.などが欧州の価格設定ソフトウェア市場で事業を展開する主要企業です。
目次
第1章 イントロダクション
第2章 エグゼクティブサマリー
- 主要な洞察
- 市場の魅力
第3章 調査手法
- 二次調査
- 一次調査
- 仮説の策定
- マクロ経済要因分析
- ファンデーション数値の開発
- データの三角測量
- 国レベルのデータ
第4章 欧州の価格設定ソフト市場情勢
- イントロダクション
- PEST分析
- エコシステム分析
- バリューチェーンのベンダー一覧
第5章 欧州の価格設定ソフトウェア市場:主要市場力学
- 欧州の価格設定ソフトウェア市場:主要市場力学
- 市場促進要因
- 競合価格戦略のニーズの高まり
- 世界のデジタル変革
- 製造業の継続的成長
- 市場抑制要因
- 高い調達コスト
- 市場機会
- データ生成とデータ分析ツールの成長
- 今後の動向
- 人工知能(AI)との統合
- 促進要因と抑制要因の影響
第6章 欧州の価格設定ソフトウェア市場分析
- 欧州の価格設定ソフトウェア市場収益(2021年~2031年)
- 欧州の価格設定ソフトウェア市場予測分析
第7章 欧州の価格設定ソフトウェア市場分析-タイプ別
- クラウド
- オンプレミス
第8章 欧州の価格設定ソフトウェア市場分析-企業規模別
- 中小企業
- 大企業
第9章 欧州の価格設定ソフトウェア市場分析-産業別
- 製造業
- 旅行・ホスピタリティ
- ITと電気通信
- 小売・eコマース
- 飲食品
- BSFI
- その他
第10章 欧州の価格設定ソフトウェア市場:国別分析
- 欧州
- ドイツ
- フランス
- イタリア
- 英国
- ロシア
- その他の欧州
第11章 競合情勢
- 主要参入企業によるヒートマップ分析
- 企業のポジショニングと集中度
第12章 産業情勢
- イントロダクション
- 市場イニシアティブ
- 製品開発
- 合併と買収
第13章 企業プロファイル
- Epicor Software Corp
- PROS Holdings Inc
- Revalize, Inc
- COMPETERA LIMITED
- Price f(x)AG
- Prisync
- WEBCentric d.o.o.
- Zilliant, Inc.
- Omniaretail B.V.
- Vendavo, Inc.
- PriceBeam
- Flintfox
- Sniffie Software Ltd.
- Eversight
- Minderest
- Wiser Solutions, Inc.
- Price Edge
- Reactev
- Retalon
- Toptal, LLC
- PricingHUB
- RELEX Solutions
- Mercio
- BOOPER
- Pricemoov
第14章 付録
List Of Tables
- Table 1. Europe Pricing Software Market Segmentation
- Table 2. List of Vendors
- Table 3. Europe Pricing Software Market - Revenue and Forecast, 2021-2031 (US$ Million)
- Table 4. Europe Pricing Software Market - Revenue and Forecast, 2021-2031 (US$ Million) - by Type
- Table 5. Europe Pricing Software Market - Revenue and Forecast, 2021-2031 (US$ Million) - by Enterprise Size
- Table 6. Europe Pricing Software Market - Revenue and Forecast, 2021-2031 (US$ Million) - by Industry Vertical
- Table 7. Europe Pricing Software Market - Revenue and Forecast, 2021-2031 (US$ Million) - by Country
- Table 8. Germany: Europe Pricing Software Market - Revenue and Forecast, 2021 - 2031 (US$ Million) - by Type
- Table 9. Germany: Europe Pricing Software Market - Revenue and Forecast, 2021 - 2031 (US$ Million) - by Enterprise Size
- Table 10. Germany: Europe Pricing Software Market - Revenue and Forecast, 2021 - 2031 (US$ Million) - by Industry Vertical
- Table 11. France: Europe Pricing Software Market - Revenue and Forecast, 2021 - 2031 (US$ Million) - by Type
- Table 12. France: Europe Pricing Software Market - Revenue and Forecast, 2021 - 2031 (US$ Million) - by Enterprise Size
- Table 13. France: Europe Pricing Software Market - Revenue and Forecast, 2021 - 2031 (US$ Million) - by Industry Vertical
- Table 14. Italy: Europe Pricing Software Market - Revenue and Forecast, 2021 - 2031 (US$ Million) - by Type
- Table 15. Italy: Europe Pricing Software Market - Revenue and Forecast, 2021 - 2031 (US$ Million) - by Enterprise Size
- Table 16. Italy: Europe Pricing Software Market - Revenue and Forecast, 2021 - 2031 (US$ Million) - by Industry Vertical
- Table 17. United Kingdom: Europe Pricing Software Market - Revenue and Forecast, 2021 - 2031 (US$ Million) - by Type
- Table 18. United Kingdom: Europe Pricing Software Market - Revenue and Forecast, 2021 - 2031 (US$ Million) - by Enterprise Size
- Table 19. United Kingdom: Europe Pricing Software Market - Revenue and Forecast, 2021 - 2031 (US$ Million) - by Industry Vertical
- Table 20. Russia: Europe Pricing Software Market - Revenue and Forecast, 2021 - 2031 (US$ Million) - by Type
- Table 21. Russia: Europe Pricing Software Market - Revenue and Forecast, 2021 - 2031 (US$ Million) - by Enterprise Size
- Table 22. Russia: Europe Pricing Software Market - Revenue and Forecast, 2021 - 2031 (US$ Million) - by Industry Vertical
- Table 23. Rest of Europe: Europe Pricing Software Market - Revenue and Forecast, 2021 - 2031 (US$ Million) - by Type
- Table 24. Rest of Europe: Europe Pricing Software Market - Revenue and Forecast, 2021 - 2031 (US$ Million) - by Enterprise Size
- Table 25. Rest of Europe: Europe Pricing Software Market - Revenue and Forecast, 2021 - 2031 (US$ Million) - by Industry Vertical
List Of Figures
- Figure 1. Europe Pricing Software Market Segmentation - Country
- Figure 2. PEST Analysis
- Figure 3. Impact Analysis of Drivers and Restraints
- Figure 4. Europe Pricing Software Market Revenue (US$ Million), 2021-2031
- Figure 5. Europe Pricing Software Market Share (%) - by Type (2023 and 2031)
- Figure 6. Cloud Based: Europe Pricing Software Market - Revenue and Forecast, 2021-2031 (US$ Million)
- Figure 7. On-Premise: Europe Pricing Software Market - Revenue and Forecast, 2021-2031 (US$ Million)
- Figure 8. Europe Pricing Software Market Share (%) - by Enterprise Size (2023 and 2031)
- Figure 9. Small and Medium Enterprises: Europe Pricing Software Market - Revenue and Forecast, 2021-2031 (US$ Million)
- Figure 10. Large Enterprises: Europe Pricing Software Market - Revenue and Forecast, 2021-2031 (US$ Million)
- Figure 11. Europe Pricing Software Market Share (%) - by Industry Vertical (2023 and 2031)
- Figure 12. Manufacturing: Europe Pricing Software Market - Revenue and Forecast, 2021-2031 (US$ Million)
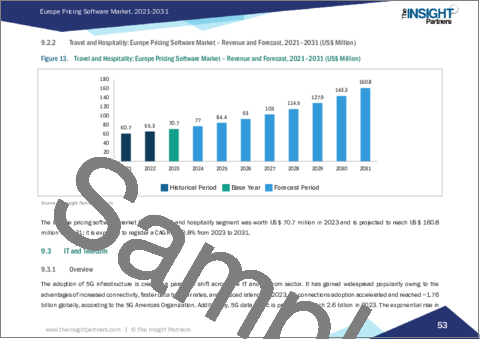
- Figure 13. Travel and Hospitality: Europe Pricing Software Market - Revenue and Forecast, 2021-2031 (US$ Million)
- Figure 14. IT and Telecom: Europe Pricing Software Market - Revenue and Forecast, 2021-2031 (US$ Million)
- Figure 15. Retail and E-commerce: Europe Pricing Software Market - Revenue and Forecast, 2021-2031 (US$ Million)
- Figure 16. Food and Beverages: Europe Pricing Software Market - Revenue and Forecast, 2021-2031 (US$ Million)
- Figure 17. BSFI: Europe Pricing Software Market - Revenue and Forecast, 2021-2031 (US$ Million)
- Figure 18. Others: Europe Pricing Software Market - Revenue and Forecast, 2021-2031 (US$ Million)
- Figure 19. Europe Pricing Software Market Breakdown, by Key Countries, 2023 and 2031 (%)
- Figure 20. Germany: Europe Pricing Software Market - Revenue and Forecast, 2021- 2031 (US$ Million)
- Figure 21. France: Europe Pricing Software Market - Revenue and Forecast, 2021- 2031 (US$ Million)
- Figure 22. Italy: Europe Pricing Software Market - Revenue and Forecast, 2021- 2031 (US$ Million)
- Figure 23. United Kingdom: Europe Pricing Software Market - Revenue and Forecast, 2021- 2031 (US$ Million)
- Figure 24. Russia: Europe Pricing Software Market - Revenue and Forecast, 2021- 2031 (US$ Million)
- Figure 25. Rest of Europe: Europe Pricing Software Market - Revenue and Forecast, 2021- 2031 (US$ Million)
- Figure 26. Heat Map Analysis by Key Players
- Figure 27. Company Positioning and Concentration
The Europe pricing software market was valued at US$ 354.11 million in 2023 and is expected to reach US$ 816.67 million by 2031; it is estimated to register a CAGR of 11.0% from 2023 to 2031.
Continuous Growth in Manufacturing Industry Drive Europe Pricing Software Market
In the past few years, due to industrialization, the manufacturing industry has expanded significantly in terms of output generated, the total number of manufacturing companies, and digitalization trends in the manufacturing sector. For instance, as per the data published by the United Nations in 2023, the production index of global manufacturing production in 2015 was 100, whereas the index in 2019 reached 113. In Q3 2021, the global manufacturing index reached 117. In 2023, the global manufacturing index passed 120 points. The automotive industry is one of the notable industries across the globe that has shown strong growth rates in the past few years. As per the data published by the International Organization of Motor Vehicle Manufacturers in 2023, the total vehicle production was 80 million in 2021, which increased to 93 million in 2023. Such statistics show increased global manufacturing output in the past few years. Such growth in the manufacturing industry increased the importance of the tools that help in gaining competitive advantage, ultimately driving the demand for pricing optimization and management software.
Europe Pricing Software Market Overview
Europe is witnessing increasing digitalization across various industries, including BFSI. Almost every well-known banking institution in Europe has a digital transformation strategy. Offering digital services and goods 24/7 to improve customer experience is the main goal of most digitalization plans for banks. The EU has set two main goals for the digitalization of businesses by 2030: more than 90% of SMEs could achieve at least a basic level of digital intensity, and 75% of EU companies should use cloud computing services. According to the EU, in 2023, more than 70% of all EU companies reached a basic level of digital intensity. The proportion of SMEs was 69%, whereas large companies stood at 98%. Thus, the increasing digitalization in Europe fuels the need to manage pricing for company's offerings across various industries to benefit from profitability, sales, market dynamics, consumer behavior, and others, which, in turn, is expected to drive the pricing software market from 2023 to 2031.
Europe Pricing Software Market Revenue and Forecast to 2031 (US$ Million)
Europe Pricing Software Market Segmentation
The Europe pricing software market is categorized into type, enterprise size, industry vertical, and country.
By type, the Europe pricing software market is segmented into cloud based and on-premise. The cloud based segment held a larger share of the Europe pricing software market share in 2023.
In terms of enterprise size , the Europe pricing software market is bifurcated into small & medium enterprises and large enterprises. The large enterprises segment held a larger share of the Europe pricing software market share in 2023.
Based on industry vertical, the Europe pricing software market is segmented into manufacturing, travel and hospitality, it and telecom, retail and e-commerce, food and beverages, BSFI, and others. The manufacturing segment held the largest share of the Europe pricing software market share in 2023.
Based on country, the Europe pricing software market is segmented into Germany, France, Italy, the UK, Russia, and the Rest of Europe. Germany segment held the largest share of the Europe pricing software market in 2023.
BOOPER; COMPETERA LIMITED; Epicor Software Corp; Eversight; Flintfox; Mercio; Minderest; Omniaretail B.V.; Price Edge; Price f(x) AG; PriceBeam; Pricemoov; PricingHUB; Prisync; PROS Holdings Inc; Reactev; RELEX Solutions; Retalon; Revalize, Inc; Sniffie Software Ltd.; Toptal, LLC; Vendavo, Inc; WEBCentric d.o.o; Wiser Solutions, Inc.; and Zilliant, Inc. are some of the leading companies operating in the Europe pricing software market.
Table Of Contents
1. Introduction
- 1.1 Report Guidance
- 1.2 Market Segmentation
2. Executive Summary
- 2.1 Key Insights
- 2.2 Market Attractiveness
3. Research Methodology
- 3.1 Secondary Research
- 3.2 Primary Research
- 3.2.1 Hypothesis formulation:
- 3.2.2 Macro-economic factor analysis:
- 3.2.3 Developing base number:
- 3.2.4 Data Triangulation:
- 3.2.5 Country level data:
4. Europe Pricing Software Market Landscape
- 4.1 Overview
- 4.2 PEST Analysis
- 4.3 Ecosystem Analysis
- 4.4 List of Vendors in the Value Chain
5. Europe Pricing Software Market - Key Market Dynamics
- 5.1 Europe Pricing Software Market - Key Market Dynamics
- 5.2 Market Drivers
- 5.2.1 Increasing Need for Competitive Pricing Strategies
- 5.2.2 Digital Transformation Globally
- 5.2.3 Continuous Growth in Manufacturing Industry
- 5.3 Market Restraints
- 5.3.1 High Procurement Costs
- 5.4 Market Opportunities
- 5.4.1 Growing Data Generation and Data Analytics Tools
- 5.5 Future Trends
- 5.5.1 Integration with Artificial Intelligence (AI)
- 5.6 Impact of Drivers and Restraints:
6. Europe Pricing Software Market - Analysis
- 6.1 Europe Pricing Software Market Revenue (US$ Million), 2021-2031
- 6.2 Europe Pricing Software Market Forecast Analysis
7. Europe Pricing Software Market Analysis - by Type
- 7.1 Cloud Based
- 7.1.1 Overview
- 7.1.2 Cloud Based: Europe Pricing Software Market - Revenue and Forecast, 2021-2031 (US$ Million)
- 7.2 On-Premise
- 7.2.1 Overview
- 7.2.2 On-Premise: Europe Pricing Software Market - Revenue and Forecast, 2021-2031 (US$ Million)
8. Europe Pricing Software Market Analysis - by Enterprise Size
- 8.1 Small and Medium Enterprises
- 8.1.1 Overview
- 8.1.2 Small and Medium Enterprises: Europe Pricing Software Market - Revenue and Forecast, 2021-2031 (US$ Million)
- 8.2 Large Enterprises
- 8.2.1 Overview
- 8.2.2 Large Enterprises: Europe Pricing Software Market - Revenue and Forecast, 2021-2031 (US$ Million)
9. Europe Pricing Software Market Analysis - by Industry Vertical
- 9.1 Manufacturing
- 9.1.1 Overview
- 9.1.2 Manufacturing: Europe Pricing Software Market - Revenue and Forecast, 2021-2031 (US$ Million)
- 9.2 Travel and Hospitality
- 9.2.1 Overview
- 9.2.2 Travel and Hospitality: Europe Pricing Software Market - Revenue and Forecast, 2021-2031 (US$ Million)
- 9.3 IT and Telecom
- 9.3.1 Overview
- 9.3.2 IT and Telecom: Europe Pricing Software Market - Revenue and Forecast, 2021-2031 (US$ Million)
- 9.4 Retail and E-commerce
- 9.4.1 Overview
- 9.4.2 Retail and E-commerce: Europe Pricing Software Market - Revenue and Forecast, 2021-2031 (US$ Million)
- 9.5 Food and Beverages
- 9.5.1 Overview
- 9.5.2 Food and Beverages: Europe Pricing Software Market - Revenue and Forecast, 2021-2031 (US$ Million)
- 9.6 BSFI
- 9.6.1 Overview
- 9.6.2 BSFI: Europe Pricing Software Market - Revenue and Forecast, 2021-2031 (US$ Million)
- 9.7 Others
- 9.7.1 Overview
- 9.7.2 Others: Europe Pricing Software Market - Revenue and Forecast, 2021-2031 (US$ Million)
10. Europe Pricing Software Market - Country Analysis
- 10.1 Europe
- 10.1.1 Europe Pricing Software Market - Revenue and Forecast Analysis - by Country
- 10.1.1.1 Europe Pricing Software Market - Revenue and Forecast Analysis - by Country
- 10.1.1.2 Germany: Europe Pricing Software Market - Revenue and Forecast, 2021-2031 (US$ Million)
- 10.1.1.2.1 Germany: Europe Pricing Software Market Share - by Type
- 10.1.1.2.2 Germany: Europe Pricing Software Market Share - by Enterprise Size
- 10.1.1.2.3 Germany: Europe Pricing Software Market Share - by Industry Vertical
- 10.1.1.3 France: Europe Pricing Software Market - Revenue and Forecast, 2021-2031 (US$ Million)
- 10.1.1.3.1 France: Europe Pricing Software Market Share - by Type
- 10.1.1.3.2 France: Europe Pricing Software Market Share - by Enterprise Size
- 10.1.1.3.3 France: Europe Pricing Software Market Share - by Industry Vertical
- 10.1.1.4 Italy: Europe Pricing Software Market - Revenue and Forecast, 2021-2031 (US$ Million)
- 10.1.1.4.1 Italy: Europe Pricing Software Market Share - by Type
- 10.1.1.4.2 Italy: Europe Pricing Software Market Share - by Enterprise Size
- 10.1.1.4.3 Italy: Europe Pricing Software Market Share - by Industry Vertical
- 10.1.1.5 United Kingdom: Europe Pricing Software Market - Revenue and Forecast, 2021-2031 (US$ Million)
- 10.1.1.5.1 United Kingdom: Europe Pricing Software Market Share - by Type
- 10.1.1.5.2 United Kingdom: Europe Pricing Software Market Share - by Enterprise Size
- 10.1.1.5.3 United Kingdom: Europe Pricing Software Market Share - by Industry Vertical
- 10.1.1.6 Russia: Europe Pricing Software Market - Revenue and Forecast, 2021-2031 (US$ Million)
- 10.1.1.6.1 Russia: Europe Pricing Software Market Share - by Type
- 10.1.1.6.2 Russia: Europe Pricing Software Market Share - by Enterprise Size
- 10.1.1.6.3 Russia: Europe Pricing Software Market Share - by Industry Vertical
- 10.1.1.7 Rest of Europe: Europe Pricing Software Market - Revenue and Forecast, 2021-2031 (US$ Million)
- 10.1.1.7.1 Rest of Europe: Europe Pricing Software Market Share - by Type
- 10.1.1.7.2 Rest of Europe: Europe Pricing Software Market Share - by Enterprise Size
- 10.1.1.7.3 Rest of Europe: Europe Pricing Software Market Share - by Industry Vertical
- 10.1.1 Europe Pricing Software Market - Revenue and Forecast Analysis - by Country
11. Competitive Landscape
- 11.1 Heat Map Analysis by Key Players
- 11.2 Company Positioning and Concentration
12. Industry Landscape
- 12.1 Overview
- 12.2 Market Initiative
- 12.3 Product Development
- 12.4 Mergers & Acquisitions
13. Company Profile
- 13.1 Epicor Software Corp
- 13.1.1 Key Facts
- 13.1.2 Business Description
- 13.1.3 Products and Services
- 13.1.4 Financial Overview
- 13.1.5 SWOT Analysis
- 13.1.6 Key Developments
- 13.2 PROS Holdings Inc
- 13.2.1 Key Facts
- 13.2.2 Business Description
- 13.2.3 Products and Services
- 13.2.4 Financial Overview
- 13.2.5 SWOT Analysis
- 13.2.6 Key Developments
- 13.3 Revalize, Inc
- 13.3.1 Key Facts
- 13.3.2 Business Description
- 13.3.3 Products and Services
- 13.3.4 Financial Overview
- 13.3.5 SWOT Analysis
- 13.3.6 Key Developments
- 13.4 COMPETERA LIMITED
- 13.4.1 Key Facts
- 13.4.2 Business Description
- 13.4.3 Products and Services
- 13.4.4 Financial Overview
- 13.4.5 SWOT Analysis
- 13.4.6 Key Developments
- 13.5 Price f(x) AG
- 13.5.1 Key Facts
- 13.5.2 Business Description
- 13.5.3 Products and Services
- 13.5.4 Financial Overview
- 13.5.5 SWOT Analysis
- 13.5.6 Key Developments
- 13.6 Prisync
- 13.6.1 Key Facts
- 13.6.2 Business Description
- 13.6.3 Products and Services
- 13.6.4 Financial Overview
- 13.6.5 SWOT Analysis
- 13.6.6 Key Developments
- 13.7 WEBCentric d.o.o.
- 13.7.1 Key Facts
- 13.7.2 Business Description
- 13.7.3 Products and Services
- 13.7.4 Financial Overview
- 13.7.5 SWOT Analysis
- 13.7.6 Key Developments
- 13.8 Zilliant, Inc.
- 13.8.1 Key Facts
- 13.8.2 Business Description
- 13.8.3 Products and Services
- 13.8.4 Financial Overview
- 13.8.5 SWOT Analysis
- 13.8.6 Key Developments
- 13.9 Omniaretail B.V.
- 13.9.1 Key Facts
- 13.9.2 Business Description
- 13.9.3 Products and Services
- 13.9.4 Financial Overview
- 13.9.5 SWOT Analysis
- 13.9.6 Key Developments
- 13.10 Vendavo, Inc.
- 13.10.1 Key Facts
- 13.10.2 Business Description
- 13.10.3 Products and Services
- 13.10.4 Financial Overview
- 13.10.5 SWOT Analysis
- 13.10.6 Key Developments
- 13.11 PriceBeam
- 13.11.1 Key Facts
- 13.11.2 Business Description
- 13.11.3 Products and Services
- 13.11.4 Financial Overview
- 13.11.5 SWOT Analysis
- 13.11.6 Key Developments
- 13.12 Flintfox
- 13.12.1 Key Facts
- 13.12.2 Business Description
- 13.12.3 Products and Services
- 13.12.4 Financial Overview
- 13.12.5 SWOT Analysis
- 13.12.6 Key Developments
- 13.13 Sniffie Software Ltd.
- 13.13.1 Key Facts
- 13.13.2 Business Description
- 13.13.3 Products and Services
- 13.13.4 Financial Overview
- 13.13.5 SWOT Analysis
- 13.13.6 Key Developments
- 13.14 Eversight
- 13.14.1 Key Facts
- 13.14.2 Business Description
- 13.14.3 Products and Services
- 13.14.4 Financial Overview
- 13.14.5 SWOT Analysis
- 13.14.6 Key Developments
- 13.15 Minderest
- 13.15.1 Key Facts
- 13.15.2 Business Description
- 13.15.3 Products and Services
- 13.15.4 Financial Overview
- 13.15.5 SWOT Analysis
- 13.15.6 Key Developments
- 13.16 Wiser Solutions, Inc.
- 13.16.1 Key Facts
- 13.16.2 Business Description
- 13.16.3 Products and Services
- 13.16.4 Financial Overview
- 13.16.5 SWOT Analysis
- 13.16.6 Key Developments
- 13.17 Price Edge
- 13.17.1 Key Facts
- 13.17.2 Business Description
- 13.17.3 Products and Services
- 13.17.4 Financial Overview
- 13.17.5 SWOT Analysis
- 13.17.6 Key Developments
- 13.18 Reactev
- 13.18.1 Key Facts
- 13.18.2 Business Description
- 13.18.3 Products and Services
- 13.18.4 Financial Overview
- 13.18.5 SWOT Analysis
- 13.18.6 Key Developments
- 13.19 Retalon
- 13.19.1 Key Facts
- 13.19.2 Business Description
- 13.19.3 Products and Services
- 13.19.4 Financial Overview
- 13.19.5 SWOT Analysis
- 13.19.6 Key Developments
- 13.20 Toptal, LLC
- 13.20.1 Key Facts
- 13.20.2 Business Description
- 13.20.3 Products and Services
- 13.20.4 Financial Overview
- 13.20.5 SWOT Analysis
- 13.20.6 Key Developments
- 13.21 PricingHUB
- 13.21.1 Key Facts
- 13.21.2 Business Description
- 13.21.3 Products and Services
- 13.21.4 Financial Overview
- 13.21.5 SWOT Analysis
- 13.21.6 Key Developments
- 13.22 RELEX Solutions
- 13.22.1 Key Facts
- 13.22.2 Business Description
- 13.22.3 Products and Services
- 13.22.4 Financial Overview
- 13.22.5 SWOT Analysis
- 13.22.6 Key Developments
- 13.23 Mercio
- 13.23.1 Key Facts
- 13.23.2 Business Description
- 13.23.3 Products and Services
- 13.23.4 Financial Overview
- 13.23.5 SWOT Analysis
- 13.23.6 Key Developments
- 13.24 BOOPER
- 13.24.1 Key Facts
- 13.24.2 Business Description
- 13.24.3 Products and Services
- 13.24.4 Financial Overview
- 13.24.5 SWOT Analysis
- 13.24.6 Key Developments
- 13.25 Pricemoov
- 13.25.1 Key Facts
- 13.25.2 Business Description
- 13.25.3 Products and Services
- 13.25.4 Financial Overview
- 13.25.5 SWOT Analysis
- 13.25.6 Key Developments
14. Appendix
- 14.1 About Us
