|
|
市場調査レポート
商品コード
1764895
アジア太平洋の石油化学製品の2031年市場予測-地域別分析-タイプ、用途、最終産業別Asia Pacific Petrochemicals Market Forecast to 2031 - Regional Analysis - by Type, Application, and End-use Industry |
||||||

|
|||||||
|
|||||||

| アジア太平洋の石油化学製品の2031年市場予測-地域別分析-タイプ、用途、最終産業別 |
|
出版日: 2025年04月14日
発行: The Insight Partners
ページ情報: 英文 193 Pages
納期: 即納可能
|

全表示
- 概要
- 図表
- 目次
アジア太平洋の石油化学製品市場は、2023年に2,468億5,000万米ドルと評価され、2031年には3,886億米ドルに達すると予測され、2023~2031年のCAGRは5.8%と推定されます。
航空宇宙・防衛産業への投資拡大がアジア太平洋の石油化学製品市場を後押し
各国政府は、安全保障リスクの高まりと国境警備強化の必要性から、防衛や弾道防護を含む航空宇宙関連研究への投資を増やしています。例えば、国防省(インド)は2022年に、2025年までに国防生産を220億米ドルに増加させるという目標を記載した報告書を発表しました。同報告書はまた、政府が国防のための技術革新や技術開発基金などのイニシアチブを開始し、軍向けの製品革新に資金援助を提供することを明らかにしました。
石油化学製品と石油化学製品由来の製品は、潤滑油、グリース、航空燃料、航空宇宙部品に使用されています。このため、航空宇宙・防衛産業への投資が増加しており、予測期間中に石油化学製品市場の成長に有利な機会が生まれると期待されています。
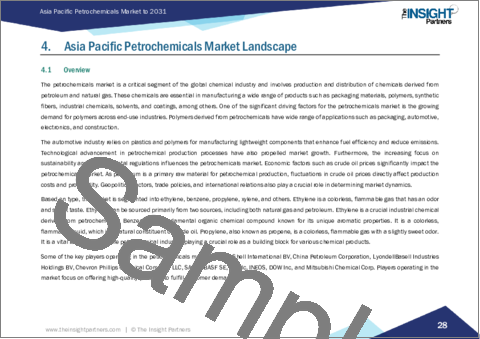
アジア太平洋の石油化学製品市場概要
中国、インド、韓国、日本、オーストラリアはアジア太平洋の主要経済国の一つです。アジア太平洋の石油化学製品市場の成長は、同地域の堅調な経済開発と工業化によって推進されています。上記の国々はこの市場拡大の最前線にあり、広範な産業基盤を活用し、消費者市場を拡大し、石油化学製品インフラへの戦略的投資を行って市場での存在感を高めています。中国、インド、東南アジア諸国では急速な都市化とインフラ開発が進み、交通網、エネルギー施設、公共施設などの建設活動が活発化しているため、建設産業は石油化学製品の主要な消費者となっています。サステイナブル開発目標2030」の下、アジア開発銀行は、アジア太平洋のにおける強靭なインフラの構築、包括的でサステイナブル工業化の促進、製品イノベーションの支援に関する計画を発表しました。同様に、インド産業・国内貿易振興省(DPIIT)の報告書によると、インド政府は、インフラ部門への多額の予算配分、開放的なFDI基準、スマートシティミッションなど、いくつかの施策を通じて、同国のインフラと建設サービスを強化する計画を発表しました。同報告書はまた、インドの不動産業は2030年までに1兆米ドルを占めるようになり、インフラ設備投資額は前年比34%増の670万米ドルに達すると予測しています。石油化学製品由来の製品は、この地域全体の住宅、商業、工業プロジェクトを含む建設プロジェクトで広く使用されています。ポリ塩化ビニル(PVC)、ポリエチレン、ポリスチレンといった石油化学製品由来の材料は、配管、断熱材、屋根材、床材などの建築・建設用途に広く使用されています。これらの材料は、耐久性、費用対効果、施工の容易さを提供し、現代の建設プロジェクトに欠かせないものとなっています。アジア太平洋の石油化学製品市場を大きく牽引しているのは自動車産業です。同地域では自動車の生産と販売が増加し続けているため、自動車部品の需要が増加しています。国際OICAによると、アジア・オセアニアの自動車生産台数は2022年の5,000万台から2023年には5,510万台に増加します。石油化学製品ベースの製品は、自動車の内装や外装に広く利用され、快適性を高め、騒音を最小限に抑え、この地域の消費者の運転体験の向上に貢献しています。
アジア太平洋の石油化学製品市場の収益と2031年までの予測(10億米ドル)
アジア太平洋の石油化学製品市場のセグメンテーション
アジア太平洋の石油化学製品市場は、タイプ、用途、最終用途産業、国によって区分されます。タイプ別では、アジア太平洋の石油化学製品市場はエチレン、ベンゼン、プロピレン、キシレン、その他に区分されます。2023年にはエチレンセグメントが最大の市場シェアを占めています。
用途別では、アジア太平洋の石油化学製品市場はポリマー、塗料・コーティング、溶剤、ゴム、接着剤、界面活性剤、その他に区分されます。2023年にはポリマーセグメントが最大の市場シェアを占めています。
最終用途産業別では、アジア太平洋の石油化学製品市場は包装、自動車、建設、電気・電子、ヘルスケア、農業、航空宇宙・防衛、その他に分類されます。2023年には包装セグメントが最大の市場シェアを占めました。
国別では、アジア太平洋の石油化学製品市場はオーストラリア、中国、インド、日本、韓国、その他のアジア太平洋のに区分されます。2023年のアジア太平洋の石油化学製品市場シェアは中国が独占しています。
Shell Plc、LyondellBasell Industries NV、Saudi Basic Industries Corp、BASF SE、INEOS Group Holdings SA、Dow Inc、Chevron Phillips Chemical Company LLC、China Petroleum & Chemical Corp、Mitsubishi Chemical Group Corp、Exxon Mobil Corpは、アジア太平洋の石油化学製品品市場で事業を展開する主要企業です。
目次
第1章 イントロダクション
第2章 エグゼクティブサマリー
- 主要な洞察
- 市場の魅力
第3章 調査手法
- 二次調査
- 一次調査
- 仮説の策定
- マクロ経済要因分析
- ファンデーション数値の開発
- データの三角測量
- 国レベルのデータ
第4章 アジア太平洋の石油化学製品市場情勢
- イントロダクション
- ポーターのファイブフォース分析
- 供給企業の交渉力
- 買い手の交渉力
- 新規参入業者の脅威
- 競争企業間の敵対関係
- 代替品の脅威
- エコシステム分析
- 原油と原料の準備
- 石油化学製品メーカー
- 流通業者
- 最終用途産業
- バリューチェーンのベンダー一覧
第5章 アジア太平洋の石油化学製品市場-主要市場力学
- 石油化学製品市場-主要市場力学
- 市場促進要因
- 包装産業の成長
- 様々な最終用途産業におけるポリマー需要の急増
- 市場抑制要因
- 原油価格の変動
- 市場機会
- 航空宇宙・防衛産業への投資拡大
- 今後の動向
- 生分解性石油化学製品の開発
- 促進要因と抑制要因の影響
第6章 石油化学製品市場:アジア太平洋市場分析
- 石油化学製品の市場規模(100万トン)、2021~2031年
- 石油化学製品の市場数量予測・分析(100万トン)
- 石油化学製品の市場収益(2023年~2031年)
- 石油化学製品市場の予測・分析
第7章 アジア太平洋の石油化学製品の市場規模と収益分析-タイプ別
- エチレン
- ベンゼン
- プロピレン
- キシレン
- その他
第8章 アジア太平洋の石油化学製品市場の収益分析-用途別
- ポリマー
- 塗料・コーティング
- 溶剤
- ゴム
- 接着剤
- 界面活性剤
- その他
第9章 アジア太平洋の石油化学製品市場の収益分析-最終用途産業別
- 包装
- 自動車
- 建設
- 電気・電子
- ヘルスケア
- 農業
- 航空宇宙・防衛
- その他
第10章 アジア太平洋の石油化学製品市場:国別分析
- アジア太平洋
- オーストラリア
- 中国
- インド
- 日本
- 韓国
- その他のアジア太平洋
第11章 競合情勢
- 主要参入企業によるヒートマップ分析
- 企業のポジショニングと集中度
第12章 産業情勢
- イントロダクション
- 市場イニシアティブ
- 合併と買収
第13章 企業プロファイル
- Shell Plc
- LyondellBasell Industries NV
- Saudi Basic Industries Corp
- BASF SE
- INEOS Group Holdings SA
- Dow Inc
- Chevron Phillips Chemical Company LLC.
- China Petroleum & Chemical Corp
- Mitsubishi Chemical Group Corp
- Exxon Mobil Corp
第14章 付録
List Of Tables
- Table 1. Petrochemicals Market Segmentation
- Table 2. List of Vendors
- Table 3. Petrochemicals Market - Volume and Forecast to 2031 (Million Tons)
- Table 4. Petrochemicals Market - Revenue and Forecast to 2031 (US$ Billion)
- Table 5. Petrochemicals Market - Volume and Forecast to 2031 (Million Tons) - by Type
- Table 6. Petrochemicals Market - Revenue and Forecast to 2031 (US$ Billion) - by Type
- Table 7. Petrochemicals Market - Revenue and Forecast to 2031 (US$ Billion) - by Application
- Table 8. Petrochemicals Market - Revenue and Forecast to 2031 (US$ Billion) - by End-use Industry
- Table 9. Asia Pacific Petrochemicals Market - Volume and Forecast to 2031 (Million Tons) - by Country
- Table 10. Asia Pacific Petrochemicals Market - Revenue and Forecast to 2031 (US$ Billion) - by Country
- Table 11. Australia Petrochemicals Market - Volume and Forecast to 2031 (Million Tons) - by Type
- Table 12. Australia Petrochemicals Market - Revenue and Forecast to 2031 (US$ Billion) - by Type
- Table 13. Australia Petrochemicals Market - Revenue and Forecast to 2031 (US$ Billion) - by Application
- Table 14. Australia Petrochemicals Market - Revenue and Forecast to 2031 (US$ Billion) - by End-use Industry
- Table 15. China Petrochemicals Market - Volume and Forecast to 2031 (Million Tons) - by Type
- Table 16. China Petrochemicals Market - Revenue and Forecast to 2031 (US$ Billion) - by Type
- Table 17. China Petrochemicals Market - Revenue and Forecast to 2031 (US$ Billion) - by Application
- Table 18. China Petrochemicals Market - Revenue and Forecast to 2031 (US$ Billion) - by End-use Industry
- Table 19. India Petrochemicals Market - Volume and Forecast to 2031 (Million Tons) - by Type
- Table 20. India Petrochemicals Market - Revenue and Forecast to 2031 (US$ Billion) - by Type
- Table 21. India Petrochemicals Market - Revenue and Forecast to 2031 (US$ Billion) - by Application
- Table 22. India Petrochemicals Market - Revenue and Forecast to 2031 (US$ Billion) - by End-use Industry
- Table 23. Japan Petrochemicals Market - Volume and Forecast to 2031 (Million Tons) - by Type
- Table 24. Japan Petrochemicals Market - Revenue and Forecast to 2031 (US$ Billion) - by Type
- Table 25. Japan Petrochemicals Market - Revenue and Forecast to 2031 (US$ Billion) - by Application
- Table 26. Japan Petrochemicals Market - Revenue and Forecast to 2031 (US$ Billion) - by End-use Industry
- Table 27. South Korea Petrochemicals Market - Volume and Forecast to 2031 (Million Tons) - by Type
- Table 28. South Korea Petrochemicals Market - Revenue and Forecast to 2031 (US$ Billion) - by Type
- Table 29. South Korea Petrochemicals Market - Revenue and Forecast to 2031 (US$ Billion) - by Application
- Table 30. South Korea Petrochemicals Market - Revenue and Forecast to 2031 (US$ Billion) - by End-use Industry
- Table 31. Rest of Asia Pacific Petrochemicals Market - Volume and Forecast to 2031 (Million Tons) - by Type
- Table 32. Rest of Asia Pacific Petrochemicals Market - Revenue and Forecast to 2031 (US$ Billion) - by Type
- Table 33. Rest of Asia Pacific Petrochemicals Market - Revenue and Forecast to 2031 (US$ Billion) - by Application
- Table 34. Rest of Asia Pacific Petrochemicals Market - Revenue and Forecast to 2031 (US$ Billion) - by End-use Industry
List Of Figures
- Figure 1. Petrochemicals Market Segmentation, by Country
- Figure 2. Porter's Five Forces Analysis
- Figure 3. Ecosystem Analysis: Petrochemicals Market
- Figure 4. Petrochemicals Production Chain
- Figure 5. Indian Plastics Exports ? by Product (2022-2023)
- Figure 6. Global Plastics Production ? by Polymer, 2022
- Figure 7. Impact Analysis of Drivers and Restraints
- Figure 8. Petrochemicals Market Volume (Million Tons), 2021-2031
- Figure 9. Petrochemicals Market Revenue (US$ Billion), 2023-2031
- Figure 10. Petrochemicals Market Share (%) - Type, 2023 and 2031
- Figure 11. Ethylene: Petrochemicals Market - Volume and Forecast to 2031 (Million Tons)
- Figure 12. Ethylene: Petrochemicals Market - Revenue and Forecast to 2031 (US$ Billion)
- Figure 13. Benzene: Petrochemicals Market - Volume and Forecast to 2031 (Million Tons)
- Figure 14. Benzene: Petrochemicals Market - Revenue and Forecast to 2031 (US$ Billion)
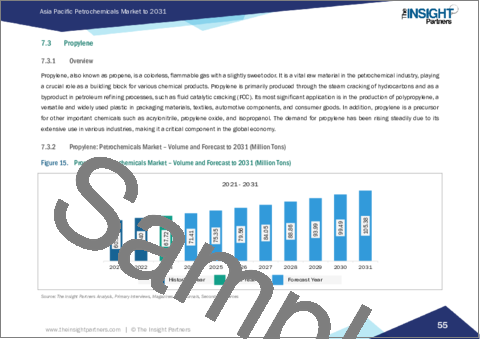
- Figure 15. Propylene: Petrochemicals Market - Volume and Forecast to 2031 (Million Tons)
- Figure 16. Propylene: Petrochemicals Market - Revenue and Forecast to 2031 (US$ Billion)
- Figure 17. Xylene: Petrochemicals Market - Volume and Forecast to 2031 (Million Tons)
- Figure 18. Xylene: Petrochemicals Market - Revenue and Forecast to 2031 (US$ Billion)
- Figure 19. Others: Petrochemicals Market - Volume and Forecast to 2031 (Million Tons)
- Figure 20. Others: Petrochemicals Market - Revenue and Forecast to 2031 (US$ Billion)
- Figure 21. Petrochemicals Market Share (%) - Application, 2023 and 2031
- Figure 22. Polymers: Petrochemicals Market - Revenue and Forecast to 2031 (US$ Billion)
- Figure 23. Paints and Coatings: Petrochemicals Market - Revenue and Forecast to 2031 (US$ Billion)
- Figure 24. Solvent: Petrochemicals Market - Revenue and Forecast to 2031 (US$ Billion)
- Figure 25. Rubber: Petrochemicals Market - Revenue and Forecast to 2031 (US$ Billion)
- Figure 26. Adhesives: Petrochemicals Market - Revenue and Forecast to 2031 (US$ Billion)
- Figure 27. Surfactants: Petrochemicals Market - Revenue and Forecast to 2031 (US$ Billion)
- Figure 28. Others: Petrochemicals Market - Revenue and Forecast to 2031 (US$ Billion)
- Figure 29. Petrochemicals Market Share (%) - End-use Industry, 2023 and 2031
- Figure 30. Packaging: Petrochemicals Market - Revenue and Forecast to 2031 (US$ Billion)
- Figure 31. Automotive: Petrochemicals Market - Revenue and Forecast to 2031 (US$ Billion)
- Figure 32. Construction: Petrochemicals Market - Revenue and Forecast to 2031 (US$ Billion)
- Figure 33. Electrical and Electronics: Petrochemicals Market - Revenue and Forecast to 2031 (US$ Billion)
- Figure 34. Healthcare: Petrochemicals Market - Revenue and Forecast to 2031 (US$ Billion)
- Figure 35. Agriculture: Petrochemicals Market - Revenue and Forecast to 2031 (US$ Billion)
- Figure 36. Aerospace and Defense: Petrochemicals Market - Revenue and Forecast to 2031 (US$ Billion)
- Figure 37. Others: Petrochemicals Market - Revenue and Forecast to 2031 (US$ Billion)
- Figure 38. Asia Pacific Petrochemicals Market, by Key Countries - Revenue (2023) (Billion)
- Figure 39. Asia Pacific Petrochemicals Market Breakdown by Key Countries, 2023 and 2031 (%)
- Figure 40. Australia Petrochemicals Market - Revenue and Forecast to 2031 (US$ Billion)
- Figure 41. China Petrochemicals Market - Revenue and Forecast to 2031 (US$ Billion)
- Figure 42. India Petrochemicals Market - Revenue and Forecast to 2031 (US$ Billion)
- Figure 43. Japan Petrochemicals Market - Revenue and Forecast to 2031 (US$ Billion)
- Figure 44. South Korea Petrochemicals Market - Revenue and Forecast to 2031 (US$ Billion)
- Figure 45. Rest of Asia Pacific Petrochemicals Market - Revenue and Forecast to 2031 (US$ Billion)
- Figure 46. Heat Map Analysis by Key Players
- Figure 47. Company Positioning & Concentration
The Asia Pacific petrochemicals market was valued at US$ 246.85 billion in 2023 and is expected to reach US$ 388.60 billion by 2031; it is estimated to record a CAGR of 5.8% from 2023 to 2031.
Growing Investments in Aerospace & Defense Industry Boosts Asia Pacific Petrochemicals Market
Governments of various countries have increased investments in aerospace-related research, including defense and ballistic protection, owing to a rise in security risks and the need to enhance national border security. For instance, the Ministry of Defense (India) published a report in 2022 stating its target of increasing defense production to US$ 22 billion by 2025. The report also revealed that the government started initiatives such as Innovations for Defense Excellence and Technology Development Fund to provide financial assistance for product innovations for the Armed Forces.
Petrochemicals and petrochemical-derived products are used in lubricants, greases, aviation fuels, and aerospace components. Thus, the rising investments in the aerospace & defense industry are expected to create lucrative opportunities for the petrochemicals market growth during the forecast period.
Asia Pacific Petrochemicals Market Overview
China, India, South Korea, Japan, and Australia are among the major economies in Asia Pacific. The growth of the petrochemicals market in Asia Pacific is propelled by the region's robust economic development and industrialization. The abovementioned countries are at the forefront of this market expansion, leveraging their extensive industrial bases, increasing consumer markets, and making strategic investments in petrochemical infrastructure to enhance their market presence. As rapid urbanization and infrastructure development in China, India, and Southeast Asian nations have led to increased construction activities, such as transportation networks, energy facilities, and public amenities, the construction industry has become a major consumer of petrochemicals. Under the Sustainable Development Goals 2030, the Asian Development Bank has announced its plans to build resilient infrastructure, promote inclusive and sustainable industrialization, and support product innovation in Asia Pacific. Similarly, as per the report by the Department for Promotion of Industry and Internal Trade (DPIIT), the Government of India has announced its plans to boost the country's infrastructure and construction services through several policies such as large budget allocation to the infrastructure sector, open FDI norms, and smart cities mission. The report also stated that the real estate industry in India is projected to account for US$ 1 trillion by 2030, along with an increased year-on-year infrastructure Capex by 34% to reach US$ 6.7 million. Petrochemical-derived products are widely used in construction projects, including residential, commercial, and industrial projects across the region. Petrochemical-derived materials such as polyvinyl chloride (PVC), polyethylene, and polystyrene are widely used in building and construction applications, including piping, insulation, roofing, and flooring. These materials offer durability, cost-effectiveness, and ease of installation, making them indispensable for modern construction projects. The automotive industry is significantly driving the petrochemicals market in Asia Pacific. As the region continues to witness an increase in automobile production and sales, there is an increasing demand for vehicle components. According to the International OICA, Asia-Oceania's vehicle production increased from 50 million in 2022 to 55.1 million in 2023. Petrochemical-based products are extensively utilized in automotive interiors and exteriors to enhance comfort levels and minimize noise, contributing to an enhanced driving experience for consumers across the region.
Asia Pacific Petrochemicals Market Revenue and Forecast to 2031 (US$ Billion)
Asia Pacific Petrochemicals Market Segmentation
The Asia Pacific petrochemicals market is segmented based on type, application, end-use industry, and country. Based on type, the Asia Pacific petrochemicals market is segmented into ethylene, benzene, propylene, xylene, and others. The ethylene segment held the largest market share in 2023.
In terms of application, the Asia Pacific petrochemicals market is segmented into polymers, paints and coatings, solvent, rubber, adhesives, surfactants, and others. The polymers segment held the largest market share in 2023.
By end-use industry, the Asia Pacific petrochemicals market is categorized into packaging, automotive, construction, electrical & electronics, healthcare, agriculture, aerospace & defense, and others. The packaging segment held the largest market share in 2023.
Based on country, the Asia Pacific petrochemicals market is segmented into Australia, China, India, Japan, South Korea, and the Rest of Asia Pacific. China dominated the Asia Pacific petrochemicals market share in 2023.
Shell Plc, LyondellBasell Industries NV, Saudi Basic Industries Corp, BASF SE, INEOS Group Holdings SA, Dow Inc, Chevron Phillips Chemical Company LLC, China Petroleum & Chemical Corp, Mitsubishi Chemical Group Corp, and Exxon Mobil Corp are some of the leading players operating in the Asia Pacific petrochemicals market.
Table Of Contents
1. Introduction
- 1.1 The Insight Partners Research Report Guidance
- 1.2 Market Segmentation
2. Executive Summary
- 2.1 Key Insights
- 2.2 Market Attractiveness
3. Research Methodology
- 3.1 Secondary Research
- 3.2 Primary Research
- 3.2.1 Hypothesis formulation:
- 3.2.2 Macro-economic factor analysis:
- 3.2.3 Developing base number:
- 3.2.4 Data Triangulation:
- 3.2.5 Country level data:
4. Asia Pacific Petrochemicals Market Landscape
- 4.1 Overview
- 4.2 Porter's Five Forces Analysis
- 4.2.1 Bargaining Power of Suppliers
- 4.2.2 Bargaining Power of Buyers
- 4.2.3 Threat of New Entrants
- 4.2.4 Intensity of Competitive Rivalry
- 4.2.5 Threat of Substitutes
- 4.3 Ecosystem Analysis
- 4.3.1 Crude Oil and Feedstock Preparation
- 4.3.2 Petrochemicals Manufacturers
- 4.3.3 Distributors
- 4.3.4 End-Use Industry
- 4.3.5 List of Vendors in the Value Chain
5. Asia Pacific Petrochemicals Market - Key Market Dynamics
- 5.1 Petrochemicals Market - Key Market Dynamics
- 5.2 Market Drivers
- 5.2.1 Growth in the Packaging Industry
- 5.2.2 Surge in Demand for Polymers across Various End-Use Industries
- 5.3 Market Restraints
- 5.3.1 Fluctuations in the Crude Oil Prices
- 5.4 Market Opportunities
- 5.4.1 Growing Investments in Aerospace & Defense Industry
- 5.5 Future Trends
- 5.5.1 Development of Biodegradable Petrochemical-Based Products
- 5.6 Impact of Drivers and Restraints:
6. Petrochemicals Market - Asia Pacific Market Analysis
- 6.1 Petrochemicals Market Volume (Million Tons), 2021-2031
- 6.2 Petrochemicals Market Volume Forecast and Analysis (Million Tons)
- 6.3 Petrochemicals Market Revenue (US$ Billion), 2023-2031
- 6.4 Petrochemicals Market Forecast and Analysis
7. Asia Pacific Petrochemicals Market Volume and Revenue Analysis - by Type
- 7.1 Ethylene
- 7.1.1 Overview
- 7.1.2 Ethylene: Petrochemicals Market - Volume and Forecast to 2031 (Million Tons)
- 7.1.3 Ethylene: Petrochemicals Market - Revenue and Forecast to 2031 (US$ Billion)
- 7.2 Benzene
- 7.2.1 Overview
- 7.2.2 Benzene: Petrochemicals Market - Volume and Forecast to 2031 (Million Tons)
- 7.2.3 Benzene: Petrochemicals Market - Revenue and Forecast to 2031 (US$ Billion)
- 7.3 Propylene
- 7.3.1 Overview
- 7.3.2 Propylene: Petrochemicals Market - Volume and Forecast to 2031 (Million Tons)
- 7.3.3 Propylene: Petrochemicals Market - Revenue and Forecast to 2031 (US$ Billion)
- 7.4 Xylene
- 7.4.1 Overview
- 7.4.2 Xylene: Petrochemicals Market - Volume and Forecast to 2031 (Million Tons)
- 7.4.3 Xylene: Petrochemicals Market - Revenue and Forecast to 2031 (US$ Billion)
- 7.5 Others
- 7.5.1 Overview
- 7.5.2 Others: Petrochemicals Market - Volume and Forecast to 2031 (Million Tons)
- 7.5.3 Others: Petrochemicals Market - Revenue and Forecast to 2031 (US$ Billion)
8. Asia Pacific Petrochemicals Market Revenue Analysis - by Application
- 8.1 Polymers
- 8.1.1 Overview
- 8.1.2 Polymers: Petrochemicals Market - Revenue and Forecast to 2031 (US$ Billion)
- 8.2 Paints and Coatings
- 8.2.1 Overview
- 8.2.2 Paints and Coatings: Petrochemicals Market - Revenue and Forecast to 2031 (US$ Billion)
- 8.3 Solvent
- 8.3.1 Overview
- 8.3.2 Solvent: Petrochemicals Market - Revenue and Forecast to 2031 (US$ Billion)
- 8.4 Rubber
- 8.4.1 Overview
- 8.4.2 Rubber: Petrochemicals Market - Revenue and Forecast to 2031 (US$ Billion)
- 8.5 Adhesives
- 8.5.1 Overview
- 8.5.2 Adhesives: Petrochemicals Market - Revenue and Forecast to 2031 (US$ Billion)
- 8.6 Surfactants
- 8.6.1 Overview
- 8.6.2 Surfactants: Petrochemicals Market - Revenue and Forecast to 2031 (US$ Billion)
- 8.7 Others
- 8.7.1 Overview
- 8.7.2 Others: Petrochemicals Market - Revenue and Forecast to 2031 (US$ Billion)
9. Asia Pacific Petrochemicals Market Revenue Analysis - by End-use Industry
- 9.1 Packaging
- 9.1.1 Overview
- 9.1.2 Packaging: Petrochemicals Market - Revenue and Forecast to 2031 (US$ Billion)
- 9.2 Automotive
- 9.2.1 Overview
- 9.2.2 Automotive: Petrochemicals Market - Revenue and Forecast to 2031 (US$ Billion)
- 9.3 Construction
- 9.3.1 Overview
- 9.3.2 Construction: Petrochemicals Market - Revenue and Forecast to 2031 (US$ Billion)
- 9.4 Electrical and Electronics
- 9.4.1 Overview
- 9.4.2 Electrical and Electronics: Petrochemicals Market - Revenue and Forecast to 2031 (US$ Billion)
- 9.5 Healthcare
- 9.5.1 Overview
- 9.5.2 Healthcare: Petrochemicals Market - Revenue and Forecast to 2031 (US$ Billion)
- 9.6 Agriculture
- 9.6.1 Overview
- 9.6.2 Agriculture: Petrochemicals Market - Revenue and Forecast to 2031 (US$ Billion)
- 9.7 Aerospace and Defense
- 9.7.1 Overview
- 9.7.2 Aerospace and Defense: Petrochemicals Market - Revenue and Forecast to 2031 (US$ Billion)
- 9.8 Others
- 9.8.1 Overview
- 9.8.2 Others: Petrochemicals Market - Revenue and Forecast to 2031 (US$ Billion)
10. Asia Pacific Petrochemicals Market - Country Analysis
- 10.1 Asia Pacific
- 10.1.1 Asia Pacific Petrochemicals Market Overview
- 10.1.2 Asia Pacific Petrochemicals Market Revenue and Forecast and Analysis - by Country
- 10.1.2.1 Asia Pacific Petrochemicals Market Volume and Forecast and Analysis - by Country
- 10.1.2.2 Asia Pacific Petrochemicals Market Revenue and Forecast and Analysis - by Country
- 10.1.2.3 Australia Petrochemicals Market - Revenue and Forecast to 2031 (US$ Billion)
- 10.1.2.3.1 Australia Petrochemicals Market Breakdown by Type
- 10.1.2.3.2 Australia Petrochemicals Market Breakdown by Application
- 10.1.2.3.3 Australia Petrochemicals Market Breakdown by End-use Industry
- 10.1.2.4 China Petrochemicals Market - Revenue and Forecast to 2031 (US$ Billion)
- 10.1.2.4.1 China Petrochemicals Market Breakdown by Type
- 10.1.2.4.2 China Petrochemicals Market Breakdown by Application
- 10.1.2.4.3 China Petrochemicals Market Breakdown by End-use Industry
- 10.1.2.5 India Petrochemicals Market - Revenue and Forecast to 2031 (US$ Billion)
- 10.1.2.5.1 India Petrochemicals Market Breakdown by Type
- 10.1.2.5.2 India Petrochemicals Market Breakdown by Application
- 10.1.2.5.3 India Petrochemicals Market Breakdown by End-use Industry
- 10.1.2.6 Japan Petrochemicals Market - Revenue and Forecast to 2031 (US$ Billion)
- 10.1.2.6.1 Japan Petrochemicals Market Breakdown by Type
- 10.1.2.6.2 Japan Petrochemicals Market Breakdown by Application
- 10.1.2.6.3 Japan Petrochemicals Market Breakdown by End-use Industry
- 10.1.2.7 South Korea Petrochemicals Market - Revenue and Forecast to 2031 (US$ Billion)
- 10.1.2.7.1 South Korea Petrochemicals Market Breakdown by Type
- 10.1.2.7.2 South Korea Petrochemicals Market Breakdown by Application
- 10.1.2.7.3 South Korea Petrochemicals Market Breakdown by End-use Industry
- 10.1.2.8 Rest of Asia Pacific Petrochemicals Market - Revenue and Forecast to 2031 (US$ Billion)
- 10.1.2.8.1 Rest of Asia Pacific Petrochemicals Market Breakdown by Type
- 10.1.2.8.2 Rest of Asia Pacific Petrochemicals Market Breakdown by Application
- 10.1.2.8.3 Rest of Asia Pacific Petrochemicals Market Breakdown by End-use Industry
11. Competitive Landscape
- 11.1 Heat Map Analysis by Key Players
- 11.2 Company Positioning & Concentration
12. Industry Landscape
- 12.1 Overview
- 12.2 Market Initiative
- 12.3 Mergers & Acquisitions
13. Company Profiles
- 13.1 Shell Plc
- 13.1.1 Key Facts
- 13.1.2 Business Description
- 13.1.3 Products and Services
- 13.1.4 Financial Overview
- 13.1.5 SWOT Analysis
- 13.1.6 Key Developments
- 13.2 LyondellBasell Industries NV
- 13.2.1 Key Facts
- 13.2.2 Business Description
- 13.2.3 Products and Services
- 13.2.4 Financial Overview
- 13.2.5 SWOT Analysis
- 13.2.6 Key Developments
- 13.3 Saudi Basic Industries Corp
- 13.3.1 Key Facts
- 13.3.2 Business Description
- 13.3.3 Products and Services
- 13.3.4 Financial Overview
- 13.3.5 SWOT Analysis
- 13.3.6 Key Developments
- 13.4 BASF SE
- 13.4.1 Key Facts
- 13.4.2 Business Description
- 13.4.3 Products and Services
- 13.4.4 Financial Overview
- 13.4.5 SWOT Analysis
- 13.4.6 Key Developments
- 13.5 INEOS Group Holdings SA
- 13.5.1 Key Facts
- 13.5.2 Business Description
- 13.5.3 Products and Services
- 13.5.4 Financial Overview
- 13.5.5 SWOT Analysis
- 13.5.6 Key Developments
- 13.6 Dow Inc
- 13.6.1 Key Facts
- 13.6.2 Business Description
- 13.6.3 Products and Services
- 13.6.4 Financial Overview
- 13.6.5 SWOT Analysis
- 13.6.6 Key Developments
- 13.7 Chevron Phillips Chemical Company LLC.
- 13.7.1 Key Facts
- 13.7.2 Business Description
- 13.7.3 Products and Services
- 13.7.4 Financial Overview
- 13.7.5 SWOT Analysis
- 13.7.6 Key Developments
- 13.8 China Petroleum & Chemical Corp
- 13.8.1 Key Facts
- 13.8.2 Business Description
- 13.8.3 Products and Services
- 13.8.4 Financial Overview
- 13.8.5 SWOT Analysis
- 13.8.6 Key Developments
- 13.9 Mitsubishi Chemical Group Corp
- 13.9.1 Key Facts
- 13.9.2 Business Description
- 13.9.3 Products and Services
- 13.9.4 Financial Overview
- 13.9.5 SWOT Analysis
- 13.9.6 Key Developments
- 13.10 Exxon Mobil Corp
- 13.10.1 Key Facts
- 13.10.2 Business Description
- 13.10.3 Products and Services
- 13.10.4 Financial Overview
- 13.10.5 SWOT Analysis
- 13.10.6 Key Developments
14. Appendix
- 14.1 About The Insight Partners

