|
|
市場調査レポート
商品コード
1567816
アジア太平洋の研磨剤市場:2030年までの市場予測 - 地域分析 - 材質、タイプ、用途、販売チャネル別Asia Pacific Abrasive Market Forecast to 2030 - Regional Analysis - by Material, Type, Application, and Sales Channel |
||||||

|
|||||||
|
|||||||

| アジア太平洋の研磨剤市場:2030年までの市場予測 - 地域分析 - 材質、タイプ、用途、販売チャネル別 |
|
出版日: 2024年08月07日
発行: The Insight Partners
ページ情報: 英文 128 Pages
納期: 即納可能
|

全表示
- 概要
- 図表
- 目次
アジア太平洋の研磨剤市場は、2022年に212億8,050万米ドルと評価され、2030年には316億4,271万米ドルに達すると予測され、2022年から2030年までのCAGRは5.1%と推定されます。
電気・電子産業からの研磨剤需要の増加がアジア太平洋の研磨剤市場を押し上げる
砥粒は、実装、精密研削、研磨、生産ラップ、ウエハー研磨など、エレクトロニクスやフォトニクスのさまざまな用途で使用されています。エレクトロニクス産業では、テストや分析時の安定性を確保するため、実装装置には高い精度が要求されます。酸化アルミニウムと炭化ケイ素は、その高い硬度と寸法安定性により、一般的に実装工程で使用されます。また、炭化ホウ素は、低密度、高硬度、耐薬品性により、セラミックや半導体材料などの繊細な部品の実装に使用されています。電気自動車への移行や耐久消費財の需要増による電気・電子部品の販売増が、部品生産に必要な高効率材料の需要に拍車をかけています。
Parker Hannifin Corporationのレポートによると、コンピュータ数値制御(CNC)工作機械の世界市場は、2026年までに1,290億米ドルに達すると予測されています。中国は世界最大の電子機器製造拠点です。人件費の安さ、熟練労働者の確保、サプライチェーンの普及といった要因が、エレクトロニクス産業の成長を後押ししています。インド政府もまた、中国に代わる市場として同国を推進する積極的な姿勢を示しています。Invest Indiaによると、世界のエレクトロニクス製造サービス市場は2026年までに1兆1,450億米ドルに達し、2021~2026年のCAGRは5.4%を記録すると予想されています。India Brand Equity Foundationによると、インドの電子機器製造業は2025年までに5,200億米ドルに達すると予測されています。日本電子情報技術産業協会によると、世界の電子・IT産業の生産額は2023年には3兆5,266億米ドルに達すると予測されています。
アジア太平洋の研磨剤市場概要
アジア太平洋地域の市場は、自動車産業、海洋産業、航空宇宙産業、建設産業の加速によって牽引されています。アジア太平洋地域は自動車製造の中心地であり、国内外から多くの企業が進出しています。中国乗用車協会(China Passenger Car Association)が発表した報告書によると、2022年にテスラ・インクは8万3,135台の中国製電気自動車を納入しており、2021年と比較して電気自動車の販売が伸びていることを示しています。国際自動車製造者機構(OICA)によると、アジア・オセアニアの自動車生産台数は2021年の4,680万台から2022年には5,000万台に増加しました。自動車セクターの成長は、軽量素材と電気自動車の需要と相まって、これらの進化する要件に合わせた特殊研磨剤の利用をさらに促進しています。
さらに、アジア太平洋地域の建設ブームも大きな推進力となっています。持続可能な開発目標2030」の下、アジア開発銀行はアジア太平洋における強靭なインフラの構築、包括的で持続可能な工業化の促進、イノベーションの促進を計画しています。インフラ整備はアジア太平洋の多くの政府にとって焦点となっています。交通網、エネルギー施設、公共施設などの大規模プロジェクトへの投資が、建設資材の需要を牽引してきました。これらのプロジェクトは、交通の便を改善し、経済成長を促進し、全体的な生活の質を高めるために不可欠です。そのため、研磨剤はこうした重要なインフラ構想の計画と実行をサポートするために高い需要があります。DPIIT(Department for Promotion of Industry and Internal Trade)の報告書によると、インド政府は、開放的なFDI基準、インフラ部門への大規模な予算配分、スマートシティミッションなど、いくつかの政策を通じてインフラと建設サービスの強化を計画しています。また、同報告書によると、インドの不動産業界は2030年までに1兆米ドルに達し、インフラ設備投資額は前年比34%増の670万米ドルに達すると予測されています。現在進行中のインフラ開発と都市化プロジェクトに伴い、建設用途での研磨剤の需要が増加しています。コンクリート表面の整形や平滑化から金属構造物の切断や仕上げに至るまで、研磨剤は建設プロジェクトの品質と精度を高める上で重要な役割を果たしています。また、海上貿易と運輸部門の拡大に伴い、船舶の建造とメンテナンスのニーズが高まり、さまざまな用途の研磨剤需要が刺激されています。中国、日本、韓国は造船分野の主要国です。中華人民共和国国務院によると、2022年の中国の造船生産量は961万重量トン(dwt)で、前年比2.8ポイント増、世界全体の46.2%を占めました。研磨剤は、船舶部品の金属表面を平滑にし、研磨する上で重要な役割を果たしています。これは美観を保つためだけでなく、腐食を防ぎ、船舶の寿命を延ばすためにも不可欠です。船舶建造は複雑かつ大規模であるため、鋼鉄や様々な合金を含む造船に使用される多様なマテリアルに対応できる研磨剤が必要です。さらに、アジア太平洋の金属加工業界は、金属関連の製造工程が多様で広範囲に及ぶため、研磨剤の需要を牽引するもう一つの大きな力となっています。研磨剤は、粗いエッジを削ったり、厚い金属板を切断したり、複雑な部品を成形したりと、精密機械加工に不可欠です。金属加工作業におけるこの基本的な役割は、アジア太平洋地域における研磨剤の安定した需要に大きく貢献しています。
アジア太平洋の研磨剤市場の収益と2030年までの予測(金額)
アジア太平洋の研磨剤市場セグメンテーション
アジア太平洋の研磨剤市場は、材質、タイプ、用途、販売チャネル、国に分類されます。
材質別では、アジア太平洋の研磨剤市場は天然と合成に二分されます。2022年のアジア太平洋の研磨剤市場では、合成セグメントが大きなシェアを占めています。
タイプ別では、アジア太平洋の研磨剤市場はボンド研磨剤とコーティング研磨剤に二分されます。2022年のアジア太平洋の研磨剤市場では、ボンド研磨剤セグメントが大きなシェアを占めています。さらに、ボンド砥粒セグメントはディスク、ホイール、その他に細分化されます。さらに、コーティング研磨剤セグメントは、フラップディスク、ファイバーディスク、フックアループディスク、ベルト、ロール、その他に細分化されます。
用途別では、アジア太平洋の研磨剤市場は自動車、航空宇宙、海洋、金属加工、木工、電気・電子、その他に区分されます。2022年のアジア太平洋の研磨剤市場では、自動車分野が最大のシェアを占めています。
販売チャネルに基づき、アジア太平洋の研磨剤市場は直接と間接に二分されます。2022年のアジア太平洋の研磨剤市場では、間接部門が大きなシェアを占めています。
国別では、アジア太平洋の研磨剤市場はオーストラリア、インド、マレーシア、その他アジア太平洋地域に区分されます。その他アジア太平洋地域が2022年のアジア太平洋の研磨剤市場シェアを独占しました。
Deerfos Co.Ltd.、CUMI AWUKO Abrasives GmbH、Robert Bosch GmbH、Tyrolit Schleifmittelwerke Swarovski AG &Co KG、Sun Abrasives Co Ltd、Compagnie de Saint-Gobain S.A.、sia Abrasives Industries AG、RHODIUS Abrasives GmbH、3M Co.、Ekamant ABなどがアジア太平洋の研磨剤市場で事業を展開している主要企業です。
目次
第1章 イントロダクション
第2章 エグゼクティブサマリー
- 主要洞察
- 市場の魅力
第3章 調査手法
- 調査範囲
- 2次調査
- 1次調査
第4章 研磨剤市場情勢
- ポーターズ分析
- 供給企業の交渉力
- 買い手の交渉力
- 新規参入業者の脅威
- 競争企業間の敵対関係
- 代替品の脅威
- エコシステム分析
- 各種研磨メディアの特性
- バリューチェーンのベンダー一覧
第5章 アジア太平洋の研磨剤市場:主要市場力学
- 市場促進要因
- 成長する自動車産業と金属加工産業
- 電気・電子産業からの研磨剤需要の増加
- 市場抑制要因
- 原材料価格の変動
- 市場機会
- 自動化・ロボット用途での研磨剤の採用
- 今後の動向
- 持続可能な研磨剤の開発
- 促進要因と抑制要因の影響
第6章 研磨剤市場:アジア太平洋地域の分析
- 研磨剤市場の売上高、2020年~2030年
- 研磨剤市場の予測分析
第7章 アジア太平洋の研磨剤市場分析:材質別
- 天然
- 合成
第8章 アジア太平洋の研磨剤市場の分析:タイプ別
- ボンド砥粒
- コーティング砥粒
第9章 アジア太平洋の研磨剤市場分析:用途別
- 自動車
- 航空宇宙
- 海洋
- 金属加工
- 木工
- 電気・電子
- その他
第10章 アジア太平洋の研磨剤市場分析:販売チャネル別
- 直接
- 間接販売
第11章 アジア太平洋の研磨剤市場:国別分析
- アジア太平洋
- オーストラリア
- インド
- マレーシア
- その他アジア太平洋地域
第12章 競合情勢
- 主要企業によるヒートマップ分析
- 企業のポジショニングと集中度
第13章 業界情勢
- 製品発売
- 合併と買収
- 事業拡大
- その他の戦略と展開
第14章 企業プロファイル
- Deerfos Co., Ltd.
- CUMI AWUKO Abrasives GmbH
- Robert Bosch GmbH
- Tyrolit Schleifmittelwerke Swarovski AG & Co KG
- Sun Abrasives Co Ltd
- Compagnie de Saint-Gobain S.A.
- sia Abrasives Industries AG
- RHODIUS Abrasives GmbH
- 3M Co
- Ekamant AB
第15章 付録
List Of Tables
- Table 1. Asia Pacific Abrasive Market Segmentation
- Table 2. List of Vendors
- Table 3. Abrasive Market - Revenue and Forecast to 2030 (US$ Million)
- Table 4. Abrasive Market - Revenue and Forecast to 2030 (US$ Million) - by Material
- Table 5. Abrasive Market - Revenue and Forecast to 2030 (US$ Million) - by Type
- Table 6. Abrasive Market - Revenue and Forecast to 2030 (US$ Million) - by Application
- Table 7. Abrasive Market - Revenue and Forecast to 2030 (US$ Million) - by Sales Channel
- Table 8. Australia: Abrasive Market - Revenue and Forecast to 2030 (US$ Million) - by Material
- Table 9. Australia: Abrasive Market - Revenue and Forecast to 2030 (US$ Million) - by Type
- Table 10. Australia: Abrasive Market - Revenue and Forecast to 2030 (US$ Million) - by Application
- Table 11. Australia: Abrasive Market - Revenue and Forecast to 2030 (US$ Million) - by Sales Channel
- Table 12. India: Abrasive Market - Revenue and Forecast to 2030 (US$ Million) - by Material
- Table 13. India: Abrasive Market - Revenue and Forecast to 2030 (US$ Million) - by Type
- Table 14. India: Abrasive Market - Revenue and Forecast to 2030 (US$ Million) - by Application
- Table 15. India: Abrasive Market - Revenue and Forecast to 2030 (US$ Million) - by Sales Channel
- Table 16. Malaysia: Abrasive Market - Revenue and Forecast to 2030 (US$ Million) - by Material
- Table 17. Malaysia: Abrasive Market - Revenue and Forecast to 2030 (US$ Million) - by Type
- Table 18. Malaysia: Abrasive Market - Revenue and Forecast to 2030 (US$ Million) - by Application
- Table 19. Malaysia: Abrasive Market - Revenue and Forecast to 2030 (US$ Million) - by Sales Channel
- Table 20. Rest of Asia Pacific: Abrasive Market - Revenue and Forecast to 2030 (US$ Million) - by Material
- Table 21. Rest of Asia Pacific: Abrasive Market - Revenue and Forecast to 2030 (US$ Million) - by Type
- Table 22. Rest of Asia Pacific: Abrasive Market - Revenue and Forecast to 2030 (US$ Million) - by Application
- Table 23. Rest of Asia Pacific: Abrasive Market - Revenue and Forecast to 2030 (US$ Million) - by Sales Channel
List Of Figures
- Figure 1. Asia Pacific Abrasive Market Segmentation, by Country
- Figure 2. Abrasive Market - Porter's Analysis
- Figure 3. Ecosystem: Abrasive Market
- Figure 4. Abrasive Grain Processing
- Figure 5. Bonded Abrasive Product Manufacturing Process
- Figure 6. Coated Abrasive Product Manufacturing Process
- Figure 7. Abrasive Market - Key Market Dynamics
- Figure 8. Motor Vehicle Production, By Region (2019-2022)
- Figure 9. Production Value by the Global Electronics and IT Industries (2015-2023)
- Figure 10. Impact Analysis of Drivers and Restraints
- Figure 11. Abrasive Market Revenue (US$ Million), 2020-2030
- Figure 12. Abrasive Market Share (%) - by Material (2022 and 2030)
- Figure 13. Natural: Abrasive Market - Revenue and Forecast to 2030 (US$ Million)
- Figure 14. Synthetic: Abrasive Market - Revenue and Forecast to 2030 (US$ Million)
- Figure 15. Abrasive Market Share (%) - by Type (2022 and 2030)
- Figure 16. Bonded Abrasives: Abrasive Market - Revenue and Forecast to 2030 (US$ Million)
- Figure 17. Discs: Abrasive Market - Revenue and Forecast to 2030 (US$ Million)
- Figure 18. Wheels: Abrasive Market - Revenue and Forecast to 2030 (US$ Million)
- Figure 19. Others: Abrasive Market - Revenue and Forecast to 2030 (US$ Million)
- Figure 20. Coated Abrasives: Abrasive Market - Revenue and Forecast to 2030 (US$ Million)
- Figure 21. Flap Discs: Abrasive Market - Revenue and Forecast to 2030 (US$ Million)
- Figure 22. Fiber Discs: Abrasive Market - Revenue and Forecast to 2030 (US$ Million)
- Figure 23. Hook and Loop Discs: Abrasive Market - Revenue and Forecast to 2030 (US$ Million)
- Figure 24. Belts: Abrasive Market - Revenue and Forecast to 2030 (US$ Million)
- Figure 25. Rolls: Abrasive Market - Revenue and Forecast to 2030 (US$ Million)
- Figure 26. Others: Abrasive Market - Revenue and Forecast to 2030 (US$ Million)
- Figure 27. Abrasive Market Share (%) - by Application (2022 and 2030)
- Figure 28. Automotive: Abrasive Market - Revenue and Forecast to 2030 (US$ Million)
- Figure 29. Aerospace: Abrasive Market - Revenue and Forecast to 2030 (US$ Million)
- Figure 30. Marine: Abrasive Market - Revenue and Forecast to 2030 (US$ Million)
- Figure 31. Metal Fabrication: Abrasive Market - Revenue and Forecast to 2030 (US$ Million)
- Figure 32. Woodworking: Abrasive Market - Revenue and Forecast to 2030 (US$ Million)
- Figure 33. Electrical and Electronics: Abrasive Market - Revenue and Forecast to 2030 (US$ Million)
- Figure 34. Others: Abrasive Market - Revenue and Forecast to 2030 (US$ Million)
- Figure 35. Abrasive Market Share (%) - by Sales Channel (2022 and 2030)
- Figure 36. Direct: Abrasive Market - Revenue and Forecast to 2030 (US$ Million)
- Figure 37. Indirect: Abrasive Market - Revenue and Forecast to 2030 (US$ Million)
- Figure 38. Asia Pacific: Abrasive Market, By Key Country - Revenue 2022 (US$ Million)
- Figure 39. Asia Pacific: Abrasive Market Breakdown, by Key Countries, 2022 and 2030 (%)
- Figure 40. Australia: Abrasive Market - Revenue and Forecast to 2030 (US$ Million)
- Figure 41. India: Abrasive Market - Revenue and Forecast to 2030 (US$ Million)
- Figure 42. Malaysia: Abrasive Market - Revenue and Forecast to 2030 (US$ Million)
- Figure 43. Rest of Asia Pacific: Abrasive Market - Revenue and Forecast to 2030 (US$ Million)
- Figure 44. Heat Map Analysis by Key Players
- Figure 45. Company Positioning & Concentration
The Asia Pacific abrasive market was valued at US$ 21,280.50 million in 2022 and is expected to reach US$ 31,642.71 million by 2030; it is estimated to register a CAGR of 5.1% from 2022 to 2030.
Rising Demand for Abrasives from Electrical and Electronics Industry Boosts Asia Pacific Abrasive Market
Abrasives are used in a variety of electronics and photonics applications such as mounting, precision grinding, polishing, production lapping, and wafer polishing. In the electronics industry, mounting devices require high precision to ensure their stability during testing and analysis. Aluminum oxide and silicon carbide are generally used in mounting processes due to their high hardness and dimensional stability. Boron carbide is also used for mounting sensitive components such as ceramics and semiconductor materials due to its low density, high hardness, and chemical resistance. The rising sales of electrical and electronic components due to the transition toward electric vehicles and growing demand for electronic consumer durables have fueled the demand for high-efficiency materials required for component production.
As per the Parker Hannifin Corporation report, the global market for computer numerically controlled (CNC) machine tools is projected to reach US$ 129 billion by 2026. China is the largest manufacturing hub of electronics in the world. Factors such as low labor costs, availability of skilled labor, and prevalent supply chains are driving the growth of the electronics industry. The government of India is also showing an aggressive approach to promoting the country as an alternative market to China. According to Invest India, the global electronics manufacturing services market is anticipated to reach US$ 1,145 billion by 2026, recording a CAGR of 5.4% during 2021-2026. The India Brand Equity Foundation states that the Indian electronics manufacturing industry is projected to reach US$ 520 billion by 2025. According to the Japan Electronics and Information Technology Industries Association, the production by the global electronics and IT industries was projected to reach US$ 3,526.6 billion in 2023.
Asia Pacific Abrasive Market Overview
The market in Asia Pacific is driven by accelerating automotive, marine, aerospace, and construction industries. Asia Pacific is a hub for automotive manufacturing with a large presence of international and domestic players operating in the region. According to a report published by the China Passenger Car Association, in 2022, Tesla Inc delivered 83,135 made-in-China electric vehicles, indicating growth in sales of electric vehicles compared to 2021. According to the Organisation Internationale des Constructeurs d'Automobiles (OICA), Asia-Oceania's vehicle production increased from 46.8 million in 2021 to 50 million in 2022. The automotive sector's growth, coupled with the demand for lightweight materials and electrical vehicles, further propels the utilization of specialized abrasives tailored to these evolving requirements.
Moreover, the construction boom in Asia Pacific is another major driver. Under the Sustainable Development Goals 2030, the Asian Development Bank has planned to build resilient infrastructure, promote inclusive and sustainable industrialization, and foster innovation in Asia Pacific. Infrastructure development has been a focal point for many governments across Asia Pacific. Investments in large-scale projects, such as transportation networks, energy facilities, and public amenities, have driven demand for construction materials. These projects are essential for improving connectivity, fostering economic growth, and enhancing the overall quality of life. As a result, abrasives are in high demand to support the planning and execution of these vital infrastructure initiatives. According to the report by the Department for Promotion of Industry and Internal Trade (DPIIT), the Government of India has planned to boost the infrastructure and construction services through several policies such as open FDI norms, large budget allocation to the infrastructure sector, and smart cities mission. The report also stated that the real estate industry in India is projected to reach US$ 1 trillion by 2030, along with an increased year-on-year infrastructure Capex by 34% to reach US$ 6.7 million. With ongoing infrastructure development and urbanization projects, there is an increased requirement for abrasives in construction applications. From shaping and smoothing concrete surfaces to cutting and finishing metal structures, abrasives play a vital role in enhancing the quality and precision of construction projects. In addition, as the maritime trade and transportation sectors expand, there is an increasing need for ship construction and maintenance, stimulating the demand for abrasives in various applications. China, Japan, and South Korea are leading countries in the shipbuilding sector. According to the States Council of the People's Republic of China, the shipbuilding output of China was 9.61 million deadweight tons (dwt) in 2022, i.e., up by 2.8 percentage points year-on-year, accounting for 46.2% of the global total. Abrasives play a crucial role in smoothing and polishing the metal surfaces of ship components. This is essential not only for aesthetic purposes but also for preventing corrosion and ensuring the longevity of the vessels. The intricate and large-scale nature of ship construction requires abrasives that can handle diverse materials used in shipbuilding, including steel and various alloys. Furthermore, Asia Pacific's metalworking industry is another major force driving the demand for abrasives due to the diverse and expansive nature of metal-related manufacturing processes across the region. Abrasives are indispensable for precision machining, whether grinding down rough edges, cutting through thick metal sheets, or shaping intricate parts. This foundational role in metalworking operations contributes significantly to the consistent demand for abrasives in Asia Pacific.
Asia Pacific Abrasive Market Revenue and Forecast to 2030 (US$ Million)
Asia Pacific Abrasive Market Segmentation
The Asia Pacific abrasive market is categorized into material, type, application, sales channel, and country.
By material, the Asia Pacific abrasive market is bifurcated into natural and synthetic. The synthetic segment held a larger share of Asia Pacific abrasive market in 2022.
In terms of type, the Asia Pacific abrasive market is bifurcated into bonded abrasives and coated abrasives. The bonded abrasives segment held a larger share of Asia Pacific abrasive market in 2022. Furthermore, the bonded abrasives segment is subcategorized into discs, wheels, and others. Additionally, the coated abrasives segment is subcategorized into flap discs, fiber discs, hook a loop discs, belts, rolls, and others.
By application, the Asia Pacific abrasive market is segmented into automotive, aerospace, marine, metal fabrication, woodworking, electrical & electronics, and others. The automotive segment held the largest share of Asia Pacific abrasive market in 2022.
Based on sales channel, the Asia Pacific abrasive market is bifurcated into direct and indirect. The indirect segment held a larger share of Asia Pacific abrasive market in 2022.
By country, the Asia Pacific abrasive market is segmented into Australia, India, Malaysia, and the Rest of Asia Pacific. The Rest of Asia Pacific dominated the Asia Pacific abrasive market share in 2022.
Deerfos Co., Ltd; CUMI AWUKO Abrasives GmbH; Robert Bosch GmbH; Tyrolit Schleifmittelwerke Swarovski AG & Co KG; Sun Abrasives Co Ltd; Compagnie de Saint-Gobain S.A.; sia Abrasives Industries AG; RHODIUS Abrasives GmbH; 3M Co; and Ekamant AB are some of the leading companies operating in the Asia Pacific abrasive market.
Table Of Contents
1. Introduction
- 1.1 The Insight Partners Research Report Guidance
- 1.2 Market Segmentation
2. Executive Summary
- 2.1 Key Insights
- 2.2 Market Attractiveness
3. Research Methodology
- 3.1 Coverage
- 3.2 Secondary Research
- 3.3 Primary Research
4. Abrasive Market Landscape
- 4.1 Overview
- 4.2 Porters Analysis
- 4.2.1 Bargaining Power of Suppliers
- 4.2.2 Bargaining Power of Buyers
- 4.2.3 Threat of New Entrants
- 4.2.4 Intensity of Competitive Rivalry
- 4.2.5 Threat of Substitutes
- 4.3 Ecosystem Analysis
- 4.3.1 Properties of Different Abrasive Media Types
- 4.3.2 List of Vendors in the Value Chain
5. Asia Pacific Abrasive Market - Key Market Dynamics
- 5.1 Market Drivers
- 5.1.1 Growing Automotive and Metal Fabrication Industry
- 5.1.2 Rising Demand for Abrasives from Electrical and Electronics Industry
- 5.2 Market Restraints
- 5.2.1 Fluctuations in Raw Material Prices
- 5.3 Market Opportunities
- 5.3.1 Adoption of Abrasives in Automation and Robotic Applications
- 5.4 Future Trends
- 5.4.1 Development of Sustainable Abrasives
- 5.5 Impact of Drivers and Restraints:
6. Abrasive Market -Asia Pacific Analysis
- 6.1 Overview
- 6.2 Abrasive Market Revenue (US$ Million), 2020-2030
- 6.3 Abrasive Market Forecast Analysis
7. Asia Pacific Abrasive Market Analysis - by Material
- 7.1 Natural
- 7.1.1 Overview
- 7.1.2 Natural: Abrasive Market - Revenue and Forecast to 2030 (US$ Million)
- 7.2 Synthetic
- 7.2.1 Overview
- 7.2.2 Synthetic: Abrasive Market - Revenue and Forecast to 2030 (US$ Million)
8. Asia Pacific Abrasive Market Analysis - by Type
- 8.1 Bonded Abrasives
- 8.1.1 Overview
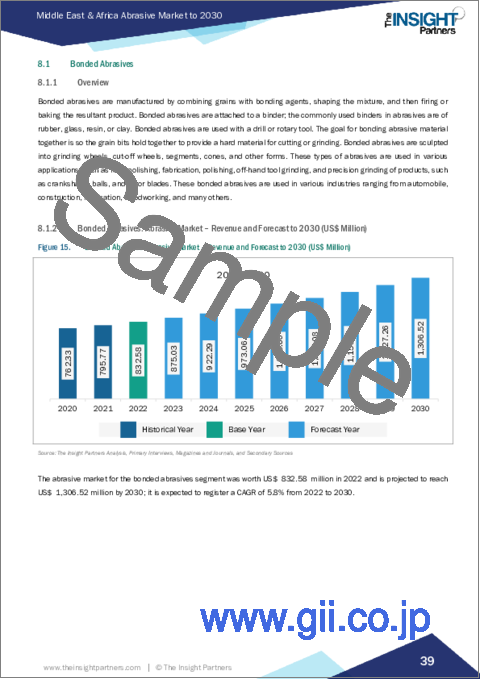
- 8.1.2 Bonded Abrasives: Abrasive Market - Revenue and Forecast to 2030 (US$ Million)
- 8.1.3 Discs
- 8.1.3.1 Overview
- 8.1.3.2 Discs: Abrasive Market - Revenue and Forecast to 2030 (US$ Million)
- 8.1.4 Wheels
- 8.1.4.1 Overview
- 8.1.4.2 Wheels: Abrasive Market - Revenue and Forecast to 2030 (US$ Million)
- 8.1.5 Others
- 8.1.5.1 Overview
- 8.1.5.2 Others: Abrasive Market - Revenue and Forecast to 2030 (US$ Million)
- 8.2 Coated Abrasives
- 8.2.1 Overview
- 8.2.1.1 Coated Abrasives: Abrasive Market - Revenue and Forecast to 2030 (US$ Million)
- 8.2.2 Flap Discs
- 8.2.2.1 Overview
- 8.2.2.2 Flap Discs: Abrasive Market - Revenue and Forecast to 2030 (US$ Million)
- 8.2.3 Fiber Discs
- 8.2.3.1 Overview
- 8.2.3.2 Fiber Discs: Abrasive Market - Revenue and Forecast to 2030 (US$ Million)
- 8.2.4 Hook and Loop Discs
- 8.2.4.1 Overview
- 8.2.4.2 Hook and Loop Discs: Abrasive Market - Revenue and Forecast to 2030 (US$ Million)
- 8.2.5 Belts
- 8.2.5.1 Overview
- 8.2.5.2 Belts: Abrasive Market - Revenue and Forecast to 2030 (US$ Million)
- 8.2.6 Rolls
- 8.2.6.1 Overview
- 8.2.6.2 Rolls: Abrasive Market - Revenue and Forecast to 2030 (US$ Million)
- 8.2.7 Others
- 8.2.7.1 Overview
- 8.2.7.2 Others: Abrasive Market - Revenue and Forecast to 2030 (US$ Million)
- 8.2.1 Overview
9. Asia Pacific Abrasive Market Analysis - by Application
- 9.1 Automotive
- 9.1.1 Overview
- 9.1.2 Automotive: Abrasive Market - Revenue and Forecast to 2030 (US$ Million)
- 9.2 Aerospace
- 9.2.1 Overview
- 9.2.2 Aerospace: Abrasive Market - Revenue and Forecast to 2030 (US$ Million)
- 9.3 Marine
- 9.3.1 Overview
- 9.3.2 Marine: Abrasive Market - Revenue and Forecast to 2030 (US$ Million)
- 9.4 Metal Fabrication
- 9.4.1 Overview
- 9.4.2 Metal Fabrication: Abrasive Market - Revenue and Forecast to 2030 (US$ Million)
- 9.5 Woodworking
- 9.5.1 Overview
- 9.5.2 Woodworking: Abrasive Market - Revenue and Forecast to 2030 (US$ Million)
- 9.6 Electrical and Electronics
- 9.6.1 Overview
- 9.6.2 Electrical and Electronics: Abrasive Market - Revenue and Forecast to 2030 (US$ Million)
- 9.7 Others
- 9.7.1 Overview
- 9.7.2 Others: Abrasive Market - Revenue and Forecast to 2030 (US$ Million)
10. Asia Pacific Abrasive Market Analysis - by Sales Channel
- 10.1 Direct
- 10.1.1 Overview
- 10.1.2 Direct: Abrasive Market - Revenue and Forecast to 2030 (US$ Million)
- 10.2 Indirect
- 10.2.1 Overview
- 10.2.2 Indirect: Abrasive Market - Revenue and Forecast to 2030 (US$ Million)
11. Asia Pacific Abrasive Market - Country Analysis
- 11.1 Asia Pacific
- 11.1.1 Asia Pacific: Abrasive Market - Revenue and Forecast Analysis - by Country
- 11.1.1.1 Australia: Abrasive Market - Revenue and Forecast to 2030 (US$ Million)
- 11.1.1.1.1 Australia: Abrasive Market Breakdown, by Material
- 11.1.1.1.2 Australia: Abrasive Market Breakdown, by Type
- 11.1.1.1.3 Australia: Abrasive Market Breakdown, by Application
- 11.1.1.1.4 Australia: Abrasive Market Breakdown, by Sales Channel
- 11.1.1.2 India: Abrasive Market - Revenue and Forecast to 2030 (US$ Million)
- 11.1.1.2.1 India: Abrasive Market Breakdown, by Material
- 11.1.1.2.2 India: Abrasive Market Breakdown, by Type
- 11.1.1.2.3 India: Abrasive Market Breakdown, by Application
- 11.1.1.2.4 India: Abrasive Market Breakdown, by Sales Channel
- 11.1.1.3 Malaysia: Abrasive Market - Revenue and Forecast to 2030 (US$ Million)
- 11.1.1.3.1 Malaysia: Abrasive Market Breakdown, by Material
- 11.1.1.3.2 Malaysia: Abrasive Market Breakdown, by Type
- 11.1.1.3.3 Malaysia: Abrasive Market Breakdown, by Application
- 11.1.1.3.4 Malaysia: Abrasive Market Breakdown, by Sales Channel
- 11.1.1.4 Rest of Asia Pacific: Abrasive Market - Revenue and Forecast to 2030 (US$ Million)
- 11.1.1.4.1 Rest of Asia Pacific: Abrasive Market Breakdown, by Material
- 11.1.1.4.2 Rest of Asia Pacific: Abrasive Market Breakdown, by Type
- 11.1.1.4.3 Rest of Asia Pacific: Abrasive Market Breakdown, by Application
- 11.1.1.4.4 Rest of Asia Pacific: Abrasive Market Breakdown, by Sales Channel
- 11.1.1.1 Australia: Abrasive Market - Revenue and Forecast to 2030 (US$ Million)
- 11.1.1 Asia Pacific: Abrasive Market - Revenue and Forecast Analysis - by Country
12. Competitive Landscape
- 12.1 Heat Map Analysis by Key Players
- 12.2 Company Positioning & Concentration
13. Industry Landscape
- 13.1 Overview
- 13.2 Product launch
- 13.3 Mergers and Acquisitions
- 13.4 Expansion
- 13.5 Other Strategies and Developments
14. Company Profiles
- 14.1 Deerfos Co., Ltd.
- 14.1.1 Key Facts
- 14.1.2 Business Description
- 14.1.3 Products and Services
- 14.1.4 Financial Overview
- 14.1.5 SWOT Analysis
- 14.1.6 Key Developments
- 14.2 CUMI AWUKO Abrasives GmbH
- 14.2.1 Key Facts
- 14.2.2 Business Description
- 14.2.3 Products and Services
- 14.2.4 Financial Overview
- 14.2.5 SWOT Analysis
- 14.2.6 Key Developments
- 14.3 Robert Bosch GmbH
- 14.3.1 Key Facts
- 14.3.2 Business Description
- 14.3.3 Products and Services
- 14.3.4 Financial Overview
- 14.3.5 SWOT Analysis
- 14.3.6 Key Developments
- 14.4 Tyrolit Schleifmittelwerke Swarovski AG & Co KG
- 14.4.1 Key Facts
- 14.4.2 Business Description
- 14.4.3 Products and Services
- 14.4.4 Financial Overview
- 14.4.5 SWOT Analysis
- 14.4.6 Key Developments
- 14.5 Sun Abrasives Co Ltd
- 14.5.1 Key Facts
- 14.5.2 Business Description
- 14.5.3 Products and Services
- 14.5.4 Financial Overview
- 14.5.5 SWOT Analysis
- 14.5.6 Key Developments
- 14.6 Compagnie de Saint-Gobain S.A.
- 14.6.1 Key Facts
- 14.6.2 Business Description
- 14.6.3 Products and Services
- 14.6.4 Financial Overview
- 14.6.5 SWOT Analysis
- 14.6.6 Key Developments
- 14.7 sia Abrasives Industries AG
- 14.7.1 Key Facts
- 14.7.2 Business Description
- 14.7.3 Products and Services
- 14.7.4 Financial Overview
- 14.7.5 SWOT Analysis
- 14.7.6 Key Developments
- 14.8 RHODIUS Abrasives GmbH
- 14.8.1 Key Facts
- 14.8.2 Business Description
- 14.8.3 Products and Services
- 14.8.4 Financial Overview
- 14.8.5 SWOT Analysis
- 14.8.6 Key Developments
- 14.9 3M Co
- 14.9.1 Key Facts
- 14.9.2 Business Description
- 14.9.3 Products and Services
- 14.9.4 Financial Overview
- 14.9.5 SWOT Analysis
- 14.9.6 Key Developments
- 14.10 Ekamant AB
- 14.10.1 Key Facts
- 14.10.2 Business Description
- 14.10.3 Products and Services
- 14.10.4 Financial Overview
- 14.10.5 SWOT Analysis
- 14.10.6 Key Developments
15. Appendix
- 15.1 About the Insight Partners
