|
|
市場調査レポート
商品コード
1562422
北米のガスパイプラインインフラ:2030年市場予測- 地域別分析- 事業別、設備別、用途別North America Gas Pipeline Infrastructure Market Forecast to 2030 - Regional Analysis - by Operation (Transmission and Distribution), Equipment (Pipeline, Compressor Station, Metering Skids, and Others), and Application (Onshore and Offshore) |
||||||

|
|||||||
|
|||||||


| 北米のガスパイプラインインフラ:2030年市場予測- 地域別分析- 事業別、設備別、用途別 |
|
出版日: 2024年07月04日
発行: The Insight Partners
ページ情報: 英文 80 Pages
納期: 即納可能
|

全表示
- 概要
- 図表
- 目次
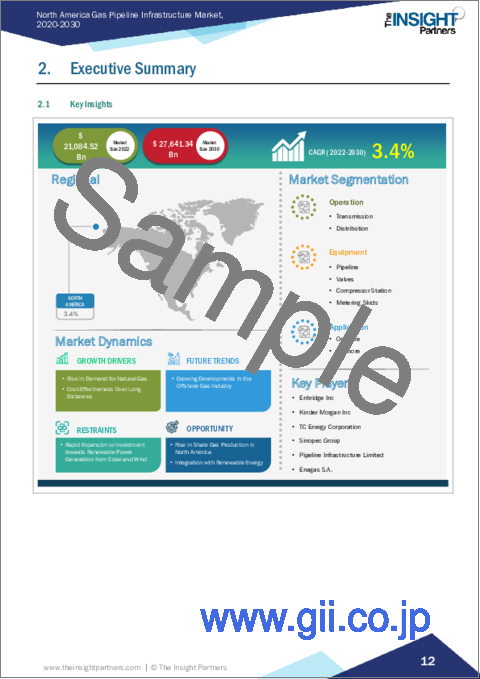
北米のガスパイプラインインフラ市場は、2022年の21兆845億2,000万米ドルから2030年には27兆6,413億4,000万米ドルに成長すると予想されています。2022~2030年のCAGRは3.4%を記録すると推定されます。
オフショアガス産業の発展が北米のガスパイプラインインフラ市場を促進
オフショアガスパイプラインインフラ開発への投資と注力は、世界中で拡大しています。例えば、2023年、トリニダード・トバゴは、ベネズエラ領海に位置する重要なガス田を開発する許可をバイデン政権から与えられました。このように、オフショアガスパイプラインインフラ整備のための投資が増加しており、予測期間中のガスパイプラインインフラ市場の成長を促進すると予想されます。
北米のガスパイプラインインフラ市場概要
北米は主要なガス輸出国のひとつです。エネルギー需要の高まりと天然ガスの用途拡大が、北米のガスパイプラインインフラ市場の発展を後押ししています。2022年には、米国が最も高い天然ガス生産能力を示し、カナダ、メキシコがこれに続いた。Ixachi、Coulomb Phase 2、Quesqui、Nejo(IEPC)、Leo、May、Koban、Powerballは北米の天然ガス生産鉱区の一部です。イクサチ工場はメキシコのベラクルス州にあり、2022年には618.09mmcfd(100万立方フィート/日)を生産しました。クーロン・フェーズ2油田はシェルが所有する油田で、米国中央計画地域に位置します。2022年の生産量は72.72mmcfd。ケスキ油田はメキシコのタバスコ州にあり、ペトロレオス・メヒカノスが運営しています。2022年の生産量は485mmcfdとなっています。また、ガスパイプラインインフラの開発に対する政府の取り組みや資金提供の増加は、予測期間中にガスパイプラインインフラの市場を押し上げると予想されます。米国の天然ガスパイプラインネットワークは、地域全体で天然ガスを伝送する実質的に統合されたネットワークです。パイプラインインフラには、天然ガス生産地や貯蔵施設と主要消費者を結ぶ、300万マイルに及ぶ幹線パイプラインやその他のパイプラインがあります。2021年、この天然ガストランスミッション・ネットワークは、約27兆6,000億立方フィートの天然ガスを7,770万人の消費者に輸送しました。米国メキシコ湾岸では、予測期間中に20以上のLNGターミナル・プロジェクトと2,200km以上のパイプラインが計画中または建設中であり、優良ガスインフラの著しい成長が見込まれています。さらに、ロシア・ウクライナ戦争中、多くの国がロシアの石油・ガス事業との取引を中止し、その結果、ガスの輸入先がロシアから米国にシフトしました。その後のガス需要の増加により、米国全域でのガス生産事業がさらに強化され、米国のガスパイプラインインフラ市場の成長を後押ししています。
北米のガスパイプラインインフラ市場の収益と2030年までの予測(10億米ドル)
北米のガスパイプラインインフラ市場のセグメンテーション
北米のガスパイプラインインフラ市場は、事業、設備、用途、国に区分されます。
北米のガスパイプラインインフラ市場は、事業に基づき、トランスミッションとディストリビューションに二分されます。2022年の北米のガスパイプラインインフラ市場では、配給セグメントが大きなシェアを占めています。
設備面では、北米のガスパイプラインインフラ市場はパイプライン、コンプレッサーステーション、計量スキッド、バルブに分類されます。パイプラインセグメントは2022年に北米のガスパイプラインインフラ市場で最大のシェアを占めました。
用途に基づき、北米のガスパイプラインインフラ市場は陸上と海洋に二分されます。2022年の北米のガスパイプラインインフラ市場では陸上セグメントが大きなシェアを占めています。
国別では、北米のガスパイプラインインフラ市場は米国、カナダ、メキシコに区分されます。米国は2022年の北米のガスパイプラインインフラ市場を独占しました。
Enbridge Inc、TC Energy Corp、Berkshire Hathaway Inc、Kinder Morgan Inc、Pembina Pipeline Corpなどが北米のガスパイプラインインフラ市場で事業を展開する主要企業です。
目次
第1章 イントロダクション
第2章 エグゼクティブサマリー
- 主要洞察
- 市場の魅力
第3章 調査手法
- 調査範囲
- 2次調査
- 1次調査
第4章 ガスパイプラインインフラ市場情勢
- イントロダクション
- エコシステム分析
- 発電
- 送電
- 配電
- エンドユーザー
第5章 北米のガスパイプラインインフラ市場:主要産業力学
- 市場促進要因
- 天然ガス需要の増加
- 長距離における費用対効果
- 市場抑制要因
- 太陽光発電と風力発電による再生可能エネルギーへの急速な投資拡大
- 市場機会
- 北米におけるシェールガス生産の増加
- 再生可能エネルギーとの統合
- 市場動向
- オフショアガス産業の発展
- 促進要因と抑制要因の影響
第6章 ガスパイプラインインフラ市場:北米市場分析
- ガスパイプラインインフラストラクチャ市場の収益(2020~2030年)
- ガスパイプラインインフラ市場の予測と分析
第7章 北米のガスパイプラインインフラ市場分析:事業
- イントロダクション
- ガスパイプラインインフラ市場:事業別(2022年、2030年)
- 送電
- 送電市場、収益と2030年までの予測
- 配電
- 配電市場、収益と2030年までの予測
第8章 北米のガスパイプラインインフラ市場分析:設備
- イントロダクション
- ガスパイプラインインフラ市場:設備別(2022年、2030年)
- パイプライン
- パイプライン概要
- パイプライン市場:収益と2030年までの予測
- バルブ
- バルブ概要
- バルブ市場、収益と2030年までの予測
- コンプレッサーステーション
- コンプレッサーステーション概要
- コンプレッサーステーション市場、収益と2030年までの予測
- 計量スキッド
- 計量スキッド市場、収益と2030年までの予測
第9章 北米のガスパイプラインインフラ市場分析:用途
- イントロダクション
- ガスパイプラインインフラ市場:用途別(2022年、2030年)
- オンショア
- オンショア
- オンショア市場の収益と2030年までの予測
- オフショア
- オフショア概要
- オフショア市場、収益と2030年までの予測
第10章 北米のガスパイプラインインフラ市場:国別分析
- 北米市場概要
- 米国
- カナダ
- メキシコ
第11章 業界情勢
- イントロダクション
- 市場イニシアティブ
- 合併と買収
第12章 企業プロファイル
- Enbridge Inc
- TC Energy Corp
- Berkshire Hathaway Inc
- Kinder Morgan Inc
- Pembina Pipeline Corp
- Saipem SpA
第13章 付録
List Of Tables
- Table 1. Gas Pipeline Infrastructure Market Segmentation
- Table 2. Gas Pipeline Infrastructure Market Revenue and Forecasts to 2030 (US$ Billion)
- Table 3. Gas Pipeline Infrastructure Market Revenue and Forecasts to 2030 (US$ Billion) - Operation
- Table 4. Gas Pipeline Infrastructure Market Revenue and Forecasts to 2030 (US$ Billion) - Equipment
- Table 5. Gas Pipeline Infrastructure Market Revenue and Forecasts to 2030 (US$ Billion) - Application
- Table 6. North America Gas Pipeline Infrastructure Market Revenue and Forecasts to 2030 (US$ Bn) - By Country
- Table 7. US Gas Pipeline Infrastructure Market Revenue and Forecasts to 2030 (US$ Bn) - By Operation
- Table 8. US Gas Pipeline Infrastructure Market Revenue and Forecasts to 2030 (US$ Bn) - By Equipment
- Table 9. US Gas Pipeline Infrastructure Market Revenue and Forecasts to 2030 (US$ Bn) - By Application
- Table 10. Canada Gas Pipeline Infrastructure Market Revenue and Forecasts to 2030 (US$ Bn) - By Operation
- Table 11. Canada Gas Pipeline Infrastructure Market Revenue and Forecasts to 2030 (US$ Bn) - By Equipment
- Table 12. Canada Gas Pipeline Infrastructure Market Revenue and Forecasts to 2030 (US$ Bn) - By Application
- Table 13. Mexico Gas Pipeline Infrastructure Market Revenue and Forecasts to 2030 (US$ Bn) - By Operation
- Table 14. Mexico Gas Pipeline Infrastructure Market Revenue and Forecasts to 2030 (US$ Bn) - By Equipment
- Table 15. Mexico Gas Pipeline Infrastructure Market Revenue and Forecasts to 2030 (US$ Bn) - By Application
- Table 16. List of Abbreviation
List Of Figures
- Figure 1. Gas Pipeline Infrastructure Market Segmentation, By Country
- Figure 2. Ecosystem: Gas pipeline infrastructure market
- Figure 3. Gas Pipeline Infrastructure Market - Key Industry Dynamics
- Figure 4. Impact Analysis of Drivers and Restraints
- Figure 5. Gas Pipeline Infrastructure Market Revenue (US$ Billion), 2020 - 2030
- Figure 6. Gas Pipeline Infrastructure Market Share (%) - Operation, 2022 and 2030
- Figure 7. Transmission Market Revenue and Forecasts to 2030 (US$ Billion)
- Figure 8. Distribution Market Revenue and Forecasts to 2030 (US$ Billion)
- Figure 9. Gas Pipeline Infrastructure Market Share (%) - Equipment, 2022 and 2030
- Figure 10. Pipeline Market Revenue and Forecasts to 2030 (US$ Billion)
- Figure 11. Valves Market Revenue and Forecasts to 2030 (US$ Billion)
- Figure 12. Compressor station Market Revenue and Forecasts to 2030 (US$ Billion)
- Figure 13. Metering skids Market Revenue and Forecasts to 2030 (US$ Billion)
- Figure 14. Gas Pipeline Infrastructure Market Share (%) - Application, 2022 and 2030
- Figure 15. Onshore Market Revenue and Forecasts to 2030 (US$ Billion)
- Figure 16. Offshore Market Revenue and Forecasts to 2030 (US$ Billion)
- Figure 17. North America Gas Pipeline Infrastructure Market, By Key Country - Revenue 2022 (US$ Bn)
- Figure 18. North America Gas Pipeline Infrastructure Market Breakdown by Country (2022 and 2030)
- Figure 19. US Gas Pipeline Infrastructure Market Revenue and Forecasts to 2030 (US$ Bn)
- Figure 20. Canada Gas Pipeline Infrastructure Market Revenue and Forecasts to 2030 (US$ Bn)
- Figure 21. Mexico Gas Pipeline Infrastructure Market Revenue and Forecasts to 2030 (US$ Bn)
The North America gas pipeline infrastructure market is expected to grow from US$ 21,084.52 billion in 2022 to US$ 27,641.34 billion by 2030. It is estimated to record a CAGR of 3.4% from 2022 to 2030.
Growing Developments in the Offshore Gas Industry Fuel North America Gas Pipeline Infrastructure Market
Investment and focus on offshore gas pipeline infrastructure development are growing across the globe. For instance, in 2023, Trinidad and Tobago were given permission by the Biden administration to exploit a significant gas field situated in the Venezuelan territorial seas. Thus, growing investment for the development of offshore gas pipeline infrastructure is anticipated to fuel the growth of the gas pipeline infrastructure market during the forecast period.
North America Gas Pipeline Infrastructure Market Overview
North America is one of the leading gas exporters. The mounting demand for energy and the growing application of natural gas are boosting the market development of gas pipeline infrastructure in North America. In 2022, the US showcased the highest natural gas production capacity, followed by Canada and Mexico. Ixachi, Coulomb Phase 2, Quesqui, Nejo (IEPC), Leo, May, Koban, and Powerball are a few of the natural gas-producing fields in North America. The Ixachi plant is in Veracruz, Mexico, and it produced 618.09mmcfd (million cubic feet per day) in 2022. The Coulomb Phase 2 field is owned by Shell and located in the Central Planning Area, the US. The field produced 72.72mmcfd in 2022. Quesqui Field is in Tabasco, Mexico, and is operated by Petroleos Mexicanos. The field produced 485mmcfd in 2022. Also, the growing number of government initiatives and funding for the development of gas pipeline infrastructure is anticipated to boost the market for gas pipeline infrastructure over the forecast period. The natural gas pipeline network in the US is a substantially integrated network that transmits natural gas across the region. The pipeline infrastructure has ~3 million miles of mainline and other pipelines that connect natural gas production sites and storage facilities with primary consumers. In 2021, this natural gas transmission network carried approximately 27.6 trillion cubic feet of natural gas to ~77.7 million consumers. The US Gulf Coast is expected to register significant growth in prime gas infrastructure with over 20 LNG terminal projects and over 2,200 km of proposed or in-construction pipeline over the forecast period. Furthermore, during the Russia-Ukraine war, many countries discontinued their respective operations with Russian oil & gas businesses, which resulted in a shift of gas importers from Russia to the US. The following rise in demand of gas further augmented gas production operations across the US, which fuels the gas pipeline infrastructure market growth in the US.
North America Gas Pipeline Infrastructure Market Revenue and Forecast to 2030 (US$ Billion)
North America Gas Pipeline Infrastructure Market Segmentation
The North America gas pipeline infrastructure market is segmented into operation, equipment, application, and country.
Based on operation, the North America gas pipeline infrastructure market is bifurcated into transmission and distribution. The distribution segment held a larger share of North America gas pipeline infrastructure market in 2022.
In terms of equipment, the North America gas pipeline infrastructure market is categorized into pipeline, compressor station, metering skids, and valves. The pipeline segment held the largest share of North America gas pipeline infrastructure market in 2022.
Based on application, the North America gas pipeline infrastructure market is bifurcated into onshore and offshore. The onshore segment held a larger share of North America gas pipeline infrastructure market in 2022.
Based on country, the North America gas pipeline infrastructure market is segmented into the US, Canada, and Mexico. The US dominated the North America gas pipeline infrastructure market in 2022.
Enbridge Inc, TC Energy Corp, Berkshire Hathaway Inc, Kinder Morgan Inc, and Pembina Pipeline Corp are some of the leading companies operating in the North America gas pipeline infrastructure market.
Table Of Contents
1. Introduction
- 1.1 The Insight Partners Research Report Guidance
- 1.2 Market Segmentation
2. Executive Summary
- 2.1 Key Insights
- 2.2 Market Attractiveness
3. Research Methodology
- 3.1 Coverage
- 3.2 Secondary Research
- 3.3 Primary Research
4. Gas Pipeline Infrastructure Market Landscape
- 4.1 Overview
- 4.2 Ecosystem Analysis
- 4.2.1 Production
- 4.2.2 Transmission
- 4.2.3 Distribution
- 4.2.4 End User
5. North America Gas Pipeline Infrastructure Market - Key Industry Dynamics
- 5.1 Market Drivers
- 5.1.1 Rise in Demand for Natural Gas
- 5.1.2 Cost-Effectiveness Over Long Distances
- 5.2 Market Restraints
- 5.2.1 Rapid Expansion or Investment towards Renewable Power Generation from Solar and Wind
- 5.3 Market Opportunities
- 5.3.1 Rise in Shale Gas Production in North America
- 5.3.2 Integration with Renewable Energy
- 5.4 Market Trends
- 5.4.1 Growing Developments in the Offshore Gas Industry
- 5.5 Impact of Drivers and Restraints:
6. Gas Pipeline Infrastructure Market - North America Market Analysis
- 6.1 Gas Pipeline Infrastructure Market Revenue (US$ Billion), 2020- 2030
- 6.2 Gas Pipeline Infrastructure Market Forecast and Analysis
7. North America Gas Pipeline Infrastructure Market Analysis - Operation
- 7.1 Overview
- 7.2 Gas Pipeline Infrastructure Market, By Operation (2022 and 2030)
- 7.3 Transmission
- 7.3.1 Overview
- 7.3.2 Transmission Market, Revenue and Forecast to 2030 (US$ Billion)
- 7.4 Distribution
- 7.4.1 Overview
- 7.4.2 Distribution Market, Revenue and Forecast to 2030 (US$ Billion)
8. North America Gas Pipeline Infrastructure Market Analysis - Equipment
- 8.1 Overview
- 8.2 Gas Pipeline Infrastructure Market, By Equipment (2022 and 2030)
- 8.3 Pipeline
- 8.3.1 Overview
- 8.3.2 Pipeline Market, Revenue and Forecast to 2030 (US$ Billion)
- 8.4 Valves
- 8.4.1 Overview
- 8.4.2 Valves Market, Revenue and Forecast to 2030 (US$ Billion)
- 8.5 Compressor station
- 8.5.1 Overview
- 8.5.2 Compressor station Market, Revenue and Forecast to 2030 (US$ Billion)
- 8.6 Metering skids
- 8.6.1 Overview
- 8.6.2 Metering skids Market, Revenue and Forecast to 2030 (US$ Billion)
9. North America Gas Pipeline Infrastructure Market Analysis - Application
- 9.1 Overview
- 9.2 Gas Pipeline Infrastructure Market, By Application (2022 and 2030)
- 9.3 Onshore
- 9.3.1 Overview
- 9.3.2 Onshore Market, Revenue and Forecast to 2030 (US$ Billion)
- 9.4 Offshore
- 9.4.1 Overview
- 9.4.2 Offshore Market, Revenue and Forecast to 2030 (US$ Billion)
10. North America Gas Pipeline Infrastructure Market - Country Analysis
- 10.1 North America Market Overview
- 10.1.1 North America Gas Pipeline Infrastructure Market, By Key Country - Revenue 2022 (US$ Bn)
- 10.1.2 North America Gas Pipeline Infrastructure Market Revenue and Forecasts and Analysis - By Country
- 10.1.2.1 North America Gas Pipeline Infrastructure Market Revenue and Forecasts and Analysis - By Country
- 10.1.2.2 US Gas Pipeline Infrastructure Market Revenue and Forecasts to 2030 (US$ Bn)
- 10.1.2.2.1 US Gas Pipeline Infrastructure Market Breakdown by Operation
- 10.1.2.2.2 US Gas Pipeline Infrastructure Market Breakdown by Equipment
- 10.1.2.2.3 US Gas Pipeline Infrastructure Market Breakdown by Application
- 10.1.2.3 Canada Gas Pipeline Infrastructure Market Revenue and Forecasts to 2030 (US$ Bn)
- 10.1.2.3.1 Canada Gas Pipeline Infrastructure Market Breakdown by Operation
- 10.1.2.3.2 Canada Gas Pipeline Infrastructure Market Breakdown by Equipment
- 10.1.2.3.3 Canada Gas Pipeline Infrastructure Market Breakdown by Application
- 10.1.2.4 Mexico Gas Pipeline Infrastructure Market Revenue and Forecasts to 2030 (US$ Bn)
- 10.1.2.4.1 Mexico Gas Pipeline Infrastructure Market Breakdown by Operation
- 10.1.2.4.2 Mexico Gas Pipeline Infrastructure Market Breakdown by Equipment
- 10.1.2.4.3 Mexico Gas Pipeline Infrastructure Market Breakdown by Application
11. Industry Landscape
- 11.1 Overview
- 11.2 Market Initiative
- 11.3 Mergers & Acquisitions
12. Company Profiles
- 12.1 Enbridge Inc
- 12.1.1 Key Facts
- 12.1.2 Business Description
- 12.1.3 Products and Services
- 12.1.4 Financial Overview
- 12.1.5 SWOT Analysis
- 12.1.6 Key Developments
- 12.2 TC Energy Corp
- 12.2.1 Key Facts
- 12.2.2 Business Description
- 12.2.3 Products and Services
- 12.2.4 Financial Overview
- 12.2.5 SWOT Analysis
- 12.2.6 Key Developments
- 12.3 Berkshire Hathaway Inc
- 12.3.1 Key Facts
- 12.3.2 Business Description
- 12.3.3 Products and Services
- 12.3.4 Financial Overview
- 12.3.5 SWOT Analysis
- 12.3.6 Key Developments
- 12.4 Kinder Morgan Inc
- 12.4.1 Key Facts
- 12.4.2 Business Description
- 12.4.3 Products and Services
- 12.4.4 Financial Overview
- 12.4.5 SWOT Analysis
- 12.4.6 Key Developments
- 12.5 Pembina Pipeline Corp
- 12.5.1 Key Facts
- 12.5.2 Business Description
- 12.5.3 Products and Services
- 12.5.4 Financial Overview
- 12.5.5 SWOT Analysis
- 12.5.6 Key Developments
- 12.6 Saipem SpA
- 12.6.1 Key Facts
- 12.6.2 Business Description
- 12.6.3 Products and Services
- 12.6.4 Financial Overview
- 12.6.5 SWOT Analysis
- 12.6.6 Key Developments
13. Appendix
- 13.1 About the Insight Partners
- 13.2 Word Index
