|
|
市場調査レポート
商品コード
1562402
欧州の収益保証:2030年までの市場予測 - 地域分析 - コンポーネント別、展開別、組織規模別、業界別Europe Revenue Assurance Market Forecast to 2030 - Regional Analysis - by Component, Deployment, Organization Size, and Vertical |
||||||

|
|||||||
|
|||||||

| 欧州の収益保証:2030年までの市場予測 - 地域分析 - コンポーネント別、展開別、組織規模別、業界別 |
|
出版日: 2024年07月04日
発行: The Insight Partners
ページ情報: 英文 100 Pages
納期: 即納可能
|

全表示
- 概要
- 図表
- 目次
欧州の収益保証市場は、2022年に15億4,174万米ドルと評価され、2030年には34億3,490万米ドルに達すると予測され、2022年から2030年までのCAGRは10.5%を記録すると推計されます。
インターネット普及率の上昇が欧州の収益保証市場を牽引
インターネットの利用が拡大するにつれて、オンラインで業務を行う企業が増え、デジタル取引と収益源の創出につながります。世界銀行のデータによると、2021年に世界全体でインターネットを利用する個人の数は63%で、2020年の60%から増加しています。より多くの人々がインターネットにアクセスすることで、より多くのデジタル取引が行われています。これにはオンライン購入、デジタル決済、その他のオンライン金融活動が含まれます。取引量が増えれば増えるほど、正確な請求、収益漏れの防止、不正行為の検知など、効果的な収益保証対策の必要性が高まる。さらに、インターネット普及率の上昇がeコマース業界の成長に拍車をかけています。オンライン小売プラットフォームやマーケットプレースでは、より多くの企業や消費者がオンラインでの売買に参加し、活動が活発化しています。収益保証は、eコマースにおける正確な収益認識、在庫管理、収益漏れの防止において極めて重要です。モバイル・インターネットの利用が大幅に増加しています。モバイル・デバイスを通じてインターネットにアクセスする人が増えるにつれ、モバイル・データ、音声通話、付加価値サービスなどのモバイル・サービスからの収益ストリームを効果的に監視・管理できる収益保証ソリューションが必要とされています。したがって、インターネット普及率の上昇が収益保証市場の重要な促進要因となっています。
欧州の収益保証市場の概要
欧州の収益保証市場は、ドイツ、フランス、イタリア、英国、ロシア、その他欧州に区分されます。その他欧州市場はさらに、スペイン、スイス、オランダ、デンマークに区分されます。これらの国々は技術的に進んでおり、上記の国々の政府は堅牢で強化された技術を採用するために継続的に多額の投資を行っています。収益保証市場は欧州で大きな成長を遂げており、その原動力となっているのは、収益漏れの事例の増加などです。ビジネスモデルやサービス提供の複雑化とテクノロジーの進化が相まって、収益が漏れる機会が増えています。企業は堅牢な保証ソリューションの必要性を認識しています。さらに米国では、毎年収益の5.87%が未回収となっており、これは年間2,630億米ドルの損失に相当すると推定されています。
欧州のいくつかの企業は、収益保証サービスの導入戦略に取り組んでいます。例えば、2021年5月、国際的なメッセージング・サービス・プロバイダーであり、A2P、P2P、P2Aメッセージングと収益化のパイオニアの1つである世界・メッセージ・サービス(GMS)は、包括的なSMSセキュリティと制御を通じて最高度のA2P収益保証を提供するため、大手通信セキュリティ・ソリューション・プロバイダーのCellusysと提携しました。オンボード分析機能を備えたこの統合ソリューションは、サービス品質を向上させ、メッセージングにおけるSMS詐欺や収益漏えいからモバイルネットワーク事業者を保護します。
欧州における通信活動の増加は、収益保証市場に大きな利益をもたらす可能性があります。5G、IoT、クラウドコンピューティング、先進データパッケージなど多様なサービスに加入するユーザーが増える中、通信事業者は複雑な課金システムや契約に取り組んでいます。
この複雑さがエラーや収益漏れの機会を増やし、堅牢な収益保証ソリューションを必要としています。さらに、人工知能(AI)や機械学習(ML)などの新たなテクノロジーは、時間のかかる作業を自動化し、潜在的な収益漏れをリアルタイムで把握することができます。これにより、収益保証業務の効率性と有効性が向上します。このように、収益漏れの増加、収益保証の導入の増加、通信業界の増加など、上記の要因のおかげで、欧州の収益保証市場は推進しています。
欧州の収益保証市場の収益と2030年までの予測(金額)
欧州の収益保証市場のセグメンテーション
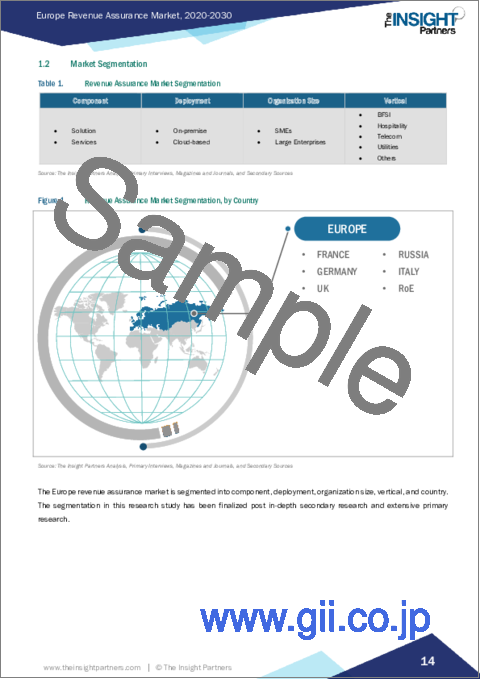
欧州の収益保証市場は、コンポーネント、展開、組織規模、業界、国に分類されます。
コンポーネントに基づいて、欧州の収益保証市場はソリューションとサービスに二分されます。2022年の市場シェアはソリューションセグメントが大きいです。
展開に基づき、欧州の収益保証市場はオンプレミスとクラウドベースに二分されます。2022年の市場シェアはクラウドベースセグメントが大きいです。
組織規模に基づくと、欧州の収益保証市場は中小企業と大企業に二分されます。2022年の市場シェアは大企業の方が大きいです。
業界別では、欧州の収益保証市場はBFSI、ホスピタリティ、テレコム、公益事業、その他に分類されます。2022年には電気通信セグメントが最大の市場シェアを占めています。
国別では、欧州の収益保証市場はドイツ、フランス、イタリア、英国、ロシア、その他欧州に区分されます。2022年の欧州の収益保証市場シェアは英国が独占。
Cartesian Inc、Nokia Corp、Tata Consultancy Services Ltd、Amdocs、Subex Ltd、LATRO Services Inc、Araxxe SAS、Panamax Inc、Adapt IT Holdings Proprietary Ltdは、欧州の収益保証市場で事業を展開する主要企業です。
目次
第1章 イントロダクション
第2章 エグゼクティブサマリー
- 主要洞察
- 市場の魅力
第3章 調査手法
- 調査範囲
- 2次調査
- 1次調査
第4章 収益保証市場の展望
- PEST分析
- エコシステム分析
- ソリューションプロバイダー
- サービスプロバイダー
- エンドユーザー
- バリューチェーンのベンダー一覧
第5章 欧州の収益保証市場:主要市場力学
- 促進要因
- インターネット普及率の上昇
- 良好なビジネス環境
- 抑制要因
- レベニューアシュアランスに対する認識と理解の不足
- 組織管理の問題
- 機会
- デジタル技術の急速な進化
- 今後の動向
- 非通信セクターにおける収益保証の重要性の高まり
- 促進要因と抑制要因の影響
第6章 収益保証市場:欧州市場分析
- 収益保証市場の収益、2020-2030年
- 収益保証市場の予測分析
第7章 欧州の収益保証市場分析:コンポーネント別
- ソリューション
- サービス
第8章 欧州の収益保証市場分析:展開別
- オンプレミス
- クラウドベース
第9章 欧州の収益保証市場分析:組織規模別
- 中小企業
- 大企業
第10章 欧州の収益保証市場分析:業界別
- BFSI
- ホスピタリティ
- 電気通信
- 公益事業
- その他
第11章 欧州の収益保証市場:国別分析
- 欧州
- ドイツ
- フランス
- イタリア
- 英国
- ロシア
- その他欧州
第12章 競合情勢
- 主要プレーヤーによるヒートマップ分析
- 企業のポジショニングと集中度
第13章 業界情勢
- 市場イニシアティブ
- 合併と買収
第14章 企業プロファイル
- Cartesian, Inc
- Nokia Corp
- Tata Consultancy Services Ltd
- Amdocs Ltd
- Subex Ltd
- Araxxe SAS
- Panamax Inc
- Adapt IT Holdings Proprietary Ltd
- LATRO Services Inc
第15章 付録
List Of Tables
- Table 1. Revenue Assurance Market Segmentation
- Table 2. List of Vendors
- Table 3. Revenue Assurance Market - Revenue and Forecast to 2030 (US$ Million)
- Table 4. Revenue Assurance Market - Revenue and Forecast to 2030 (US$ Million) - by Component
- Table 5. Revenue Assurance Market - Revenue and Forecast to 2030 (US$ Million) - by Deployment
- Table 6. Revenue Assurance Market - Revenue and Forecast to 2030 (US$ Million) - by Organization Size
- Table 7. Revenue Assurance Market - Revenue and Forecast to 2030 (US$ Million) - by Vertical
- Table 8. Europe: Revenue Assurance Market - Revenue and Forecast to 2030(US$ Million) - by Country
- Table 9. Germany: Revenue Assurance Market - Revenue and Forecast to 2030(US$ Million) - by Component
- Table 10. Germany: Revenue Assurance Market - Revenue and Forecast to 2030(US$ Million) - by Deployment
- Table 11. Germany: Revenue Assurance Market - Revenue and Forecast to 2030(US$ Million) - by Organization Size
- Table 12. Germany: Revenue Assurance Market - Revenue and Forecast to 2030(US$ Million) - by Vertical
- Table 13. France: Revenue Assurance Market - Revenue and Forecast to 2030(US$ Million) - by Component
- Table 14. France: Revenue Assurance Market - Revenue and Forecast to 2030(US$ Million) - by Deployment
- Table 15. France: Revenue Assurance Market - Revenue and Forecast to 2030(US$ Million) - by Organization Size
- Table 16. France: Revenue Assurance Market - Revenue and Forecast to 2030(US$ Million) - by Vertical
- Table 17. Italy: Revenue Assurance Market - Revenue and Forecast to 2030(US$ Million) - by Component
- Table 18. Italy: Revenue Assurance Market - Revenue and Forecast to 2030(US$ Million) - by Deployment
- Table 19. Italy: Revenue Assurance Market - Revenue and Forecast to 2030(US$ Million) - by Organization Size
- Table 20. Italy: Revenue Assurance Market - Revenue and Forecast to 2030(US$ Million) - by Vertical
- Table 21. United Kingdom: Revenue Assurance Market - Revenue and Forecast to 2030(US$ Million) - by Component
- Table 22. United Kingdom: Revenue Assurance Market - Revenue and Forecast to 2030(US$ Million) - by Deployment
- Table 23. United Kingdom: Revenue Assurance Market - Revenue and Forecast to 2030(US$ Million) - by Organization Size
- Table 24. United Kingdom: Revenue Assurance Market - Revenue and Forecast to 2030(US$ Million) - by Vertical
- Table 25. Russia: Revenue Assurance Market - Revenue and Forecast to 2030(US$ Million) - by Component
- Table 26. Russia: Revenue Assurance Market - Revenue and Forecast to 2030(US$ Million) - by Deployment
- Table 27. Russia: Revenue Assurance Market - Revenue and Forecast to 2030(US$ Million) - by Organization Size
- Table 28. Russia: Revenue Assurance Market - Revenue and Forecast to 2030(US$ Million) - by Vertical
- Table 29. Rest of Europe: Revenue Assurance Market - Revenue and Forecast to 2030(US$ Million) - by Component
- Table 30. Rest of Europe: Revenue Assurance Market - Revenue and Forecast to 2030(US$ Million) - by Deployment
- Table 31. Rest of Europe: Revenue Assurance Market - Revenue and Forecast to 2030(US$ Million) - by Organization Size
- Table 32. Rest of Europe: Revenue Assurance Market - Revenue and Forecast to 2030(US$ Million) - by Vertical
- Table 33. Heat Map Analysis
- Table 34. List of Abbreviation
List Of Figures
- Figure 1. Revenue Assurance Market Segmentation, by Country
- Figure 2. PEST Analysis
- Figure 3. Ecosystem Analysis
- Figure 4. Revenue Assurance Market - Key Market Dynamics
- Figure 5. Impact Analysis of Drivers and Restraints
- Figure 6. Revenue Assurance Market Revenue (US$ Million), 2020-2030
- Figure 7. Revenue Assurance Market Share (%) - by Component (2022 and 2030)
- Figure 8. Solution: Revenue Assurance Market - Revenue and Forecast to 2030 (US$ Million)
- Figure 9. Services: Revenue Assurance Market - Revenue and Forecast to 2030 (US$ Million)
- Figure 10. Revenue Assurance Market Share (%) - by Deployment (2022 and 2030)
- Figure 11. On-premise: Revenue Assurance Market - Revenue and Forecast to 2030 (US$ Million)
- Figure 12. Cloud-based: Revenue Assurance Market - Revenue and Forecast to 2030 (US$ Million)
- Figure 13. Revenue Assurance Market Share (%) - by Organization Size (2022 and 2030)
- Figure 14. SMEs: Revenue Assurance Market - Revenue and Forecast to 2030 (US$ Million)
- Figure 15. Large Enterprises: Revenue Assurance Market - Revenue and Forecast to 2030 (US$ Million)
- Figure 16. Revenue Assurance Market Share (%) - by Vertical (2022 and 2030)
- Figure 17. BFSI: Revenue Assurance Market - Revenue and Forecast to 2030 (US$ Million)
- Figure 18. Hospitality: Revenue Assurance Market - Revenue and Forecast to 2030 (US$ Million)
- Figure 19. Telecom: Revenue Assurance Market - Revenue and Forecast to 2030 (US$ Million)
- Figure 20. Utilities: Revenue Assurance Market - Revenue and Forecast to 2030 (US$ Million)
- Figure 21. Others: Revenue Assurance Market - Revenue and Forecast to 2030 (US$ Million)
- Figure 22. Europe: Revenue Assurance Market, by Key Country - Revenue (2022) (US$ Million)
- Figure 23. Europe: Revenue Assurance Market Breakdown, by Key Countries, 2022 and 2030 (%)
- Figure 24. Germany: Revenue Assurance Market - Revenue and Forecast to 2030(US$ Million)
- Figure 25. France: Revenue Assurance Market - Revenue and Forecast to 2030(US$ Million)
- Figure 26. Italy: Revenue Assurance Market - Revenue and Forecast to 2030(US$ Million)
- Figure 27. United Kingdom: Revenue Assurance Market - Revenue and Forecast to 2030(US$ Million)
- Figure 28. Russia: Revenue Assurance Market - Revenue and Forecast to 2030(US$ Million)
- Figure 29. Rest of Europe: Revenue Assurance Market - Revenue and Forecast to 2030(US$ Million)
- Figure 30. Company Positioning & Concentration
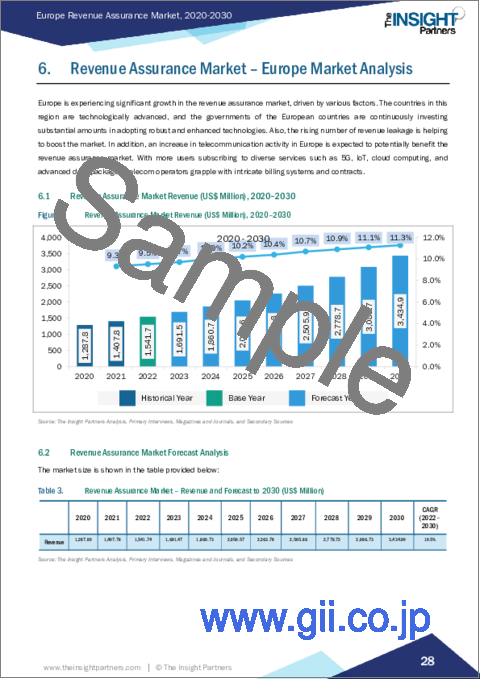
The Europe revenue assurance market was valued at US$ 1,541.74 million in 2022 and is expected to reach US$ 3,434.90 million by 2030; it is estimated to record a CAGR of 10.5% from 2022 to 2030.
Rise in Internet Penetration Drives Europe Revenue Assurance Market
As internet usage continues to grow, more businesses are conducting their operations online, leading to an increase in the generation of digital transactions and revenue streams. According to World Bank data, globally, the number of individuals using the Internet in 2021 was 63%, an increase from 60% in 2020. With more people accessing the Internet, more digital transactions are taking place. This includes online purchases, digital payments, and other online financial activities. The larger the volume of transactions, the greater the need for effective revenue assurance measures to ensure accurate billing, prevent revenue leakages, and detect fraudulent activities. Moreover, the rise in internet penetration has fueled the growth of the e-commerce industry. Online retail platforms and marketplaces are experiencing increased activity, with more businesses and consumers participating in online buying and selling. Revenue assurance is crucial in ensuring accurate revenue recognition, managing inventory, and preventing revenue leakages in e-commerce. There is a significant increase in the use of mobile internet. As more people access the Internet through their mobile devices, there is a need for revenue assurance solutions that can effectively monitor and manage revenue streams from mobile services, such as mobile data, voice calls, and value-added services. Hence, the rising internet penetration is a significant driver for the revenue assurance market.
Europe Revenue Assurance Market Overview
The Europe revenue assurance market is segmented into Germany, France, Italy, the UK, Russia, and the Rest of Europe. The Rest of Europe market is further segmented into Spain, Switzerland, the Netherlands, and Denmark. These countries are technologically advanced, and the governments of the countries mentioned above continuously invest substantial amounts in adopting robust and enhanced technologies. The revenue assurance market is experiencing significant growth in Europe, driven by factors such as rising instances of revenue leakage. Increased complexity in business models and service offerings, coupled with evolving technologies, creates more opportunities for revenue to slip through the cracks. Companies are recognizing the need for robust assurance solutions. Further, the UK businesses estimate that 5.87% of revenues remain uncollected each year, equating to US$ 263 billion in annual losses.
Several companies in Europe are engaged in strategies for the implementation of revenue assurance services. For instance, in May 2021, Global Message Services (GMS), an international messaging service provider and one of the pioneers in A2P, P2P, and P2A messaging and monetization, inked a partnership with leading telecom security solutions provider Cellusys to offer the highest degree of A2P revenue assurance through comprehensive SMS security and control. The integrated solution with onboard analytics improves the quality of service and protects mobile network operators against SMS fraud and revenue leakage in messaging.
An increase in telecommunication activity in Europe can potentially offer significant benefits to the revenue assurance market. With more users subscribing to diverse services such as 5G, IoT, cloud computing, and advanced data packages, telecom operators grapple with intricate billing systems and contracts.
This complexity creates more opportunities for errors and revenue leakage, hence requiring robust revenue assurance solutions. Moreover, emerging technologies such as artificial intelligence (AI) and machine learning (ML) can automate time-consuming tasks and provide real-time insights into potential revenue leaks. This improves the efficiency and effectiveness of revenue assurance practices. Thus, owing to the above factors, such as the rise in revenue leakage, the rising implementation of revenue assurance, and the increasing telecom industry, the revenue assurance market in Europe is propelling.
Europe Revenue Assurance Market Revenue and Forecast to 2030 (US$ Million)
Europe Revenue Assurance Market Segmentation
The Europe revenue assurance market is categorized into components, deployment, organization size, vertical, and country.
Based on component, the Europe revenue assurance market is bifurcated into solution and services. The solution segment held a larger market share in 2022.
Based on deployment, the Europe revenue assurance market is bifurcated into on-premises and cloud-based. The cloud-based segment held a larger market share in 2022.
Based on organization size, the Europe revenue assurance market is bifurcated into SMEs and large enterprises. The large enterprises segment held a larger market share in 2022.
Based on vertical, the Europe revenue assurance market is categorized into BFSI, hospitality, telecom, utilities, and others. The telecom segment held the largest market share in 2022.
By country, the Europe revenue assurance market is segmented into the Germany, France, Italy, the UK, Russia, and the Rest of Europe. The UK dominated the Europe revenue assurance market share in 2022.
Cartesian Inc, Nokia Corp, Tata Consultancy Services Ltd, Amdocs, Subex Ltd, LATRO Services Inc, Araxxe SAS, Panamax Inc, and Adapt IT Holdings Proprietary Ltd are some of the leading companies operating in the Europe revenue assurance market.
Table Of Contents
1. Introduction
- 1.1 The Insight Partners Research Report Guidance
- 1.2 Market Segmentation
2. Executive Summary
- 2.1 Key Insights
- 2.2 Market Attractiveness
3. Research Methodology
- 3.1 Coverage
- 3.2 Secondary Research
- 3.3 Primary Research
4. Revenue Assurance Market Landscape
- 4.1 Overview
- 4.2 PEST Analysis
- 4.3 Ecosystem Analysis
- 4.3.1 Solution Providers:
- 4.3.2 Service Providers
- 4.3.3 End Users:
- 4.3.4 List of Vendors in the Value Chain
5. Europe Revenue Assurance Market - Key Market Dynamics
- 5.1 Drivers
- 5.1.1 Rise in Internet Penetration
- 5.1.2 Favorable Business Environment
- 5.2 Restraints
- 5.2.1 Lack of Awareness and Understanding of Revenue Assurance
- 5.2.2 Organizational Management Issues
- 5.3 Opportunity
- 5.3.1 Rapid Evolution of Digital Technologies
- 5.4 Future Trends
- 5.4.1 Growing Importance of Revenue Assurance in Non-Telecom Sectors
- 5.5 Impact of Drivers and Restraints:
6. Revenue Assurance Market - Europe Market Analysis
- 6.1 Revenue Assurance Market Revenue (US$ Million), 2020-2030
- 6.2 Revenue Assurance Market Forecast Analysis
7. Europe Revenue Assurance Market Analysis - by Component
- 7.1 Solution
- 7.1.1 Overview
- 7.1.2 Solution: Revenue Assurance Market - Revenue and Forecast to 2030 (US$ Million)
- 7.2 Services
- 7.2.1 Overview
- 7.2.2 Services: Revenue Assurance Market - Revenue and Forecast to 2030 (US$ Million)
8. Europe Revenue Assurance Market Analysis - by Deployment
- 8.1 On-premise
- 8.1.1 Overview
- 8.1.2 On-premise: Revenue Assurance Market - Revenue and Forecast to 2030 (US$ Million)
- 8.2 Cloud-based
- 8.2.1 Overview
- 8.2.2 Cloud-based: Revenue Assurance Market - Revenue and Forecast to 2030 (US$ Million)
9. Europe Revenue Assurance Market Analysis - by Organization Size
- 9.1 SMEs
- 9.1.1 Overview
- 9.1.2 SMEs: Revenue Assurance Market - Revenue and Forecast to 2030 (US$ Million)
- 9.2 Large Enterprises
- 9.2.1 Overview
- 9.2.2 Large Enterprises: Revenue Assurance Market - Revenue and Forecast to 2030 (US$ Million)
10. Europe Revenue Assurance Market Analysis - by Vertical
- 10.1 BFSI
- 10.1.1 Overview
- 10.1.2 BFSI: Revenue Assurance Market - Revenue and Forecast to 2030 (US$ Million)
- 10.2 Hospitality
- 10.2.1 Overview
- 10.2.2 Hospitality: Revenue Assurance Market - Revenue and Forecast to 2030 (US$ Million)
- 10.3 Telecom
- 10.3.1 Overview
- 10.3.2 Telecom: Revenue Assurance Market - Revenue and Forecast to 2030 (US$ Million)
- 10.4 Utilities
- 10.4.1 Overview
- 10.4.2 Utilities: Revenue Assurance Market - Revenue and Forecast to 2030 (US$ Million)
- 10.5 Others
- 10.5.1 Overview
- 10.5.2 Others: Revenue Assurance Market - Revenue and Forecast to 2030 (US$ Million)
11. Europe Revenue Assurance Market - Country Analysis
- 11.1 Europe Revenue Assurance Market Overview
- 11.1.1 Europe: Revenue Assurance Market - Revenue and Forecast Analysis - by Country
- 11.1.1.1 Europe: Revenue Assurance Market - Revenue and Forecast Analysis - by Country
- 11.1.1.2 Germany: Revenue Assurance Market - Revenue and Forecast to 2030 (US$ Million)
- 11.1.1.2.1 Germany: Revenue Assurance Market Breakdown, by Component
- 11.1.1.2.2 Germany: Revenue Assurance Market Breakdown, by Deployment
- 11.1.1.2.3 Germany: Revenue Assurance Market Breakdown, by Organization Size
- 11.1.1.2.4 Germany: Revenue Assurance Market Breakdown, by Vertical
- 11.1.1.3 France: Revenue Assurance Market - Revenue and Forecast to 2030 (US$ Million)
- 11.1.1.3.1 France: Revenue Assurance Market Breakdown, by Component
- 11.1.1.3.2 France: Revenue Assurance Market Breakdown, by Deployment
- 11.1.1.3.3 France: Revenue Assurance Market Breakdown, by Organization Size
- 11.1.1.3.4 France: Revenue Assurance Market Breakdown, by Vertical
- 11.1.1.4 Italy: Revenue Assurance Market - Revenue and Forecast to 2030 (US$ Million)
- 11.1.1.4.1 Italy: Revenue Assurance Market Breakdown, by Component
- 11.1.1.4.2 Italy: Revenue Assurance Market Breakdown, by Deployment
- 11.1.1.4.3 Italy: Revenue Assurance Market Breakdown, by Organization Size
- 11.1.1.4.4 Italy: Revenue Assurance Market Breakdown, by Vertical
- 11.1.1.5 United Kingdom: Revenue Assurance Market - Revenue and Forecast to 2030 (US$ Million)
- 11.1.1.5.1 United Kingdom: Revenue Assurance Market Breakdown, by Component
- 11.1.1.5.2 United Kingdom: Revenue Assurance Market Breakdown, by Deployment
- 11.1.1.5.3 United Kingdom: Revenue Assurance Market Breakdown, by Organization Size
- 11.1.1.5.4 United Kingdom: Revenue Assurance Market Breakdown, by Vertical
- 11.1.1.6 Russia: Revenue Assurance Market - Revenue and Forecast to 2030 (US$ Million)
- 11.1.1.6.1 Russia: Revenue Assurance Market Breakdown, by Component
- 11.1.1.6.2 Russia: Revenue Assurance Market Breakdown, by Deployment
- 11.1.1.6.3 Russia: Revenue Assurance Market Breakdown, by Organization Size
- 11.1.1.6.4 Russia: Revenue Assurance Market Breakdown, by Vertical
- 11.1.1.7 Rest of Europe: Revenue Assurance Market - Revenue and Forecast to 2030 (US$ Million)
- 11.1.1.7.1 Rest of Europe: Revenue Assurance Market Breakdown, by Component
- 11.1.1.7.2 Rest of Europe: Revenue Assurance Market Breakdown, by Deployment
- 11.1.1.7.3 Rest of Europe: Revenue Assurance Market Breakdown, by Organization Size
- 11.1.1.7.4 Rest of Europe: Revenue Assurance Market Breakdown, by Vertical
- 11.1.1 Europe: Revenue Assurance Market - Revenue and Forecast Analysis - by Country
12. Competitive Landscape
- 12.1 Heat Map Analysis by Key Players
- 12.2 Company Positioning & Concentration
13. Industry Landscape
- 13.1 Overview
- 13.2 Market Initiative
- 13.3 Mergers & Acquisitions
14. Company Profiles
- 14.1 Cartesian, Inc
- 14.1.1 Key Facts
- 14.1.2 Business Description
- 14.1.3 Products and Services
- 14.1.4 Financial Overview
- 14.1.5 SWOT Analysis
- 14.1.6 Key Developments
- 14.2 Nokia Corp
- 14.2.1 Key Facts
- 14.2.2 Business Description
- 14.2.3 Products and Services
- 14.2.4 Financial Overview
- 14.2.5 SWOT Analysis
- 14.2.6 Key Developments
- 14.3 Tata Consultancy Services Ltd
- 14.3.1 Key Facts
- 14.3.2 Business Description
- 14.3.3 Products and Services
- 14.3.4 Financial Overview
- 14.3.5 SWOT Analysis
- 14.3.6 Key Developments
- 14.4 Amdocs Ltd
- 14.4.1 Key Facts
- 14.4.2 Business Description
- 14.4.3 Products and Services
- 14.4.4 Financial Overview
- 14.4.5 SWOT Analysis
- 14.4.6 Key Developments
- 14.5 Subex Ltd
- 14.5.1 Key Facts
- 14.5.2 Business Description
- 14.5.3 Products and Services
- 14.5.4 Financial Overview
- 14.5.5 SWOT Analysis
- 14.5.6 Key Developments
- 14.6 Araxxe SAS
- 14.6.1 Key Facts
- 14.6.2 Business Description
- 14.6.3 Products and Services
- 14.6.4 Financial Overview
- 14.6.5 SWOT Analysis
- 14.6.6 Key Developments
- 14.7 Panamax Inc
- 14.7.1 Key Facts
- 14.7.2 Business Description
- 14.7.3 Products and Services
- 14.7.4 Financial Overview
- 14.7.5 SWOT Analysis
- 14.7.6 Key Developments
- 14.8 Adapt IT Holdings Proprietary Ltd
- 14.8.1 Key Facts
- 14.8.2 Business Description
- 14.8.3 Products and Services
- 14.8.4 Financial Overview
- 14.8.5 SWOT Analysis
- 14.8.6 Key Developments
- 14.9 LATRO Services Inc
- 14.9.1 Key Facts
- 14.9.2 Business Description
- 14.9.3 Products and Services
- 14.9.4 Financial Overview
- 14.9.5 SWOT Analysis
- 14.9.6 Key Developments
15. Appendix
- 15.1 About The Insight Partners
- 15.2 Word Index
