|
|
市場調査レポート
商品コード
1533064
粉塵防止剤/抑制剤の北米市場、2030年までの予測 - 地域別分析:化学物質タイプ別、最終用途産業別North America Dust Control or Suppression Chemicals Market Forecast to 2030 - Regional Analysis - by Chemical Type and End-Use Industry |
||||||
|
|||||||
|
|||||||

| 粉塵防止剤/抑制剤の北米市場、2030年までの予測 - 地域別分析:化学物質タイプ別、最終用途産業別 |
|
出版日: 2024年06月04日
発行: The Insight Partners
ページ情報: 英文 97 Pages
納期: 即納可能
|

全表示
- 概要
- 図表
- 目次
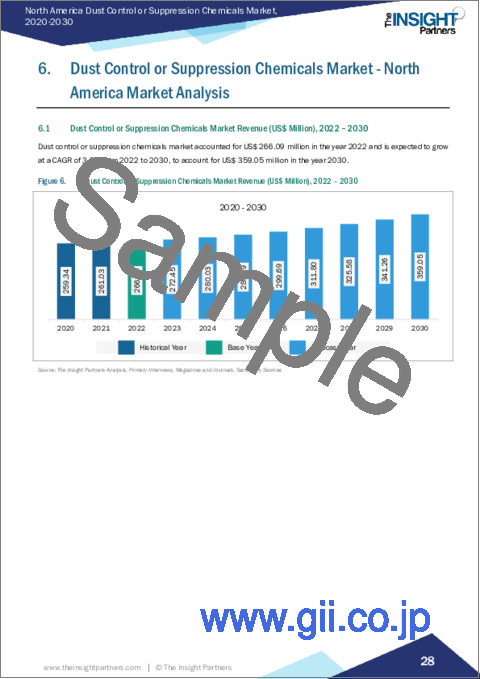
北米の粉塵防止剤/抑制剤市場は、2022年に2億6,609万米ドルと評価され、2030年には3億5,905万米ドルに達し、2022年から2030年までのCAGRで3.8%の成長が予測されています。
建設業界からの粉塵防止剤/抑制剤需要の増加が、北米の粉塵防止剤/抑制剤市場を後押し
建設業界は北米経済に大きく貢献している産業の一つです。米国ゼネコン協会(AGC)によると、米国の建設業界は毎年1兆8,000億米ドル相当の建造物を建設しています。人口増加と地域全体の商業部門の急成長による建設活動の増加が、北米の建設業界を牽引しています。2021年11月、米国政府は様々なインフラプロジェクトへの連邦投資を支援する1兆2,000億米ドルのインフラ法案を承認しました。また、建設支出は2023年までに2021年から5.5%増加すると予想されています。こうした取り組みは、建設サービス、設備、資材の需要を生み出します。
粉塵抑制剤は、解体、掘削、整地、マテリアルハンドリングから発生する粉塵を減らすために建設現場で使用されます。粉塵防止剤/抑制剤は、未舗装の路面、運搬道路、テーリングダムに散布することで、建設義務の順守や生産性の制約に対処することができます。マテリアルハンドリング時に粉塵防止剤/抑制剤を散布することで、建設現場における粒子状物質の存在や空気中の粉塵の浮遊が減少します。したがって、建設業界の発展は、予測期間中に粉塵防止剤/抑制剤の需要を促進すると予測されます。
北米の粉塵防止剤/抑制剤市場の概要
この地域は、鉱業、建設、石油・ガス、食品・飲料、繊維などの最終用途産業による利用が拡大しているため、粉塵抑制剤市場のプレーヤーにとって広範な成長機会を保持しています。北米の建設セクターは、堅調な経済と、商業・施設構造物に対する連邦政府・州政府の融資の増加により成長を目の当たりにしています。米国国勢調査局によると、2022年の建設額は1兆7,929億米ドルで、2021年の1兆6,264億米ドルから10.2%増加しました。多くの建設活動は粉塵を発生させます。高い粉塵レベルは、グラインダー、カットオフソー、グリットブラスター、ウォールチェイサーなどの高エネルギー工具の使用によって引き起こされます。米国環境保護庁によると、建設地域は土壌の攪乱面積が大きく、粒子状大気汚染レベルの上昇につながります。大気汚染防止法(CAA)は包括的な連邦法で、環境保護庁(EPA)に、公衆衛生を守るために有害な大気汚染物質の排出を規制し、大気の質の基準を設定する権限を与えています。このため、この地域では、建設セクターの拡大と政府による規制の後押しにより、粉塵防止剤/抑制剤に対する莫大な需要が生じています。
北米の粉塵防止剤/抑制剤市場の収益と2030年までの予測(金額)
北米の粉塵防止剤/抑制剤市場セグメンテーション
北米の粉塵防止剤/抑制剤市場は、化学物質タイプ、最終用途産業、国に基づいてセグメント化されます。化学物質タイプ別では、北米の粉塵防止剤/抑制剤市場は、リグニンスルホン酸塩、塩化カルシウム、塩化マグネシウム、アスファルトエマルジョン、オイルエマルジョン、ポリマーエマルジョン、その他に区分されます。塩化カルシウムセグメントは2022年に最大の市場シェアを占めました。
最終用途産業の観点から、北米の粉塵防止剤/抑制剤市場は鉱業、建設、石油・ガス、食品・飲料、繊維、ガラス・セラミックス、医薬品、その他に分類されます。2022年には鉱業セグメントが最大の市場シェアを占めています。
国別では、北米の粉塵防止剤/抑制剤市場は米国、カナダ、メキシコに区分されます。2022年の北米の粉塵防止剤/抑制剤市場シェアは米国が独占しました。
Benetech Inc、Veolia Environnement SA、Ecolab Inc、Quaker Chemical Corp、Dow Inc、BASF SE、Solenis LLC、・Borregaard ASAは、北米の粉塵防止剤/抑制剤市場で事業展開している大手企業の一部です。
目次
第1章 イントロダクション
第2章 エグゼクティブサマリー
- 主要市場洞察
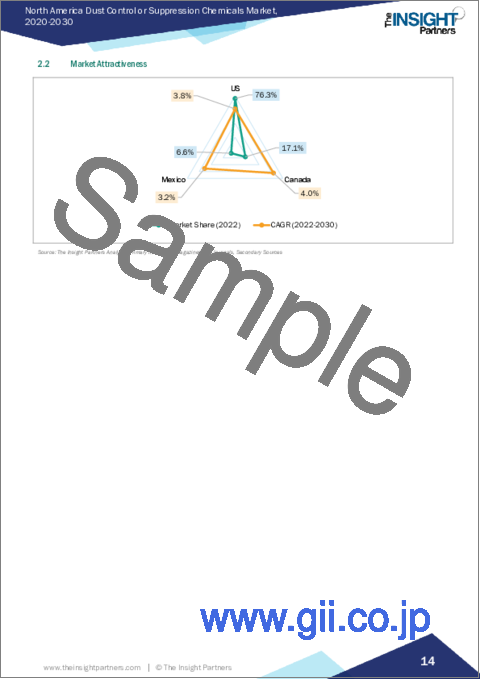
- 市場の魅力
第3章 調査手法
- 調査範囲
- 2次調査
- 1次調査
第4章 北米の粉塵防止剤/抑制剤市場情勢
- ポーターのファイブフォース分析
- 供給企業の交渉力
- 買い手の交渉力
- 新規参入業者の脅威
- 競争企業間の敵対関係
- 代替品の脅威
- エコシステム分析
第5章 北米の粉塵防止剤/抑制剤市場:主要産業力学
- 市場促進要因
- 建設業界における粉塵防止剤/抑制剤需要の増加
- 鉱業部門における投資と操業の増加
- 市場抑制要因
- 代替品の入手可能性
- 市場機会
- 製薬業界の力強い成長
- 今後の動向
- バイオベース粉塵抑制剤に関連する研究
- 促進要因と抑制要因の影響
第6章 粉塵防止剤/抑制剤市場:北米の市場分析
- 粉塵防止剤/抑制剤市場の収益、2022年~2030年
- 粉塵防止剤/抑制剤市場の数量(キロトン)、2022年~2030年
- 粉塵防止剤/抑制剤市場の予測・分析
第7章 北米の粉塵防止剤/抑制剤市場分析:化学物質タイプ別
- リグニンスルホン酸塩
- 塩化カルシウム
- 塩化マグネシウム
- アスファルトエマルジョン
- オイルエマルジョン
- ポリマーエマルジョン
- その他
第8章 北米の粉塵防止剤/抑制剤市場分析:最終用途産業別
- 鉱業
- 建設
- 石油・ガス
- 食品・飲料
- 繊維
- ガラス・セラミックス
- 医薬品
- その他
第9章 北米の粉塵防止剤/抑制剤市場:国別分析
- 北米
第10章 業界情勢
- 製品発売
第11章 競合情勢
- 主要プレーヤーによるヒートマップ分析
第12章 企業プロファイル
- Benetech Inc
- Veolia Environnement SA
- Ecolab Inc
- Quaker Chemical Corp
- Dow Inc
- BASF SE
- Solenis LLC
- Borregaard ASA
第13章 付録
List Of Tables
- Table 1. Dust Control or Suppression Chemicals Market Segmentation
- Table 2. Dust Control or Suppression Chemicals Market Revenue and Forecasts to 2030 (US$ Million)
- Table 3. Dust Control or Suppression Chemicals Market Volume and Forecasts to 2030 (Kilo Tons)
- Table 4. Dust Control or Suppression Chemicals Market Revenue and Forecasts to 2030 (US$ Million) - Chemical Type
- Table 5. Dust Control or Suppression Chemicals Market Volume and Forecasts to 2030 (Kilo Tons) - Chemical Type
- Table 6. Dust Control or Suppression Chemicals Market Revenue and Forecasts to 2030 (US$ Million) - End-Use Industry
- Table 7. US Dust Control or Suppression Chemicals Market Revenue and Forecasts to 2030 (US$ Mn) - By Chemical Type
- Table 8. US Dust Control or Suppression Chemicals Market Volume and Forecasts to 2030 (Kilo Tons) - By Chemical Type
- Table 9. US Dust Control or Suppression Chemicals Market Revenue and Forecasts to 2030 (US$ Mn) - By End-Use Industry
- Table 10. Canada Dust Control or Suppression Chemicals Market Revenue and Forecasts to 2030 (US$ Mn) - By Chemical Type
- Table 11. Canada Dust Control or Suppression Chemicals Market Revenue and Forecasts to 2030 (US$ Mn) - By Chemical Type
- Table 12. Canada Dust Control or Suppression Chemicals Market Revenue and Forecasts to 2030 (US$ Mn) - By End-Use Industry
- Table 13. Mexico Dust Control or Suppression Chemicals Market Revenue and Forecasts to 2030 (US$ Mn) - By Chemical Type
- Table 14. Mexico Dust Control or Suppression Chemicals Market Volume and Forecasts to 2030 (Kilo Tons) - By Chemical Type
- Table 15. Mexico Dust Control or Suppression Chemicals Market Revenue and Forecasts to 2030 (US$ Mn) - By End-Use Industry
List Of Figures
- Figure 1. Dust Control or Suppression Chemicals Market Segmentation, By Country
- Figure 2. Porter's Five Forces Analysis
- Figure 3. Ecosystem: Dust Control or Suppression Chemicals Market
- Figure 4. Dust Control or Suppression Chemicals Market - Key Industry Dynamics
- Figure 5. Impact Analysis of Drivers and Restraints
- Figure 6. Dust Control or Suppression Chemicals Market Revenue (US$ Million), 2022 - 2030
- Figure 7. Dust Control or Suppression Chemicals Market Volume (Kilo Tons), 2022 - 2030
- Figure 8. Dust Control or Suppression Chemicals Market Share (%) - Chemical Type, 2022 and 2030
- Figure 9. Lignin Sulfonate Market Revenue and Forecasts to 2030 (US$ Million)
- Figure 10. Lignin Sulfonate Market Volume and Forecasts to 2030 (Kilo Tons)
- Figure 11. Calcium Chloride Market Revenue and Forecasts to 2030 (US$ Million)
- Figure 12. Calcium Chloride Market Volume and Forecasts to 2030 (Kilo Tons)
- Figure 13. Magnesium Chloride Market Revenue and Forecasts to 2030 (US$ Million)
- Figure 14. Magnesium Chloride Market Volume and Forecasts to 2030 (Kilo Tons)
- Figure 15. Asphalt Emulsions Market Revenue and Forecasts to 2030 (US$ Million)
- Figure 16. Asphalt Emulsions Market Volume and Forecasts to 2030 (Kilo Tons)
- Figure 17. Oil Emulsions Market Revenue and Forecasts to 2030 (US$ Million)
- Figure 18. Oil Emulsions Market Volume and Forecasts to 2030 (Kilo Tons)
- Figure 19. Polymeric Emulsions Market Revenue and Forecasts to 2030 (US$ Million)
- Figure 20. Polymeric Emulsions Market Volume and Forecasts to 2030 (Kilo Tons)
- Figure 21. Others Market Revenue and Forecasts to 2030 (US$ Million)
- Figure 22. Others Market Volume and Forecasts to 2030 (Kilo Tons)
- Figure 23. Dust Control or Suppression Chemicals Market Share (%) - End-Use Industry, 2022 and 2030
- Figure 24. Mining Market Revenue and Forecasts to 2030 (US$ Million)
- Figure 25. Construction Market Revenue and Forecasts to 2030 (US$ Million)
- Figure 26. Oil and Gas Market Revenue and Forecasts to 2030 (US$ Million)
- Figure 27. Food and Beverage Market Revenue and Forecasts to 2030 (US$ Million)
- Figure 28. Textile Market Revenue and Forecasts to 2030 (US$ Million)
- Figure 29. Glass and Ceramics Market Revenue and Forecasts to 2030 (US$ Million)
- Figure 30. Pharmaceuticals Market Revenue and Forecasts to 2030 (US$ Million)
- Figure 31. Others Market Revenue and Forecasts to 2030 (US$ Million)
- Figure 32. Dust Control or Suppression Chemicals Market, by Key Countries - Revenue (2022) (US$ Million)
- Figure 33. Dust Control or Suppression Chemicals Market Breakdown by Key Countries, 2022 and 2030 (%)
- Figure 34. US Dust Control or Suppression Chemicals Market Revenue and Forecasts to 2030 (US$ Mn)
- Figure 35. US Dust Control or Suppression Chemicals Market Volume and Forecasts to 2030 (Kilo Tons)
- Figure 36. Canada Dust Control or Suppression Chemicals Market Revenue and Forecasts to 2030 (US$ Mn)
- Figure 37. Canada Dust Control or Suppression Chemicals Market Volume and Forecasts to 2030 (Kilo Tons)
- Figure 38. Mexico Dust Control or Suppression Chemicals Market Revenue and Forecasts to 2030 (US$ Mn)
- Figure 39. Mexico Dust Control or Suppression Chemicals Market Volume and Forecasts to 2030 (Kilo Tons)
- Figure 40. Heat Map Analysis by Key Players
The North America dust control or suppression chemicals market was valued at US$ 266.09 million in 2022 and is expected to reach US$ 359.05 million by 2030; it is estimated to record a CAGR of 3.8% from 2022 to 2030.
Rising Demand for Dust Control or Suppression Chemicals from Construction Industry Fuels North America Dust Control or Suppression Chemicals Market
The construction industry is one of the significant contributors to the economy of North America. According to the Associated General Contractors of America (AGC), the US construction industry constructs structures worth US$ 1.8 trillion each year. The rise in construction activities due to the increasing population and rapidly growing commercial sector across the region are driving the construction industry in North America. In November 2021, the US government approved a US$ 1.2 trillion infrastructure bill to aid federal investments in various infrastructure projects. Also, construction spending is expected to increase by 5.5% by 2023 from 2021. Such initiatives generate demand for construction services, equipment, and materials.
Dust suppression chemicals are used at the construction sites to reduce the dust generated from demolition, excavation, grading, and material handling. Dust control or suppression chemicals can be applied to unpaved surfaces, haul roads, and tailing dams for adhering to construction obligations and dealing with productivity constraints. The application of dust control or suppression chemicals during material handling reduces the presence of particulate matter and suspension of dust in the air at construction sites. Therefore, development in the construction industry is projected to fuel the demand for dust control or suppression chemicals during the forecast period.
North America Dust Control or Suppression Chemicals Market Overview
The region holds an extensive growth opportunity for the dust suppressant chemicals market players due to its growing utilization by end-use industries, including mining, construction, oils & gas, food & beverage, and textile. The construction sector in North America is witnessing growth due to a robust economy and increased federal and state financing for commercial and institutional structures. According to the US Census Bureau, the value of construction was US$ 1,792.9 billion in 2022, a 10.2% increase from US$ 1,626.4 billion spent in 2021. Many construction activities create dust. High dust levels are caused by high-energy tool utilization, such as grinders, cut-off saws, grit blasters, and wall chasers. According to the US Environmental Protection Agency, construction areas have large areas of soil disturbances, leading to an increase in levels of particle air pollution. The Clean Air Act (CAA) is a comprehensive federal law that authorizes the Environmental Protection Agency (EPA) to set standards for air quality by regulating emissions of harmful air pollutants to protect public health. Thus, the expanding construction sector and supportive government regulations create a huge demand for dust-suppressant chemicals in the region.
North America Dust Control or Suppression Chemicals Market Revenue and Forecast to 2030 (US$ Million)
North America Dust Control or Suppression Chemicals Market Segmentation
The North America dust control or suppression chemicals market is segmented based on chemical type, end-use industry, and country. Based on chemical type, the North America dust control or suppression chemicals market is segmented into lignin sulfonate, calcium chloride, magnesium chloride, asphalt emulsions, oil emulsions, polymeric emulsions, and others. The calcium chloride segment held the largest market share in 2022.
In terms of end-use industry, the North America dust control or suppression chemicals market is categorized into mining, construction, oil and gas, food and beverage, textile, glass and ceramics, pharmaceuticals, and others. The mining segment held the largest market share in 2022.
Based on country, the North America dust control or suppression chemicals market is segmented into the US, Canada, and Mexico. The US dominated the North America dust control or suppression chemicals market share in 2022.
Benetech Inc, Veolia Environnement SA, Ecolab Inc, Quaker Chemical Corp, Dow Inc, BASF SE, Solenis LLC, and Borregaard ASA are some of the leading players operating in the North America dust control or suppression chemicals market.
Table Of Contents
1. Introduction
- 1.1 The Insight Partners Research Report Guidance
- 1.2 Market Segmentation
2. Executive Summary
- 2.1 Key Market Insights
- 2.2 Market Attractiveness
3. Research Methodology
- 3.1 Coverage
- 3.2 Secondary Research
- 3.3 Primary Research
4. North America Dust Control or Suppression Chemicals Market Landscape
- 4.1 Overview
- 4.2 Porter's Five Forces Analysis
- 4.2.1 Bargaining Power of Suppliers
- 4.2.2 Bargaining Power of Buyers
- 4.2.3 Threat of New Entrants
- 4.2.4 Intensity of Competitive Rivalry
- 4.2.5 Threat of Substitutes
- 4.3 Ecosystem Analysis
5. North America Dust Control or Suppression Chemicals Market - Key Industry Dynamics
- 5.1 Market Drivers
- 5.1.1 Rising Demand for Dust Control or Suppression Chemicals from Construction Industry
- 5.1.2 Increasing Investments and Operations in Mining Sector
- 5.2 Market Restraints
- 5.2.1 Availability of Alternatives
- 5.3 Market Opportunities
- 5.3.1 Strong Growth in Pharmaceutical Industry
- 5.4 Future Trends
- 5.4.1 Research Related to Bio-Based Dust Suppression Agents
- 5.5 Impact of Drivers and Restraints:
6. Dust Control or Suppression Chemicals Market - North America Market Analysis
- 6.1 Dust Control or Suppression Chemicals Market Revenue (US$ Million), 2022 - 2030
- 6.2 Dust Control or Suppression Chemicals Market Volume (Kilo Tons), 2022 - 2030
- 6.3 Dust Control or Suppression Chemicals Market Forecast and Analysis
7. North America Dust Control or Suppression Chemicals Market Analysis - Chemical Type
- 7.1 Lignin Sulfonate
- 7.1.1 Overview
- 7.1.2 Lignin Sulfonate Market Revenue and Forecast to 2030 (US$ Million)
- 7.1.3 Lignin Sulfonate Market Volume and Forecast to 2030 (Kilo Tons)
- 7.2 Calcium Chloride
- 7.2.1 Overview
- 7.2.2 Calcium Chloride Market Revenue and Forecast to 2030 (US$ Million)
- 7.2.3 Calcium Chloride Market Volume and Forecast to 2030 (Kilo Tons)
- 7.3 Magnesium Chloride
- 7.3.1 Overview
- 7.3.2 Magnesium Chloride Market Revenue and Forecast to 2030 (US$ Million)
- 7.3.3 Magnesium Chloride Market Volume and Forecast to 2030 (Kilo Tons)
- 7.4 Asphalt Emulsions
- 7.4.1 Overview
- 7.4.2 Asphalt Emulsions Market Revenue and Forecast to 2030 (US$ Million)
- 7.4.3 Asphalt Emulsions Market Volume and Forecast to 2030 (Kilo Tons)
- 7.5 Oil Emulsions
- 7.5.1 Overview
- 7.5.2 Oil Emulsions Market Revenue and Forecast to 2030 (US$ Million)
- 7.5.3 Oil Emulsions Market Volume and Forecast to 2030 (Kilo Tons)
- 7.6 Polymeric Emulsions
- 7.6.1 Overview
- 7.6.2 Polymeric Emulsions Market Revenue and Forecast to 2030 (US$ Million)
- 7.6.3 Polymeric Emulsions Market Volume and Forecast to 2030 (Kilo Tons)
- 7.7 Others
- 7.7.1 Overview
- 7.7.2 Others Market Revenue and Forecast to 2030 (US$ Million)
- 7.7.3 Others Market Volume and Forecast to 2030 (Kilo Tons)
8. North America Dust Control or Suppression Chemicals Market Analysis - End-Use Industry
- 8.1 Mining
- 8.1.1 Overview
- 8.1.2 Mining Market Revenue and Forecast to 2030 (US$ Million)
- 8.2 Construction
- 8.2.1 Overview
- 8.2.2 Construction Market Revenue and Forecast to 2030 (US$ Million)
- 8.3 Oil and Gas
- 8.3.1 Overview
- 8.3.2 Oil and Gas Market Revenue and Forecast to 2030 (US$ Million)
- 8.4 Food and Beverage
- 8.4.1 Overview
- 8.4.2 Food and Beverage Market Revenue and Forecast to 2030 (US$ Million)
- 8.5 Textile
- 8.5.1 Overview
- 8.5.2 Textile Market Revenue and Forecast to 2030 (US$ Million)
- 8.6 Glass and Ceramics
- 8.6.1 Overview
- 8.6.2 Glass and Ceramics Market Revenue and Forecast to 2030 (US$ Million)
- 8.7 Pharmaceuticals
- 8.7.1 Overview
- 8.7.2 Pharmaceuticals Market Revenue and Forecast to 2030 (US$ Million)
- 8.8 Others
- 8.8.1 Overview
- 8.8.2 Others Market Revenue and Forecast to 2030 (US$ Million)
9. North America Dust Control or Suppression Chemicals Market - by Country Analysis
- 9.1 North America
- 9.1.1 North America Dust Control or Suppression Chemicals Market Overview
- 9.1.1.1 Dust Control or Suppression Chemicals Market Breakdown by Country
- 9.1.1.2 US Dust Control or Suppression Chemicals Market Revenue and Forecasts to 2030 (US$ Mn)
- 9.1.1.3 US Dust Control or Suppression Chemicals Market Volume and Forecasts to 2030 (Kilo Tons)
- 9.1.1.3.1 US Dust Control or Suppression Chemicals Market Breakdown by Chemical Type
- 9.1.1.3.2 US Dust Control or Suppression Chemicals Market Breakdown by End-Use Industry
- 9.1.1.4 Canada Dust Control or Suppression Chemicals Market Revenue and Forecasts to 2030 (US$ Mn)
- 9.1.1.5 Canada Dust Control or Suppression Chemicals Market Volume and Forecasts to 2030 (Kilo Tons)
- 9.1.1.5.1 Canada Dust Control or Suppression Chemicals Market Breakdown by Chemical Type
- 9.1.1.5.2 Canada Dust Control or Suppression Chemicals Market Breakdown by End-Use Industry
- 9.1.1.6 Mexico Dust Control or Suppression Chemicals Market Revenue and Forecasts to 2030 (US$ Mn)
- 9.1.1.7 Mexico Dust Control or Suppression Chemicals Market Volume and Forecasts to 2030 (Kilo Tons)
- 9.1.1.7.1 Mexico Dust Control or Suppression Chemicals Market Breakdown by Chemical Type
- 9.1.1.7.2 Mexico Dust Control or Suppression Chemicals Market Breakdown by End-Use Industry
- 9.1.1 North America Dust Control or Suppression Chemicals Market Overview
10. Industry Landscape
- 10.1 Overview
- 10.2 Product launch
11. Competitive Landscape
- 11.1 Heat Map Analysis by Key Players
12. Company Profiles
- 12.1 Benetech Inc
- 12.1.1 Key Facts
- 12.1.2 Business Description
- 12.1.3 Products and Services
- 12.1.4 Financial Overview
- 12.1.5 SWOT Analysis
- 12.1.6 Key Developments
- 12.2 Veolia Environnement SA
- 12.2.1 Key Facts
- 12.2.2 Business Description
- 12.2.3 Products and Services
- 12.2.4 Financial Overview
- 12.2.5 SWOT Analysis
- 12.2.6 Key Developments
- 12.3 Ecolab Inc
- 12.3.1 Key Facts
- 12.3.2 Business Description
- 12.3.3 Products and Services
- 12.3.4 Financial Overview
- 12.3.5 SWOT Analysis
- 12.3.6 Key Developments
- 12.4 Quaker Chemical Corp
- 12.4.1 Key Facts
- 12.4.2 Business Description
- 12.4.3 Products and Services
- 12.4.4 Financial Overview
- 12.4.5 SWOT Analysis
- 12.4.6 Key Developments
- 12.5 Dow Inc
- 12.5.1 Key Facts
- 12.5.2 Business Description
- 12.5.3 Products and Services
- 12.5.4 Financial Overview
- 12.5.5 SWOT Analysis
- 12.5.6 Key Developments
- 12.6 BASF SE
- 12.6.1 Key Facts
- 12.6.2 Business Description
- 12.6.3 Products and Services
- 12.6.4 Financial Overview
- 12.6.5 SWOT Analysis
- 12.6.6 Key Developments
- 12.7 Solenis LLC
- 12.7.1 Key Facts
- 12.7.2 Business Description
- 12.7.3 Products and Services
- 12.7.4 Financial Overview
- 12.7.5 SWOT Analysis
- 12.7.6 Key Developments
- 12.8 Borregaard ASA
- 12.8.1 Key Facts
- 12.8.2 Business Description
- 12.8.3 Products and Services
- 12.8.4 Financial Overview
- 12.8.5 SWOT Analysis
- 12.8.6 Key Developments
