|
|
市場調査レポート
商品コード
1494442
欧州の再生砂:2030年市場予測- 地域別分析- プロセス・用途別Europe Reclamation Sand Market Forecast to 2030 - Regional Analysis - By Process (Wet Reclamation, Mechanical Reclamation, and Thermal Reclamation) and Application (Foundry, and Construction & Others) |
||||||
|
|||||||
|
|||||||

| 欧州の再生砂:2030年市場予測- 地域別分析- プロセス・用途別 |
|
出版日: 2024年03月14日
発行: The Insight Partners
ページ情報: 英文 73 Pages
納期: 即納可能
|

全表示
- 概要
- 図表
- 目次
欧州の再生砂市場は、2022年に2億7,374万米ドルと評価され、2030年には4億2,040万米ドルに達すると予測され、2022年から2030年までのCAGRは5.5%で成長すると予測されています。
天然砂資源の枯渇が欧州の再生砂市場を促進
天然砂は有限な資源と考えられており、河川や海岸からの砂の採取は深刻な環境破壊を引き起こしています。政府や環境機関は天然砂の採取に厳しい規制を課しており、供給不足を招いています。その結果、再生砂の需要が大幅に増加しています。再生砂は、砕いたコンクリート、ガラス、セラミックなどのリサイクル材料から作られるため、天然砂の採取の必要性を減らすことができます。再生砂の使用は天然資源の保護に役立つだけでなく、二酸化炭素排出量や廃棄物処理量の削減にもつながります。持続可能な開発に対する意識の高まりも、再生砂の普及に貢献しています。政府や建設会社は、建設活動が環境に与える影響を軽減するため、持続可能な慣行を採用するようになってきています。採掘や産業活動のために年間約500億トンの砂が採掘されているが、この資源の補充速度は著しく遅いため、再生砂は天然砂の代替品として使用されています。再生砂は環境的な利点に加え、経済的な利点もあります。再生砂は天然砂よりも安価であることが多く、建設企業にとって魅力的な選択肢となっています。さらに、再生砂の使用は、企業が持続可能性の目標を達成するのに役立ち、企業の評判を高め、環境意識の高い顧客を引き付けることができます。このように、天然砂資源の枯渇が再生砂市場を牽引しています。
欧州の再生砂市場の概要
欧州の再生砂市場は、ドイツ、フランス、イタリア、英国、ロシア、その他欧州に区分されます。欧州の再生砂市場は、製造業における持続可能な慣行の重視の高まりにより、近年著しい成長を遂げています。2020年、ウィリアム・リー社(英国の鋳造会社)は、廃棄物の削減と持続可能性の向上のため、新しい砂再生工場に投資しました。同社の新工場は、使用済み砂の再生とリサイクルに最先端技術を採用し、廃棄物の削減と環境への影響の低減を実現しています。同様に2019年には、Fritz Winter EisengieBerei GmbH &Co.KG(ドイツの鋳造会社)は、業務の効率化と廃棄物の削減のため、新しい砂再生システムに投資しました。この新システムにより、同社は使用済み砂の最大90%をリサイクルし、環境フットプリントを大幅に削減し、持続可能な企業としての信用を向上させました。さらに、廃棄物管理と環境保護に関する欧州連合の厳しい規制が、再生砂市場の成長に寄与しています。こうした規制を受けて、多くの鋳物工場が環境への影響を減らすために砂の再生といった持続可能な手法を採用しています。さらに、砂再生方法の技術的進歩により、鋳物工場は製品の品質を損なうことなく砂を再生することが容易になった。例えば、熱再生法を用いて使用済み砂から不純物を除去し、生産工程で再利用できる高品質の再生砂を得る企業も少なくないです。このように、鋳物工場や建設工程における高品質の再生砂の需要の増加が、この地域の再生砂市場の成長を牽引しています。
欧州の再生砂市場の収益と2030年までの予測(金額)
欧州の再生砂市場のセグメンテーション
欧州の再生砂市場は、プロセス、アプリケーション、国に基づいてセグメント化されます。
プロセスに基づき、欧州の再生砂市場は湿式再生、機械式再生、熱式再生に区分されます。2022年の欧州の再生砂市場シェアは熱再生セグメントが大きいです。
用途別では、欧州の再生砂市場は鋳造と建設・その他に二分されます。2022年の欧州の再生砂市場シェアは鋳造部門が大きいです。
国別では、欧州の再生砂市場はドイツ、フランス、英国、イタリア、ロシア、その他欧州に区分されます。その他欧州が2022年の欧州の再生砂市場を独占しました。
Asahi Yukizai Corp、CQMS Razer Pty Ltd、MAT Foundry Group Ltd、Iluka Resources Ltd、Finecast Foundry Ltd、JFE Mineral &Alloy Co Ltdは、欧州の再生砂市場で事業を展開している大手企業の一部です。
目次
第1章 イントロダクション
第2章 エグゼクティブサマリー
- 主要洞察
- 市場の魅力
- 市場の魅力
第3章 調査手法
- 調査範囲
- 2次調査
- 1次調査
第4章 欧州の再生砂市場情勢
- ポーターのファイブフォース分析
- 供給企業の交渉力
- 買い手の交渉力
- 新規参入業者の脅威
- 競争企業間の敵対関係
- 代替品の脅威
- エコシステム分析
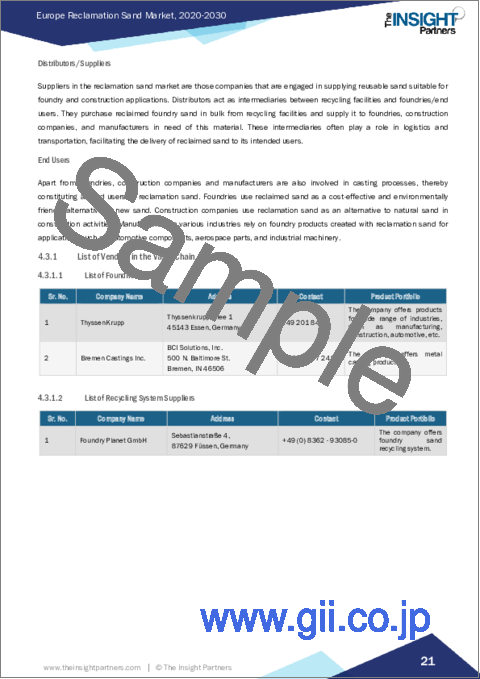
- バリューチェーンのベンダー一覧
- 鋳造メーカーのリスト
- リサイクルシステムサプライヤーのリスト
- バリューチェーンのベンダー一覧
第5章 欧州の再生砂市場:主要市場力学
- 市場促進要因
- 建設・産業用途における砂需要の増加
- 天然砂資源の枯渇
- 市場抑制要因
- 限られた再生砂の供給
- 市場機会
- 砂採掘禁止の施行
- 今後の動向
- 埋め立て砂処理の技術進歩
- 影響分析
第6章 再生砂市場-欧州市場分析
- 欧州の埋め立て砂市場数量(キロトン)
- 欧州の再生砂市場収益
- 欧州の埋め立て砂市場の予測と分析
第7章 埋め立て砂の欧州市場分析-プロセス
- 湿式埋め立て
- 機械的埋め立て
- 熱再生
第8章 埋め立て砂の欧州市場分析-用途
- 鋳造
- 建設その他
第9章 欧州の再生砂市場:国別分析
- 欧州
- ドイツ
- フランス
- イタリア
- 英国
- ロシア
- その他欧州
第10章 業界情勢
- 市場イニシアティブ
第11章 企業プロファイル
- Asahi Yukizai Corp
- CQMS Razer Pty Ltd
- MAT Foundry Group Ltd
- Iluka Resources Ltd
- Finecast Foundry Ltd
- JFE Mineral & Alloy Co Ltd
第12章 企業概要付録
List Of Tables
- Table 1. Europe Reclamation Sand Market Segmentation
- Table 2. Europe Reclamation Sand Market Volume and Forecasts to 2030 (Kilo Tons)
- Table 3. Europe Reclamation Sand Market Revenue and Forecasts to 2030 (US$ Million)
- Table 4. Europe Reclamation Sand Market Volume and Forecasts to 2030 (Kilo Tons) - Process
- Table 5. Europe Reclamation Sand Market Revenue and Forecasts to 2030 (US$ Million) - Process
- Table 6. Europe Reclamation Sand Market Revenue and Forecasts to 2030 (US$ Million) - Application
- Table 7. Germany Reclamation Sand Market Volume and Forecasts to 2030 (Kilo Tons) - By Process
- Table 8. Germany Reclamation Sand Market Revenue and Forecasts to 2030 (US$ Million) - By Process
- Table 9. Germany Reclamation Sand Market Revenue and Forecasts to 2030 (US$ Million) - By Application
- Table 10. France Reclamation Sand Market Volume and Forecasts to 2030 (Kilo Tons) - By Process
- Table 11. France Reclamation Sand Market Revenue and Forecasts to 2030 (US$ Million) - By Process
- Table 12. France Reclamation Sand Market Revenue and Forecasts to 2030 (US$ Million) - By Application
- Table 13. Italy Reclamation Sand Market Volume and Forecasts to 2030 (Kilo Tons) - By Process
- Table 14. Italy Reclamation Sand Market Revenue and Forecasts to 2030 (US$ Million) - By Process
- Table 15. Italy Reclamation Sand Market Revenue and Forecasts to 2030 (US$ Million) - By Application
- Table 16. The UK Reclamation Sand Market Volume and Forecasts to 2030 (Kilo Tons) - By Process
- Table 17. The UK Reclamation Sand Market Revenue and Forecasts to 2030 (US$ Million) - By Process
- Table 18. UK Reclamation Sand Market Revenue and Forecasts to 2030 (US$ Million) - By Application
- Table 19. Russia Reclamation Sand Market Volume and Forecasts to 2030 (Kilo Tons) - By Process
- Table 20. Russia Reclamation Sand Market Revenue and Forecasts to 2030 (US$ Million) - By Process
- Table 21. Russia Reclamation Sand Market Revenue and Forecasts to 2030 (US$ Million) - By Application
- Table 22. Rest of Europe Reclamation Sand Market Volume and Forecasts to 2030 (Kilo Tons) - By Process
- Table 23. Rest of Europe Reclamation Sand Market Revenue and Forecasts to 2030 (US$ Million) - By Process
- Table 24. Rest of Europe Reclamation Sand Market Revenue and Forecasts to 2030 (US$ Million) - By Application
List Of Figures
- Figure 1. Europe Reclamation Sand Market Segmentation, By Country
- Figure 2. Porter's Five Forces Analysis
- Figure 3. Ecosystem: Europe Metal Casting Market
- Figure 4. Market Dynamics: Europe Reclamation Sand Market
- Figure 5. Reclamation Sand Market Impact Analysis of Drivers and Restraints
- Figure 6. Europe Reclamation Sand Market Volume (Kilo Tons), 2020 - 2030
- Figure 7. Europe Reclamation Sand Market Revenue (US$ Million), 2020 - 2030
- Figure 8. Europe Reclamation Sand Market Share (%) - Process, 2022 and 2030
- Figure 9. Wet Reclamation: Europe Reclamation Sand Market Volume and Forecasts to 2030 (Kilo Tons)
- Figure 10. Wet Reclamation: Europe Reclamation Sand Market Revenue and Forecasts to 2030 (US$ Million)
- Figure 11. Mechanical Reclamation: Europe Reclamation Sand Market Volume and Forecasts to 2030 (Kilo Tons)
- Figure 12. Mechanical Reclamation: Europe Reclamation Sand Market Revenue and Forecasts to 2030 (US$ Million)
- Figure 13. Thermal Reclamation : Europe Reclamation Sand Market Volume and Forecasts to 2030 (Kilo Tons)
- Figure 14. Thermal Reclamation : Europe Reclamation Sand Market Revenue and Forecasts to 2030 (US$ Million)
- Figure 15. Europe Reclamation Sand Market Share (%) - Application, 2022 and 2030
- Figure 16. Foundry: Europe Reclamation Sand Market Revenue and Forecasts to 2030 (US$ Million)
- Figure 17. Construction and Others: Europe Reclamation Sand Market Revenue and Forecasts to 2030 (US$ Million)
- Figure 18. Europe Reclamation Sand Market Revenue, by Key Countries, (2022) (US$ Mn)
- Figure 19. Europe Reclamation Sand Market Breakdown by Key Countries, 2022 and 2030 (%)
- Figure 20. Germany Reclamation Sand Market Volume and Forecasts to 2030 (Kilo Tons)
- Figure 21. Germany Reclamation Sand Market Revenue and Forecasts to 2030 (US$ Million)
- Figure 22. France Reclamation Sand Market Volume and Forecasts to 2030 (Kilo Tons)
- Figure 23. France Reclamation Sand Market Revenue and Forecasts to 2030 (US$ Million)
- Figure 24. Italy Reclamation Sand Market Volume and Forecasts to 2030 (Kilo Tons)
- Figure 25. Italy Reclamation Sand Market Revenue and Forecasts to 2030 (US$ Million)
- Figure 26. The UK Reclamation Sand Market Volume and Forecasts to 2030 (Kilo Tons)
- Figure 27. The UK Reclamation Sand Market Revenue and Forecasts to 2030 (US$ Million)
- Figure 28. Russia Reclamation Sand Market Volume and Forecasts to 2030 (Kilo Tons)
- Figure 29. Russia Reclamation Sand Market Revenue and Forecasts to 2030 (US$ Million)
- Figure 30. Rest of Europe Reclamation Sand Market Volume and Forecasts to 2030 (Kilo Tons)
- Figure 31. Rest of Europe Reclamation Sand Market Revenue and Forecasts to 2030 (US$ Million)
The Europe reclamation sand market was valued at US$ 273.74 million in 2022 and is expected to reach US$ 420.40 million by 2030; it is estimated to grow at a CAGR of 5.5% from 2022 to 20 30.
Depletion of Natural Sand Resources Fuels the Europe Reclamation Sand Market
Natural sand is considered a finite resource, and the extraction of sand from rivers and beaches has resulted in severe environmental damage. Governments and environmental agencies have imposed strict regulations on the extraction of natural sand, leading to a shortage of supply. As a result, the demand for reclamation sand has increased significantly. Reclamation sand is made from recycled materials such as crushed concrete, glass, and ceramics, which reduces the need for natural sand extraction. The use of reclamation sand not only helps to conserve natural resources but also reduces carbon emissions and waste disposal. The growing awareness of sustainable development practices has also contributed to the popularity of reclamation sand. Governments and construction companies are increasingly adopting sustainable practices to mitigate the impact of construction activities on the environment. Approximately 50 billion tons of sand is extracted annually for extraction and industrial activities, and the rate of replenishment of this resource is significantly slower; hence, reclamation sand is used as a substitute for natural sand. In addition to environmental benefits, reclamation sand also offers economic advantages. It is often cheaper than natural sand, which makes it an attractive option for construction enterprises. Moreover, the use of reclamation sand can help companies meet sustainability targets, which can improve their reputation and attract environmentally conscious clients. Thus, the depletion of natural sand resources is driving the reclamation sand market.
Europe Reclamation Sand Market Overview
The Europe reclamation sand market is segmented into Germany, France, Italy, the UK, Russia, and the Rest of Europe. The reclamation sand market in Europe has witnessed significant growth in recent years, driven by the growing emphasis on sustainable practices in the manufacturing industry. In 2020, William Lee Ltd (a UK-based foundry firm) invested in a new sand reclamation plant to reduce waste and improve sustainability. The company's new plant uses cutting-edge technology to reclaim and recycle used sand, reducing waste and the environmental impact of its operations. Similarly, in 2019, Fritz Winter EisengieBerei GmbH & Co. KG (a German foundry firm) invested in a new sand reclamation system to improve the efficiency of its operations and reduce waste. The new system has helped the company recycle up to 90% of its used sand, significantly reducing its environmental footprint and improving its sustainability credentials. Moreover, the European Union's strict regulations on waste management and environmental protection have contributed to the growth of the reclamation sand market. In response to these regulations, many foundries are adopting sustainable practices such as sand reclamation to reduce their environmental impact. Furthermore, technological advancements in sand reclamation methods have made it easier for foundries to recycle sand without compromising the quality of their products. For example, a few companies use thermal reclamation methods to remove impurities from used sand, resulting in high-quality reclaimed sand that can be reused in production processes. Thus, the increased demand for high-quality reclamation sand in foundries and construction processes drives the reclamation sand market growth in the region.
Europe Reclamation Sand Market Revenue and Forecast to 2030 (US$ Million)
Europe Reclamation Sand Market Segmentation
The Europe Reclamation Sand Market is segmented based on Process, Application, and country.
Based on process, the Europe reclamation sand market is segmented into wet reclamation, mechanical reclamation and thermal reclamation. The thermal reclamation segment held a larger Europe reclamation sand market share in 2022.
In terms of application, the Europe reclamation sand market is bifurcated into foundry and construction & others. The foundry segment held a larger Europe reclamation sand market share in 2022.
Based on country, the Europe reclamation sand market is segmented into Germany, France, the UK, Italy, Russia, and the Rest of Europe. The Rest of Europe dominated the Europe reclamation sand market in 2022.
Asahi Yukizai Corp, CQMS Razer Pty Ltd, MAT Foundry Group Ltd, Iluka Resources Ltd, Finecast Foundry Ltd, and JFE Mineral & Alloy Co Ltd are some of the leading companies operating in the Europe reclamation sand market.
Table Of Contents
1. Introduction
- 1.1 The Insight Partners Research Report Guidance
- 1.2 Market Segmentation
2. Executive Summary
- 2.1 Key Insights
- 2.2 Market Attractiveness
- 2.2.1 Market Attractiveness
3. Research Methodology
- 3.1 Coverage
- 3.2 Secondary Research
- 3.3 Primary Research
4. Europe Reclamation Sand Market Landscape
- 4.1 Overview
- 4.2 Porter's Five Forces Analysis
- 4.2.1 Bargaining Power of Suppliers
- 4.2.2 Bargaining Power of Buyers
- 4.2.3 Threat of New Entrants
- 4.2.4 Intensity of Competitive Rivalry
- 4.2.5 Threat of Substitutes
- 4.3 Ecosystem Analysis
- 4.3.1 List of Vendors in the Value Chain
- 4.3.1.1 List of Foundries
- 4.3.1.2 List of Recycling System Suppliers
- 4.3.1 List of Vendors in the Value Chain
5. Europe Reclamation Sand Market - Key Market Dynamics
- 5.1 Market Drivers
- 5.1.1 Growing Demand for Sand in Construction and Industrial Applications
- 5.1.2 Depletion of Natural Sand Resources
- 5.2 Market Restraints
- 5.2.1 Limited Supply of Reclamation Sand
- 5.3 Market Opportunities
- 5.3.1 Enforcement of Ban on Sand Mining
- 5.4 Future Trends
- 5.4.1 Technological Advancements in Reclamation Sand Processing
- 5.5 Impact Analysis
6. Reclamation Sand Market - Europe Market Analysis
- 6.1 Europe Reclamation Sand Market Volume (Kilo Tons)
- 6.2 Europe Reclamation Sand Market Revenue (US$ Million)
- 6.3 Europe Reclamation Sand Market Forecast and Analysis
7. Europe Reclamation Sand Market Analysis - Process
- 7.1 Wet Reclamation
- 7.1.1 Overview
- 7.1.2 Wet Reclamation: Europe Reclamation Sand Market Volume, Revenue and Forecast to 2030 (Kilo Tons) (US$ Million)
- 7.2 Mechanical Reclamation
- 7.2.1 Overview
- 7.2.2 Mechanical Reclamation: Europe Reclamation Sand Market Volume, Revenue and Forecast to 2030 (Kilo Tons) (US$ Million)
- 7.3 Thermal Reclamation
- 7.3.1 Overview
- 7.3.2 Thermal Reclamation : Europe Reclamation Sand Market Volume, Revenue and Forecast to 2030 (Kilo Tons) (US$ Million)
8. Europe Reclamation Sand Market Analysis - Application
- 8.1 Foundry
- 8.1.1 Overview
- 8.1.2 Foundry: Europe Reclamation Sand Market Revenue and Forecast to 2030 (US$ Million)
- 8.2 Construction and Others
- 8.2.1 Overview
- 8.2.2 Construction and Others: Europe Reclamation Sand Market Revenue and Forecast to 2030 (US$ Million)
9. Europe Reclamation Sand Market - Country Analysis
- 9.1 Europe
- 9.1.1 Europe Reclamation Sand Market Overview
- 9.1.2 Europe Reclamation Sand Market Revenue and Forecasts and Analysis - By Countries
- 9.1.2.1 Europe Reclamation Sand Market Breakdown by Country
- 9.1.2.2 Germany Reclamation Sand Market Volume and Forecasts to 2030 (Kilo Tons)
- 9.1.2.3 Germany Reclamation Sand Market Revenue and Forecasts to 2030 (US$ Million)
- 9.1.2.3.1 Germany Reclamation Sand Market Breakdown by Process
- 9.1.2.3.2 Germany Reclamation Sand Market Breakdown by Process
- 9.1.2.3.3 Germany Reclamation Sand Market Breakdown by Application
- 9.1.2.4 France Reclamation Sand Market Volume and Forecasts to 2030 (Kilo Tons)
- 9.1.2.5 France Reclamation Sand Market Revenue and Forecasts to 2030 (US$ Million)
- 9.1.2.5.1 France Reclamation Sand Market Breakdown by Process
- 9.1.2.5.2 France Reclamation Sand Market Breakdown by Process
- 9.1.2.5.3 France Reclamation Sand Market Breakdown by Application
- 9.1.2.6 Italy Reclamation Sand Market Volume and Forecasts to 2030 (Kilo Tons)
- 9.1.2.7 Italy Reclamation Sand Market Revenue and Forecasts to 2030 (US$ Million)
- 9.1.2.7.1 Italy Reclamation Sand Market Breakdown by Process
- 9.1.2.7.2 Italy Reclamation Sand Market Breakdown by Process
- 9.1.2.7.3 Italy Reclamation Sand Market Breakdown by Application
- 9.1.2.8 The UK Reclamation Sand Market Volume and Forecasts to 2030 (Kilo Tons)
- 9.1.2.9 The UK Reclamation Sand Market Revenue and Forecasts to 2030 (US$ Million)
- 9.1.2.9.1 The UK Reclamation Sand Market Breakdown by Process
- 9.1.2.9.2 The UK Reclamation Sand Market Breakdown by Process
- 9.1.2.9.3 UK Reclamation Sand Market Breakdown by Application
- 9.1.2.10 Russia Reclamation Sand Market Volume and Forecasts to 2030 (Kilo Tons)
- 9.1.2.11 Russia Reclamation Sand Market Revenue and Forecasts to 2030 (US$ Million)
- 9.1.2.11.1 Russia Reclamation Sand Market Breakdown by Process
- 9.1.2.11.2 Russia Reclamation Sand Market Breakdown by Process
- 9.1.2.11.3 Russia Reclamation Sand Market Breakdown by Application
- 9.1.2.12 Rest of Europe Reclamation Sand Market Volume and Forecasts to 2030 (Kilo Tons)
- 9.1.2.13 Rest of Europe Reclamation Sand Market Revenue and Forecasts to 2030 (US$ Million)
- 9.1.2.13.1 Rest of Europe Reclamation Sand Market Breakdown by Process
- 9.1.2.13.2 Rest of Europe Reclamation Sand Market Breakdown by Process
- 9.1.2.13.3 Rest of Europe Reclamation Sand Market Breakdown by Application
10. Industry Landscape
- 10.1 Overview
- 10.2 Market Initiative
11. Company Profiles
- 11.1 Asahi Yukizai Corp
- 11.1.1 Key Facts
- 11.1.2 Business Description
- 11.1.3 Products and Services
- 11.1.4 Financial Overview
- 11.1.5 SWOT Analysis
- 11.1.6 Key Developments
- 11.2 CQMS Razer Pty Ltd
- 11.2.1 Key Facts
- 11.2.2 Business Description
- 11.2.3 Products and Services
- 11.2.4 Financial Overview
- 11.2.5 SWOT Analysis
- 11.2.6 Key Developments
- 11.3 MAT Foundry Group Ltd
- 11.3.1 Key Facts
- 11.3.2 Business Description
- 11.3.3 Products and Services
- 11.3.4 Financial Overview
- 11.3.5 SWOT Analysis
- 11.3.6 Key Developments
- 11.4 Iluka Resources Ltd
- 11.4.1 Key Facts
- 11.4.2 Business Description
- 11.4.3 Products and Services
- 11.4.4 Financial Overview
- 11.4.5 SWOT Analysis
- 11.4.6 Key Developments
- 11.5 Finecast Foundry Ltd
- 11.5.1 Key Facts
- 11.5.2 Business Description
- 11.5.3 Products and Services
- 11.5.4 Financial Overview
- 11.5.5 SWOT Analysis
- 11.5.6 Key Developments
- 11.6 JFE Mineral & Alloy Co Ltd
- 11.6.1 Key Facts
- 11.6.2 Business Description
- 11.6.3 Products and Services
- 11.6.4 Financial Overview
- 11.6.5 SWOT Analysis
- 11.6.6 Key Developments

