|
|
市場調査レポート
商品コード
1494441
アジア太平洋の再生砂:2030年市場予測-地域別分析-プロセス別、用途別Asia Pacific Reclamation Sand Market Forecast to 2030 - Regional Analysis - By Process (Wet Reclamation, Mechanical Reclamation, and Thermal Reclamation) and Application (Foundry, and Construction & Others) |
||||||
|
|||||||
|
|||||||

| アジア太平洋の再生砂:2030年市場予測-地域別分析-プロセス別、用途別 |
|
出版日: 2024年03月14日
発行: The Insight Partners
ページ情報: 英文 78 Pages
納期: 即納可能
|

全表示
- 概要
- 図表
- 目次
アジア太平洋の再生砂市場は、2022年には10億5,598万米ドルと評価され、2030年には17億6,720万米ドルに達すると予測され、2022~2030年のCAGRは6.6%で成長すると予測されています。
砂採掘禁止の施行がアジア太平洋の再生砂市場に拍車をかける
砂の採掘は環境悪化の主要原因であり、天然砂資源の枯渇につながっています。近年、インド、マレーシア、カンボジアなど多くの国で砂の採掘禁止が実施され、天然砂の供給が大幅に減少するため、再生砂の需要が増加する可能性があります。これにより、様々な建設プロジェクトで天然砂の代用品として使用できる再生砂の市場が形成されると予想されます。さらに、再生砂の使用は、砂の採掘が環境に与える悪影響を軽減するのに役立ちます。再生砂は、通常であれば再生処分されてしまう廃棄物から作られるため、廃棄物の発生量を減らし、サステイナブル慣行を促進します。さらに、再生砂の使用は、天然砂よりも生産に必要なエネルギーが少ないため、建設活動に伴う二酸化炭素排出量の削減にも役立ちます。砂の採掘禁止を実施することで、リサイクルのインフラや技術への投資を促すこともできます。その結果、より効率的で効果的なリサイクル工程が開発され、建設目的に必要な基準を満たす、より高品質の再生砂を得ることができます。そのため、砂の採掘禁止の施行は今後数年間、再生砂市場に有利な機会を提供すると予想されます。
アジア太平洋再生砂市場概要
アジア太平洋は世界最大の大陸であり、その多様な文化で有名です。中国、日本、インド、韓国、オーストラリアはアジア太平洋の主要経済国の一つです。アジア太平洋の再生砂市場は、急成長する製造部門とサステイナブル慣行への重点の高まりによって、近年著しい成長を遂げています。鋳物再生砂とは、金属鋳造工程で使用される砂のリサイクルと再利用を指し、廃棄物の削減と環境責任の促進を実現します。同地域における自動車内装部品の開発と電気自動車生産の増加は、再生砂にとって有利な機会を生み出すと期待されています。2020年には、Kirloskar Ferrous Industries Ltd.(インドを拠点とする鋳造会社)は、廃棄物の削減と持続可能性の向上のため、新しい砂再生工場に投資しました。同社の新工場では、熱再生法を用いて使用済み砂から不純物を除去し、生産工程で再利用できる高品質の再生砂を生産しています。さらに、環境規制と持続可能性への懸念は、アジア太平洋の鋳物工場が再生プロセスを積極的に採用するよう促しています。例えば、世界最大の鋳物生産国である中国は、厳しい排出基準を導入したため、鋳物工場は二酸化炭素排出量を削減するために再生技術に投資するようになりました。同様にインドでは、鋳物工場が生産工程で少なくとも25%の再生砂を使用することを義務付ける規制を実施しています。このため、高品質の再生砂の需要が高まり、砂再生プラントへの投資に拍車がかかっています。これら全ての要因がアジア太平洋の再生砂市場の成長を促進しています。
アジア太平洋の再生砂市場の収益と2030年までの予測(金額)
アジア太平洋再生砂市場のセグメンテーション
アジア太平洋の再生砂市場は、プロセス、用途、国に基づいてセグメント化されます。
プロセス別では、アジア太平洋の再生砂市場は湿式再生、機械式再生、熱再生に区分されます。熱再生セグメントは2022年にアジア太平洋の再生砂市場で最大のシェアを占めました。
用途別では、アジア太平洋の再生砂市場は鋳造と建設・その他に二分されます。2022年のアジア太平洋再生砂市場シェアは、鋳造部門が大きいです。
国別に見ると、アジア太平洋の再生砂市場は中国、日本、インド、韓国、オーストラリア、その他のアジア太平洋に区分されます。2022年のアジア太平洋再生砂市場は中国が独占。
Asahi Yukizai Corp、CQMS Razer Pty Ltd、Iluka Resources Ltd、JFE Mineral &Alloy Co Ltd、Mangalore Minerals Pvt Ltd、MAT Foundry Group Ltd、Pioneer Construction Materials Pty Ltd、TOCHU Corpは、アジア太平洋の再生砂市場で事業を展開している大手企業です。
目次
第1章 イントロダクション
第2章 エグゼクティブ概要
- 主要洞察
- 市場の魅力
- 市場の魅力
第3章 調査手法
- 調査範囲
- 2次調査
- 1次調査
第4章 アジア太平洋再生砂市場情勢
- イントロダクション
- ポーターのファイブフォース分析
- 供給企業の交渉力
- 買い手の交渉力
- 新規参入業者の脅威
- 競争企業間の敵対関係
- 代替品の脅威
- エコシステム分析
- バリューチェーンのベンダー一覧
- 鋳造メーカー一覧
- リサイクルシステムサプライヤー一覧
- バリューチェーンのベンダー一覧
第5章 アジア太平洋の再生砂市場:主要市場力学
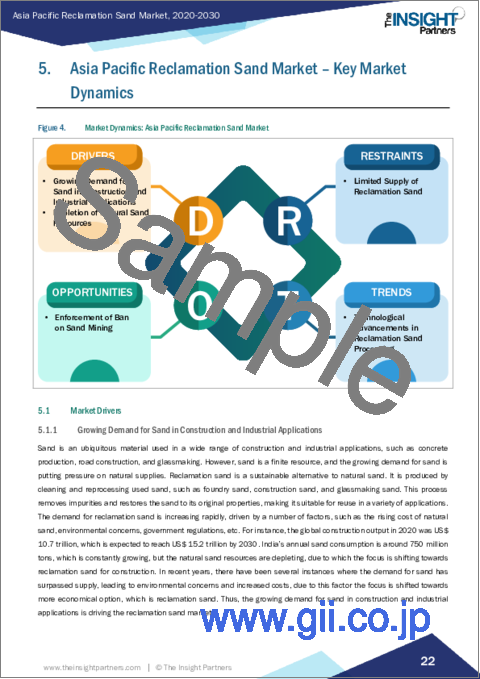
- 市場促進要因
- 建設・産業用途における砂需要の増加
- 天然砂資源の枯渇
- 市場抑制要因
- 限られた再生砂の供給
- 市場機会
- 砂採掘禁止の施行
- 今後の動向
- 再生砂処理の技術進歩
- 影響分析
第6章 再生砂市場-アジア太平洋市場分析
- アジア太平洋の再生砂市場数量(キロトン)
- アジア太平洋の再生砂市場収益
- アジア太平洋の再生砂市場の予測と分析
第7章 アジア太平洋の再生砂市場分析-プロセス
- 湿式再生
- 湿式再生:アジア太平洋再生砂市場の2030年までの数量、収益、予測(キロトン)
- 機械式再生
- 機械式再生:アジア太平洋再生砂市場の2030年までの数量、収益、予測(キロトン)
- 熱再生
- 熱再生:アジア太平洋再生砂市場の2030年までの数量、収益、予測(キロトン)
第8章 アジア太平洋の再生砂市場分析-用途
- 鋳造
- 鋳物:アジア太平洋再生砂市場の2030年までの収益、予測
- 建設等
- 建設業等:アジア太平洋再生砂市場の2030年までの収益、予測
第9章 アジア太平洋の再生砂市場:国別分析
- アジア太平洋
- オーストラリア
- 中国
- インド
- 日本
- 韓国
- その他のアジア太平洋
第10章 業界情勢
- イントロダクション
- 市場イニシアティブ
第11章 企業プロファイル
- Asahi Yukizai Corp
- Mangalore Minerals Pvt Ltd
- TOCHU Corp
- CQMS Razer Pty Ltd
- MAT Foundry Group Ltd
- Iluka Resources Ltd
- Pioneer Construction Materials Pty Ltd
- JFE Mineral & Alloy Co Ltd
第12章 企業概要付録
List Of Tables
- Table 1. Asia Pacific Reclamation Sand Market Segmentation
- Table 2. Asia Pacific Reclamation Sand Market Volume and Forecasts To 2030 (Kilo Tons)
- Table 3. Asia Pacific Reclamation Sand Market Revenue and Forecasts To 2030 (US$ Million)
- Table 4. Asia Pacific Reclamation Sand Market Volume and Forecasts To 2030 (Kilo Tons) - Process
- Table 5. Asia Pacific Reclamation Sand Market Revenue and Forecasts To 2030 (US$ Million) - Process
- Table 6. Asia Pacific Reclamation Sand Market Revenue and Forecasts To 2030 (US$ Million) - Application
- Table 7. Australia Reclamation Sand Market Volume and Forecasts To 2030 (Kilo Tons) - By Process
- Table 8. Australia Reclamation Sand Market Revenue and Forecasts To 2030 (US$ Million) - By Process
- Table 9. Australia Reclamation Sand Market Revenue and Forecasts To 2030 (US$ Million) - By Application
- Table 10. China Reclamation Sand Market Volume and Forecasts To 2030 (Kilo Tons) - By Process
- Table 11. China Reclamation Sand Market, by Process - Revenue and Forecast to 2030 (USD Million)
- Table 12. China Reclamation Sand Market Revenue and Forecasts To 2030 (US$ Million) - By Application
- Table 13. India Reclamation Sand Market Volume and Forecasts To 2030 (Kilo Tons) - By Process
- Table 14. India Reclamation Sand Market Revenue and Forecasts To 2030 (US$ Million) - By Process
- Table 15. India Reclamation Sand Market Revenue and Forecasts To 2030 (US$ Million) - By Application
- Table 16. Japan Reclamation Sand Market Volume and Forecasts To 2030 (Kilo Tons) - By Process
- Table 17. Japan Reclamation Sand Market Revenue and Forecasts To 2030 (US$ Million) - By Process
- Table 18. Japan Reclamation Sand Market Revenue and Forecasts To 2030 (US$ Million) - By Application
- Table 19. South Korea Reclamation Sand Market Revenue and Forecasts To 2030 (Kilo Ton) - By Process
- Table 20. South Korea Reclamation Sand Market Revenue and Forecasts To 2030 (US$ Million) - By Process
- Table 21. South Korea Reclamation Sand Market Revenue and Forecasts To 2030 (US$ Million) - By Application
- Table 22. Rest of Asia Pacific Reclamation Sand Market Volume and Forecasts To 2030 (Kilo Tons) - By Process
- Table 23. Rest of Asia Pacific Reclamation Sand Market Revenue and Forecasts To 2030 (US$ Million) - By Process
- Table 24. Rest of Asia Pacific Reclamation Sand Market Revenue and Forecasts To 2030 (US$ Million) - By Application
List Of Figures
- Figure 1. Asia Pacific Reclamation Sand Market Segmentation, By Country
- Figure 2. Porter's Five Forces Analysis
- Figure 3. Ecosystem: Asia Pacific reclamation sand market
- Figure 4. Market Dynamics: Asia Pacific Reclamation Sand Market
- Figure 5. Asia Pacific Reclamation Sand Market Impact Analysis of Drivers and Restraints
- Figure 6. Asia Pacific Reclamation Sand Market Volume (Kilo Tons), 2020 - 2030
- Figure 7. Asia Pacific Reclamation Sand Market Revenue (US$ Million), 2020 - 2030
- Figure 8. Asia Pacific Reclamation Sand Market Share (%) - Process, 2022 and 2030
- Figure 9. Wet Reclamation: Asia Pacific Reclamation Sand Market Volume and Forecasts To 2030 (Kilo Tons)
- Figure 10. Wet Reclamation: Asia Pacific Reclamation Sand Market Revenue and Forecasts To 2030 (US$ Million)
- Figure 11. Mechanical Reclamation: Asia Pacific Reclamation Sand Market Volume and Forecasts To 2030 (Kilo Tons)
- Figure 12. Mechanical Reclamation: Asia Pacific Reclamation Sand Market Revenue and Forecasts To 2030 (US$ Million)
- Figure 13. Thermal Reclamation: Asia Pacific Reclamation Sand Market Volume and Forecasts To 2030 (Kilo Tons)
- Figure 14. Thermal Reclamation: Asia Pacific Reclamation Sand Market Revenue and Forecasts To 2030 (US$ Million)
- Figure 15. Asia Pacific Reclamation Sand Market Share (%) - Application, 2022 and 2030
- Figure 16. Foundry: Asia Pacific Reclamation Sand Market Revenue and Forecasts To 2030 (US$ Million)
- Figure 17. Construction and Others: Asia Pacific Reclamation Sand Market Revenue and Forecasts To 2030 (US$ Million)
- Figure 18. Asia Pacific Reclamation Sand Market Revenue, by Key Countries, (2022) (US$ Mn)
- Figure 19. Asia Pacific Reclamation Sand Market Breakdown by Key Countries, 2022 and 2030 (%)
- Figure 20. Australia Reclamation Sand Market Volume and Forecasts To 2030 (Kilo Tons)
- Figure 21. Australia Reclamation Sand Market Revenue and Forecasts To 2030 (US$ Million)
- Figure 22. China Reclamation Sand Market Volume and Forecasts To 2030 (Kilo Tons)
- Figure 23. China Reclamation Sand Market Revenue and Forecasts To 2030 (US$ Million)
- Figure 24. India Reclamation Sand Market Volume and Forecasts To 2030 (Kilo Tons)
- Figure 25. India Reclamation Sand Market Revenue and Forecasts To 2030 (US$ Million)
- Figure 26. Japan Reclamation Sand Market Volume and Forecasts To 2030 (Kilo Tons)
- Figure 27. Japan Reclamation Sand Market Revenue and Forecasts To 2030 (US$ Million)
- Figure 28. South Korea Reclamation Sand Market Volume and Forecasts To 2030 (Kilo Tons)
- Figure 29. South Korea Reclamation Sand Market Revenue and Forecasts To 2030 (US$ Million)
- Figure 30. Rest of Asia Pacific Reclamation Sand Market Volume and Forecasts To 2030 (Kilo Tons)
- Figure 31. Rest of Asia Pacific Reclamation Sand Market Revenue and Forecasts To 2030 (US$ Million)
The Asia Pacific reclamation sand market was valued at US$ 1,055.98 million in 2022 and is expected to reach US$ 1,767.20 million by 2030; it is estimated to grow at a CAGR of 6.6% from 2022 to 2030.
Enforcement of Ban on Sand Mining Fuel Asia Pacific Reclamation Sand Market
Sand mining has been a major source of environmental degradation and has led to the depletion of natural sand resources. With the implementation of a ban on sand mining in recent years in many countries such as India, Malaysia, Cambodia, etc., there will be a significant reduction in the supply of natural sand, which can lead to an increase in demand for reclamation sand. This is expected to create a market for recycled sand, which can be used as a substitute for natural sand in various construction projects. Moreover, the use of reclamation sand can help to reduce the adverse impacts of sand mining on the environment. Reclaimed sand is made from waste materials that would otherwise end up in landfills, reducing the amount of waste generated and promoting sustainable practices. Additionally, the use of reclaimed sand can help to reduce the carbon footprint that results from construction activities, as it requires less energy for production than natural sand. Enforcement of a ban on sand mining can also encourage investment in recycling infrastructure and technology. This can lead to the development of more efficient and effective recycling processes, resulting in higher-quality reclamation sand that meets the required standards for construction purposes. Therefore, the enforcement of a ban on sand mining is expected to offer lucrative opportunities for the reclamation sand market over the coming years.
Asia Pacific Reclamation Sand Market Overview
Asia Pacific is the largest continent in the world and is renowned for its varied culture. China, Japan, India, South Korea, and Australia are among the major economies in Asia Pacific. The reclamation sand market in Asia Pacific has witnessed significant growth in recent years, driven by the burgeoning manufacturing sector and increased emphasis on sustainable practices. Foundry reclamation sand refers to recycling and reusing sand used in metal casting processes, reducing waste and promoting environmental responsibility. The development of automotive interior parts in the region and the rise of electric vehicle production are expected to create lucrative opportunities for reclamation sand. In 2020, Kirloskar Ferrous Industries Ltd. (an India-based foundry firm) invested in a new sand reclamation plant to reduce waste and improve sustainability. The company's new plant uses thermal reclamation methods to remove impurities from used sand, producing high-quality reclaimed sand that can be reused in production processes. Furthermore, environmental regulations and sustainability concerns have encouraged foundries in Asia Pacific to adopt reclamation processes actively. For instance, China, as the world's largest producer of castings, introduced stringent emissions standards, prompting foundries to invest in reclamation technologies to reduce their carbon footprint. Similarly, India has implemented regulations that require foundries to use at least 25% of reclaimed sand in their production processes. This has increased the demand for high-quality reclaimed sand and spurred investment in sand reclamation plants. All these factors propel the growth of the reclamation sand market in Asia Pacific.
Asia Pacific Reclamation Sand Market Revenue and Forecast to 2030 (US$ Million)
Asia Pacific Reclamation Sand Market Segmentation
The Asia Pacific Reclamation Sand Market is segmented based on process, application, and country.
Based on process, the Asia Pacific reclamation sand market is segmented into wet reclamation, mechanical reclamation, and thermal reclamation. The thermal reclamation segment held the largest Asia Pacific reclamation sand market share in 2022.
In terms of application, the Asia Pacific reclamation sand market is bifurcated into foundry and construction & others. The foundry segment held a larger Asia Pacific reclamation sand market share in 2022.
Based on country, the Asia Pacific reclamation sand market is segmented into China, Japan, India, South Korea, Australia, and the Rest of Asia Pacific. China dominated the Asia Pacific reclamation sand market in 2022.
Asahi Yukizai Corp, CQMS Razer Pty Ltd, Iluka Resources Ltd, JFE Mineral & Alloy Co Ltd, Mangalore Minerals Pvt Ltd, MAT Foundry Group Ltd, Pioneer Construction Materials Pty Ltd, and TOCHU Corp are some of the leading companies operating in the Asia Pacific reclamation sand market.
Table Of Contents
1. Introduction
- 1.1 The Insight Partners Research Report Guidance
- 1.2 Market Segmentation
2. Executive Summary
- 2.1 Key Insights
- 2.2 Market Attractiveness
- 2.2.1 Market Attractiveness
3. Research Methodology
- 3.1 Coverage
- 3.2 Secondary Research
- 3.3 Primary Research
4. Asia Pacific Reclamation Sand Market Landscape
- 4.1 Overview
- 4.2 Porter's Five Forces Analysis
- 4.2.1 Bargaining Power of Suppliers
- 4.2.2 Bargaining Power of Buyers
- 4.2.3 Threat of New Entrants
- 4.2.4 Intensity of Competitive Rivalry
- 4.2.5 Threat of Substitutes
- 4.3 Ecosystem Analysis
- 4.3.1 List of Vendors in the Value Chain
- 4.3.1.1 List of Foundries
- 4.3.1.2 List of Recycling System Suppliers
- 4.3.1 List of Vendors in the Value Chain
5. Asia Pacific Reclamation Sand Market - Key Market Dynamics
- 5.1 Market Drivers
- 5.1.1 Growing Demand for Sand in Construction and Industrial Applications
- 5.1.2 Depletion of Natural Sand Resources
- 5.2 Market Restraints
- 5.2.1 Limited Supply of Reclamation Sand
- 5.3 Market Opportunities
- 5.3.1 Enforcement of Ban on Sand Mining
- 5.4 Future Trends
- 5.4.1 Technological Advancements in Reclamation Sand Processing
- 5.5 Impact Analysis
6. Reclamation Sand Market - Asia Pacific Market Analysis
- 6.1 Asia Pacific Reclamation Sand Market Volume (Kilo Tons)
- 6.2 Asia Pacific Reclamation Sand Market Revenue (US$ Million)
- 6.3 Asia Pacific Reclamation Sand Market Forecast and Analysis
7. Asia Pacific Reclamation Sand Market Analysis - Process
- 7.1 Wet Reclamation
- 7.1.1 Overview
- 7.1.2 Wet Reclamation: Asia Pacific Reclamation Sand Market Volume, Revenue and Forecast to 2030 (Kilo Tons) (US$ Million)
- 7.2 Mechanical Reclamation
- 7.2.1 Overview
- 7.2.2 Mechanical Reclamation: Asia Pacific Reclamation Sand Market Volume, Revenue and Forecast to 2030 (Kilo Tons) (US$ Million)
- 7.3 Thermal Reclamation
- 7.3.1 Overview
- 7.3.2 Thermal Reclamation: Asia Pacific Reclamation Sand Market Volume, Revenue and Forecast to 2030 (Kilo Tons) (US$ Million)
8. Asia Pacific Reclamation Sand Market Analysis - Application
- 8.1 Foundry
- 8.1.1 Overview
- 8.1.2 Foundry : Asia Pacific Reclamation Sand Market Revenue and Forecast to 2030 (US$ Million)
- 8.2 Construction and Others
- 8.2.1 Overview
- 8.2.2 Construction and Others: Asia Pacific Reclamation Sand Market Revenue and Forecast to 2030 (US$ Million)
9. Asia Pacific Reclamation Sand Market - Country Analysis
- 9.1 Asia Pacific
- 9.1.1 Asia Pacific Reclamation Sand Market Overview
- 9.1.2 Asia Pacific Reclamation Sand Market Revenue and Forecasts and Analysis - By Countries
- 9.1.2.1 Asia Pacific Reclamation Sand Market Breakdown by Country
- 9.1.2.2 Australia Reclamation Sand Market Volume and Forecasts to 2030 (Kilo Tons)
- 9.1.2.3 Australia Reclamation Sand Market Revenue and Forecasts to 2030 (US$ Million)
- 9.1.2.3.1 Australia Reclamation Sand Market Breakdown by Process
- 9.1.2.3.2 Australia Reclamation Sand Market Breakdown by Process
- 9.1.2.3.3 Australia Reclamation Sand Market Breakdown by Application
- 9.1.2.4 China Reclamation Sand Market Volume and Forecasts to 2030 (Kilo Tons)
- 9.1.2.5 China Reclamation Sand Market Revenue and Forecasts to 2030 (US$ Million)
- 9.1.2.5.1 China Reclamation Sand Market Breakdown by Process
- 9.1.2.5.2 China Reclamation Sand Market Breakdown by Process
- 9.1.2.5.3 China Reclamation Sand Market Breakdown by Application
- 9.1.2.6 India Reclamation Sand Market Volume and Forecasts to 2030 (Kilo Tons)
- 9.1.2.7 India Reclamation Sand Market Revenue and Forecasts to 2030 (US$ Million)
- 9.1.2.7.1 India Reclamation Sand Market Breakdown by Process
- 9.1.2.7.2 India Reclamation Sand Market Breakdown by Process
- 9.1.2.7.3 India Reclamation Sand Market Breakdown by Application
- 9.1.2.8 Japan Reclamation Sand Market Volume and Forecasts to 2030 (Kilo Tons)
- 9.1.2.9 Japan Reclamation Sand Market Revenue and Forecasts to 2030 (US$ Million)
- 9.1.2.9.1 Japan Reclamation Sand Market Breakdown by Process
- 9.1.2.9.2 Japan Reclamation Sand Market Breakdown by Process
- 9.1.2.9.3 Japan Reclamation Sand Market Breakdown by Application
- 9.1.2.10 South Korea Reclamation Sand Market Volume and Forecasts to 2030 (Kilo Tons)
- 9.1.2.11 South Korea Reclamation Sand Market Revenue and Forecasts to 2030 (US$ Million)
- 9.1.2.11.1 South Korea Reclamation Sand Market Breakdown by Process
- 9.1.2.11.2 South Korea Reclamation Sand Market Breakdown by Process
- 9.1.2.11.3 South Korea Reclamation Sand Market Breakdown by Application
- 9.1.2.12 Rest of Asia Pacific Reclamation Sand Market Volume and Forecasts to 2030 (Kilo Tons)
- 9.1.2.13 Rest of Asia Pacific Reclamation Sand Market Revenue and Forecasts to 2030 (US$ Million)
- 9.1.2.13.1 Rest of Asia Pacific Reclamation Sand Market Breakdown by Process
- 9.1.2.13.2 Rest of Asia Pacific Reclamation Sand Market Breakdown by Process
- 9.1.2.13.3 Rest of Asia Pacific Reclamation Sand Market Breakdown by Application
10. Industry Landscape
- 10.1 Overview
- 10.2 Market Initiative
11. Company Profiles
- 11.1 Asahi Yukizai Corp
- 11.1.1 Key Facts
- 11.1.2 Business Description
- 11.1.3 Products and Services
- 11.1.4 Financial Overview
- 11.1.5 SWOT Analysis
- 11.1.6 Key Developments
- 11.2 Mangalore Minerals Pvt Ltd
- 11.2.1 Key Facts
- 11.2.2 Business Description
- 11.2.3 Products and Services
- 11.2.4 Financial Overview
- 11.2.5 SWOT Analysis
- 11.2.6 Key Developments
- 11.3 TOCHU Corp
- 11.3.1 Key Facts
- 11.3.2 Business Description
- 11.3.3 Products and Services
- 11.3.4 Financial Overview
- 11.3.5 SWOT Analysis
- 11.3.6 Key Developments
- 11.4 CQMS Razer Pty Ltd
- 11.4.1 Key Facts
- 11.4.2 Business Description
- 11.4.3 Products and Services
- 11.4.4 Financial Overview
- 11.4.5 SWOT Analysis
- 11.4.6 Key Developments
- 11.5 MAT Foundry Group Ltd
- 11.5.1 Key Facts
- 11.5.2 Business Description
- 11.5.3 Products and Services
- 11.5.4 Financial Overview
- 11.5.5 SWOT Analysis
- 11.5.6 Key Developments
- 11.6 Iluka Resources Ltd
- 11.6.1 Key Facts
- 11.6.2 Business Description
- 11.6.3 Products and Services
- 11.6.4 Financial Overview
- 11.6.5 SWOT Analysis
- 11.6.6 Key Developments
- 11.7 Pioneer Construction Materials Pty Ltd
- 11.7.1 Key Facts
- 11.7.2 Business Description
- 11.7.3 Products and Services
- 11.7.4 Financial Overview
- 11.7.5 SWOT Analysis
- 11.7.6 Key Developments
- 11.8 JFE Mineral & Alloy Co Ltd
- 11.8.1 Key Facts
- 11.8.2 Business Description
- 11.8.3 Products and Services
- 11.8.4 Financial Overview
- 11.8.5 SWOT Analysis
- 11.8.6 Key Developments

