|
|
市場調査レポート
商品コード
1494427
アジア太平洋の風速計:2030年市場予測-地域別分析-測定タイプ別、風速計タイプ別、用途別Asia Pacific Wind Anemometer Market Forecast to 2030 - Regional Analysis - By Measuring Type (Velocity Anemometers and Pressure Anemometers), Anemometers Type (Mechanical, Ultrasonic, and Others), and Application (Onshore and Offshore) |
||||||
|
|||||||
|
|||||||

| アジア太平洋の風速計:2030年市場予測-地域別分析-測定タイプ別、風速計タイプ別、用途別 |
|
出版日: 2024年03月14日
発行: The Insight Partners
ページ情報: 英文 74 Pages
納期: 即納可能
|

全表示
- 概要
- 図表
- 目次
アジア太平洋の風速計市場は、2022年に3,968万米ドルと評価され、2030年には7,204万米ドルに達すると予測され、2022年から2030年までのCAGRは7.7%で成長すると予測されています。
気候変動に対する意識の高まりがアジア太平洋の風速計市場を牽引
多くの国が、再生可能エネルギー容量の増加や温室効果ガス排出量の削減など、気候変動に関する目標を定めています。国連環境計画によると、発電の約66%、世界のエネルギーの約80%は化石燃料から生み出されており、気候変動に関わる温室効果ガス(GHG)排出量の約60%を占めています。よりクリーンなエネルギーへの転換は、すでに多くの国で始まっています。風力発電はクリーンで再生可能なエネルギー源です。発電機を回して電気を作るために、風力タービンは機械的な力を使って風からのエネルギーを制御します。風は無尽蔵で豊富な資源であるだけでなく、空気を汚さず、燃料を燃やすことなく電気を供給します。風力はアジア太平洋において再生可能な電力の重要な供給源であり続け、化石燃料への依存を減らすのに役立っています。各国の政府は、二酸化炭素排出量を削減するための取り組みを行っています。また、風向風速計は特定の場所での風力エネルギーの可能性を評価するために不可欠であり、これらに合わせるために、これらの機器の需要が増加しています。したがって、気候変動に対する意識の高まりが風速計市場の成長を後押ししています。
アジア太平洋の風速計市場概要
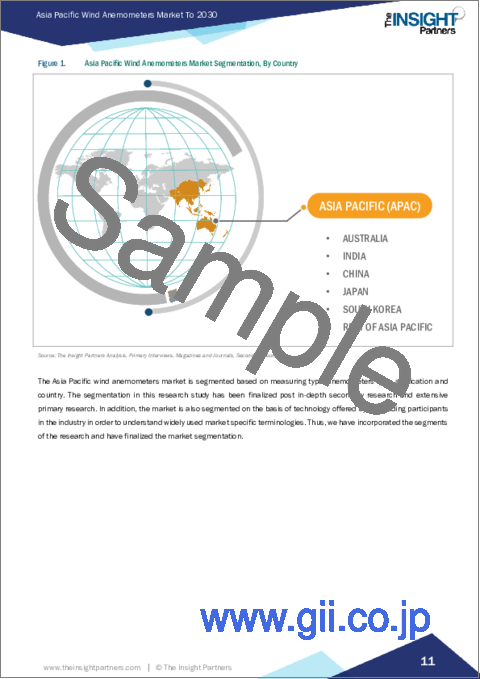
アジア太平洋の風速計市場は、オーストラリア、インド、中国、日本、韓国、その他アジア太平洋に区分されます。インドと中国は自立戦略を重視しており、両国の政府はエネルギー需要を満たすためにいくつかの戦略を取り入れています。プレス・インフォメーション・ビューローによると、インドは長年にわたり風力発電で大きな進歩を遂げ、現在では世界第4位の風力発電容量を誇っています。2030年までに電力の50%を非化石燃料ベースのエネルギー資源から導入し、2070年までにネット・ゼロを達成するというインドの取り組みにとって、風力エネルギーは必要不可欠です。インドには、陸上風力発電と洋上風力発電の両方に大きな可能性があります。政府の努力により、インドは15GW以上の国内風力発電能力を開発し、インドをAatma Nirbharにしました。別の例では、一般的なメカニズムによれば、中国は最大の風力タービンにシフトしています。2023年7月、中国三峡集団は福建省近郊の洋上風力発電所に16メガワットのMySE 16-260タービンを設置したと発表しました。設置されたタービンは高さ152メートル(500フィート)、1枚のブレードは123メートル(403フィート)、重さ54トンという巨大なものです。
アジア太平洋の風速計市場の収益と2030年までの予測(金額)
アジア太平洋の風速計市場のセグメンテーション
アジア太平洋の風速計市場は、測定タイプ、風速計タイプ、用途、国によって区分されます。
測定タイプに基づき、アジア太平洋の風速計市場は速度風速計と圧力風速計に二分されます。2022年には速度風速計セグメントがより大きなシェアを占めています。
風速計の種類によって、アジア太平洋の風速計市場は機械式、超音波式、その他に区分されます。機械式セグメントが2022年に最大のシェアを占めました。
用途別では、アジア太平洋の風速計市場は陸上と洋上に二分されます。2022年には陸上セグメントが大きなシェアを占めています。
国別では、アジア太平洋の風速計市場は、オーストラリア、中国、インド、日本、韓国、その他アジア太平洋に分類されます。2022年のアジア太平洋の風速計市場は中国が支配的。
Vaisala Oyj、R M Young Co、Theta Instruments Co Ltd、Campbell Scientific Inc、OTT HydroMet Fellbach GmbHは、アジア太平洋の風速計市場で事業を展開している大手企業です。
目次
第1章 イントロダクション
第2章 エグゼクティブサマリー
- 主要洞察
- 市場の魅力
第3章 調査手法
- 調査範囲
- 2次調査
- 1次調査
第4章 アジア太平洋の風速計市場情勢
- エコシステム分析
- バリューチェーンのベンダー一覧
第5章 アジア太平洋の風速計市場-主要産業力学
- アジア太平洋の風速計市場:主要産業力学
- 市場促進要因
- 再生可能エネルギー源に対する需要の高まり
- 気候変動に対する意識の高まり
- 市場抑制要因
- 高い初期投資とメンテナンスコスト
- 熟練した専門家の不足
- 市場機会
- 高度で革新的な風速計の開発
- 航空・気象モニタリング用途での風速計使用の増加
- 今後の動向
- 洋上風力発電所の開発
- 促進要因と抑制要因の影響
第6章 風速計市場:アジア太平洋市場分析
- アジア太平洋の風速計市場収益、2022年~2030年
- アジア太平洋の風速計市場の予測と分析
第7章 アジア太平洋の風速計市場の分析:測定タイプ
- 速度風速計
- 圧力風速計
第8章 アジア太平洋の風速計市場分析:風速計タイプ
- 機械式
- 超音波式
- その他
第9章 アジア太平洋の風速計市場分析-用途
- 陸上
- オフショア
第10章 アジア太平洋の風速計市場:国別分析
- アジア太平洋地域
- 中国
- 日本
- インド
- 日本
- 韓国
- オーストラリア
- その他アジア太平洋地域
第11章 業界情勢
- 市場イニシアティブ
- 新製品開発
- 合併と買収
第12章 企業プロファイル
- Vaisala Oyj
- R M Young Co
- Theta Instruments Co Ltd
- Campbell Scientific Inc
- OTT HydroMet Fellbach GmbH
第13章 付録
List Of Tables
- Table 1. Asia Pacific Wind Anemometers Market Segmentation
- Table 2. Asia Pacific Wind Anemometers Market Revenue and Forecasts To 2030 (US$ Million)
- Table 3. Asia Pacific Wind Anemometers Market Revenue and Forecasts To 2030 (US$ Million) - Measuring Type
- Table 4. Asia Pacific Wind Anemometers Market Revenue and Forecasts To 2030 (US$ Million) -Anemometers Type
- Table 5. Asia Pacific Wind Anemometers Market Revenue and Forecasts To 2030 (US$ Million) - Application
- Table 6. Asia Pacific Wind Anemometers Market Revenue and Forecasts To 2030 (US$ Mn) - By Country
- Table 7. China Wind Anemometers Market Revenue and Forecasts To 2030 (US$ Mn) - By Type
- Table 8. China Wind Anemometers Market Revenue and Forecasts To 2030 (US$ Mn) - By Anemometers Type
- Table 9. China Wind Anemometers Market Revenue and Forecasts To 2030 (US$ Mn) - By Application
- Table 10. Japan Wind Anemometers Market Revenue and Forecasts To 2030 (US$ Mn) - By Type
- Table 11. Japan Wind Anemometers Market Revenue and Forecasts To 2030 (US$ Mn) - By Anemometers Type
- Table 12. Japan Wind Anemometers Market Revenue and Forecasts To 2030 (US$ Mn) - By Application
- Table 13. India Wind Anemometers Market Revenue and Forecasts To 2030 (US$ Mn) - By Type
- Table 14. India Wind Anemometers Market Revenue and Forecasts To 2030 (US$ Mn) - By Anemometers Type
- Table 15. India Wind Anemometers Market Revenue and Forecasts To 2030 (US$ Mn) - By Application
- Table 16. South Korea Wind Anemometers Market Revenue and Forecasts To 2030 (US$ Mn) - By Type
- Table 17. South Korea Wind Anemometers Market Revenue and Forecasts To 2030 (US$ Mn) - By Anemometers Type
- Table 18. South Korea Wind Anemometers Market Revenue and Forecasts To 2030 (US$ Mn) - By Application
- Table 19. Australia Wind Anemometers Market Revenue and Forecasts To 2030 (US$ Mn) - By Type
- Table 20. Australia Wind Anemometers Market Revenue and Forecasts To 2030 (US$ Mn) - By Anemometers Type
- Table 21. Australia Wind Anemometers Market Revenue and Forecasts To 2030 (US$ Mn) - By Application
- Table 22. Rest of Asia Pacific Wind Anemometers Market Revenue and Forecasts To 2030 (US$ Mn) - By Type
- Table 23. Rest of Asia Pacific Wind Anemometers Market Revenue and Forecasts To 2030 (US$ Mn) - By Anemometers Type
- Table 24. Rest of Asia Pacific Wind Anemometers Market Revenue and Forecasts To 2030 (US$ Mn) - By Application
- Table 25. List of Abbreviation
List Of Figures
- Figure 1. Asia Pacific Wind Anemometers Market Segmentation, By Country
- Figure 2. Ecosystem: Asia Pacific Wind Anemometers Market
- Figure 3. Impact Analysis of Drivers and Restraints
- Figure 4. Asia Pacific Wind Anemometers Market Revenue (US$ Million), 2022 - 2030
- Figure 5. Asia Pacific Wind Anemometers Market Share (%) - Measuring Type, 2022 and 2030
- Figure 6. Velocity Anemometers Market Revenue and Forecasts To 2030 (US$ Million)
- Figure 7. Pressure Anemometers Market Revenue and Forecasts To 2030 (US$ Million)
- Figure 8. Asia Pacific Wind Anemometers Market Share (%) - Measuring Type, 2022 and 2030
- Figure 9. Mechanical Market Revenue and Forecasts To 2030 (US$ Million)
- Figure 10. Ultrasonic Market Revenue and Forecasts To 2030 (US$ Million)
- Figure 11. Others Market Revenue and Forecasts To 2030 (US$ Million)
- Figure 12. Asia Pacific Wind Anemometers Market Share (%) - Application, 2022 and 2030
- Figure 13. Onshore Market Revenue and Forecasts To 2030 (US$ Million)
- Figure 14. Offshore Market Revenue and Forecasts To 2030 (US$ Million)
- Figure 15. Asia Pacific Wind Anemometers Market, by Key Countries - Revenue (2022) (US$ Million)
- Figure 16. Wind Anemometers Market Breakdown by Key Countries, 2022 and 2030 (%)
- Figure 17. China Wind Anemometers Market Revenue and Forecasts To 2030 (US$ Mn)
- Figure 18. Japan Wind Anemometers Market Revenue and Forecasts To 2030 (US$ Mn)
- Figure 19. India Wind Anemometers Market Revenue and Forecasts To 2030 (US$ Mn)
- Figure 20. South Korea Wind Anemometers Market Revenue and Forecasts To 2030 (US$ Mn)
- Figure 21. Australia Wind Anemometers Market Revenue and Forecasts To 2030 (US$ Mn)
- Figure 22. Rest of Asia Pacific Wind Anemometers Market Revenue and Forecasts To 2030 (US$ Mn)
The Asia Pacific wind anemometer market was valued at US$ 39.68 million in 2022 and is expected to reach US$ 72.04 million by 2030; it is estimated to grow at a CAGR of 7.7% from 2022 to 2030.
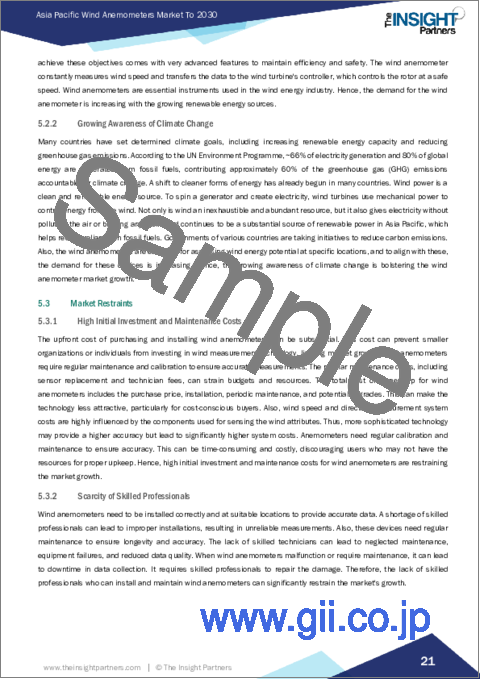
Growing Awareness of Climate Change Drive Asia Pacific Wind Anemometer Market
Many countries have set determined climate goals, including increasing renewable energy capacity and reducing greenhouse gas emissions. According to the UN Environment Programme, ~66% of electricity generation and 80% of global energy are generated from fossil fuels, contributing approximately 60% of the greenhouse gas (GHG) emissions accountable for climate change. A shift to cleaner forms of energy has already begun in many countries. Wind power is a clean and renewable energy source. To spin a generator and create electricity, wind turbines use mechanical power to control energy from the wind. Not only is wind an inexhaustible and abundant resource, but it also gives electricity without polluting the air or burning any fuel. Wind continues to be a substantial source of renewable power in Asia Pacific, which helps reduce reliance on fossil fuels. Governments of various countries are taking initiatives to reduce carbon emissions. Also, the wind anemometers are essential for assessing wind energy potential at specific locations, and to align with these, the demand for these devices is increasing. Hence, the growing awareness of climate change is bolstering the wind anemometer market growth.
Asia Pacific Wind Anemometer Market Overview
The wind anemometer market in Asia Pacific is segmented into Australia, India, China, Japan, South Korea, and the Rest of Asia Pacific. India and China emphasize self-reliant strategies, and both governments are incorporating several strategies to fulfill their energy needs. According to the Press Information Bureau, India has made great strides in generating wind energy over the years, and it now ranks fourth in wind power capacity globally. Wind energy is necessary for India's efforts to have 50% of its electric power installed from nonfossil fuel-based energy resources by 2030 and achieve net zero by 2070. India has considerable potential for both onshore and offshore wind energy production. With government efforts, India developed a domestic wind manufacturing capacity of over 15 GW, making India Aatma Nirbhar. In another instance, according to the popular mechanism, China has shifted to the largest wind turbines. In July 2023, China Three Gorges Corporation announced the installation of the 16-megawatt MySE 16-260 turbine at the offshore wind farm near Fujian Province. The installed turbine behemoth is 152 meters (500 feet) tall, and each single blade is 123 meters (403 feet) and weighs 54 metric ton.
Asia Pacific Wind Anemometer Market Revenue and Forecast to 2030 (US$ Million)
Asia Pacific Wind Anemometer Market Segmentation
The Asia Pacific wind anemometer market is segmented based on measuring type, anemometers type, applications, and country.
Based on measuring type, the Asia Pacific wind anemometer market is bifurcated into velocity anemometers and pressure anemometers. The velocity anemometers segment held a larger share in 2022.
Based on anemometers type, the Asia Pacific wind anemometer market is segmented into mechanical, ultrasonic, and others. The mechanical segment held the largest share in 2022.
In terms of applications, the Asia Pacific wind anemometer market is bifurcated into onshore and offshore. The onshore segment held a larger share in 2022.
Based on country, the Asia Pacific wind anemometer market is categorized into Australia, China, India, Japan, South Korea, and the Rest of Asia Pacific. China dominated the Asia Pacific wind anemometer market in 2022.
Vaisala Oyj, R M Young Co, Theta Instruments Co Ltd, Campbell Scientific Inc, and OTT HydroMet Fellbach GmbH are some of the leading companies operating in the Asia Pacific wind anemometer market.
Table Of Contents
1. Introduction
- 1.1 The Insight Partners Research Report Guidance
- 1.2 Market Segmentation
2. Executive Summary
- 2.1 Key Insights
- 2.2 Market Attractiveness
3. Research Methodology
- 3.1 Coverage
- 3.2 Secondary Research
- 3.3 Primary Research
4. Asia Pacific Wind Anemometers Market Landscape
- 4.1 Overview
- 4.2 Ecosystem Analysis
- 4.2.1 List of Vendors in Value Chain
5. Asia Pacific Wind Anemometers Market - Key Industry Dynamics
- 5.1 Asia Pacific Wind Anemometers Market - Key Industry Dynamics
- 5.2 Market Drivers
- 5.2.1 Growing Demand for Renewable Energy Sources
- 5.2.2 Growing Awareness of Climate Change
- 5.3 Market Restraints
- 5.3.1 High Initial Investment and Maintenance Costs
- 5.3.2 Scarcity of Skilled Professionals
- 5.4 Market Opportunities
- 5.4.1 Development Of Advanced and Innovative Wind Anemometers
- 5.4.2 Increasing in Use of Wind Anemometers in Aviation and Weather Monitoring Applications
- 5.5 Future Trends
- 5.5.1 Development of Offshore Wind Farms
- 5.6 Impact of Drivers and Restraints:
6. Wind Anemometers Market - Asia Pacific Market Analysis
- 6.1 Asia Pacific Wind Anemometers Market Revenue (US$ Million), 2022 - 2030
- 6.2 Asia Pacific Wind Anemometers Market Forecast and Analysis
7. Asia Pacific Wind Anemometers Market Analysis - Measuring Type
- 7.1 Velocity Anemometers
- 7.1.1 Overview
- 7.1.2 Velocity Anemometers Market, Revenue and Forecast to 2030 (US$ Million)
- 7.2 Pressure Anemometers
- 7.2.1 Overview
- 7.2.2 Pressure Anemometers Market, Revenue and Forecast to 2030 (US$ Million)
8. Asia Pacific Wind Anemometers Market Analysis - Anemometers Type
- 8.1 Mechanical
- 8.1.1 Overview
- 8.1.2 Mechanical Market, Revenue and Forecast to 2030 (US$ Million)
- 8.2 Ultrasonic
- 8.2.1 Overview
- 8.2.2 Ultrasonic Market, Revenue and Forecast to 2030 (US$ Million)
- 8.3 Others
- 8.3.1 Overview
- 8.3.2 Others Market, Revenue and Forecast to 2030 (US$ Million)
9. Asia Pacific Wind Anemometers Market Analysis - Application
- 9.1 Onshore
- 9.1.1 Overview
- 9.1.2 Onshore Market Revenue, and Forecast to 2030 (US$ Million)
- 9.2 Offshore
- 9.2.1 Overview
- 9.2.2 Offshore Market Revenue, and Forecast to 2030 (US$ Million)
10. Asia Pacific Wind Anemometers Market - Country Analysis
- 10.1.1 Asia Pacific Wind Anemometers Market Revenue and Forecasts and Analysis - By Country
- 10.1.1.1 Asia Pacific Wind Anemometers Market Revenue and Forecasts and Analysis - By Country
- 10.1.1.2 China Wind Anemometers Market Revenue and Forecasts to 2030 (US$ Mn)
- 10.1.1.2.1 China Wind Anemometers Market Breakdown by Type
- 10.1.1.2.2 China Wind Anemometers Market Breakdown by Anemometers Type
- 10.1.1.2.3 China Wind Anemometers Market Breakdown by Application
- 10.1.1.3 Japan Wind Anemometers Market Revenue and Forecasts to 2030 (US$ Mn)
- 10.1.1.3.1 Japan Wind Anemometers Market Breakdown by Type
- 10.1.1.3.2 Japan Wind Anemometers Market Breakdown by Anemometers Type
- 10.1.1.3.3 Japan Wind Anemometers Market Breakdown by Application
- 10.1.1.4 India Wind Anemometers Market Revenue and Forecasts to 2030 (US$ Mn)
- 10.1.1.4.1 India Wind Anemometers Market Breakdown by Type
- 10.1.1.4.2 India Wind Anemometers Market Breakdown by Anemometers Type
- 10.1.1.4.3 India Wind Anemometers Market Breakdown by Application
- 10.1.1.5 South Korea Wind Anemometers Market Revenue and Forecasts to 2030 (US$ Mn)
- 10.1.1.5.1 South Korea Wind Anemometers Market Breakdown by Type
- 10.1.1.5.2 South Korea Wind Anemometers Market Breakdown by Anemometers Type
- 10.1.1.5.3 South Korea Wind Anemometers Market Breakdown by Application
- 10.1.1.6 Australia Wind Anemometers Market Revenue and Forecasts to 2030 (US$ Mn)
- 10.1.1.6.1 Australia Wind Anemometers Market Breakdown by Type
- 10.1.1.6.2 Australia Wind Anemometers Market Breakdown by Anemometers Type
- 10.1.1.6.3 Australia Wind Anemometers Market Breakdown by Application
- 10.1.1.7 Rest of Asia Pacific Wind Anemometers Market Revenue and Forecasts to 2030 (US$ Mn)
- 10.1.1.7.1 Rest of Asia Pacific Wind Anemometers Market Breakdown by Type
- 10.1.1.7.2 Rest of Asia Pacific Wind Anemometers Market Breakdown by Anemometers Type
- 10.1.1.7.3 Rest of Asia Pacific Wind Anemometers Market Breakdown by Application
11. Industry Landscape
- 11.1 Overview
- 11.2 Market Initiative
- 11.3 New Product Development
- 11.4 Merger and Acquisition
12. Company Profiles
- 12.1 Vaisala Oyj
- 12.1.1 Key Facts
- 12.1.2 Business Description
- 12.1.3 Products and Services
- 12.1.4 Financial Overview
- 12.1.5 SWOT Analysis
- 12.1.6 Key Developments
- 12.2 R M Young Co
- 12.2.1 Key Facts
- 12.2.2 Business Description
- 12.2.3 Products and Services
- 12.2.4 Financial Overview
- 12.2.5 SWOT Analysis
- 12.2.6 Key Developments
- 12.3 Theta Instruments Co Ltd
- 12.3.1 Key Facts
- 12.3.2 Business Description
- 12.3.3 Products and Services
- 12.3.4 Financial Overview
- 12.3.5 SWOT Analysis
- 12.3.6 Key Developments
- 12.4 Campbell Scientific Inc
- 12.4.1 Key Facts
- 12.4.2 Business Description
- 12.4.3 Products and Services
- 12.4.4 Financial Overview
- 12.4.5 SWOT Analysis
- 12.4.6 Key Developments
- 12.5 OTT HydroMet Fellbach GmbH
- 12.5.1 Key Facts
- 12.5.2 Business Description
- 12.5.3 Products and Services
- 12.5.4 Financial Overview
- 12.5.5 SWOT Analysis
- 12.5.6 Key Developments
13. Appendix
- 13.1 About The Insight Partners
- 13.2 Word Index

