|
|
市場調査レポート
商品コード
1494426
北米の風速計:2030年市場予測-地域別分析-測定タイプ別、風速計タイプ別、用途別North America Wind Anemometer Market Forecast to 2030 - Regional Analysis - By Measuring Type (Velocity Anemometers and Pressure Anemometers), Anemometers Type (Mechanical, Ultrasonic, and Others), and Application (Onshore and Offshore) |
||||||
|
|||||||
|
|||||||

| 北米の風速計:2030年市場予測-地域別分析-測定タイプ別、風速計タイプ別、用途別 |
|
出版日: 2024年03月14日
発行: The Insight Partners
ページ情報: 英文 63 Pages
納期: 即納可能
|

全表示
- 概要
- 図表
- 目次
北米の風速計市場は、2022年に5,965万米ドルと評価され、2030年には1億206万米ドルに達すると予測され、2022~2030年のCAGRは6.9%で成長すると予測されています。
洋上風力発電所の開拓が北米風速計市場を牽引
洋上風力発電は、クリーンで再生可能なエネルギーに対する世界のニーズに対して急成長しているソリューションの1つです。風力発電所技術は急速に進歩しており、従来の風力発電所よりも深海に設置され、海岸から離れた洋上風力発電所への注目が高まっています。さらに、洋上ウインドファームは化石燃料発電所よりも環境フットプリントが大幅に小さく、温室効果ガスの排出もないです。また、魚やその他の水生生物を引き寄せる人工岩礁として機能するプラットフォームにより、海洋生物のための環境も記載しています。洋上ウィンドファームを建設する前に、開発者は候補地の風況を評価しなければならないです。風向風速計は、海上での風速、風向、その他の環境要因を正確に測定するために不可欠であり、洋上風力タービンに適した最適な場所を特定するのに役立ちます。このため、特殊な洋上風速計システムの需要が高まっています。また、詳細な風力資源評価は、洋上風力発電所のエネルギー生産の可能性を決定するために不可欠です。風向風速計は、エネルギー出力を推定するために必要なデータを提供し、開発者が十分な情報に基づいた投資決定を下し、これらの大規模プロジェクトのための資金を確保するのに役立ちます。
北米の風速計市場概要
北米の風速計市場は、米国、カナダ、メキシコに区分されます。風速センサーは、天候の変化を感知し、より安全な離着陸を行うために、自律走行航空機に広く使用されています。自律走行航空機の採用が増えるにつれて、風速計の需要が増加しています。風速計の用途を知ることで、世界中の様々なエンジニアが自律型航空機に応用するための風速計を開発しています。例えば、2022年8月のエンジニアによると、エンジニアは自律型航空機やドローンのために、従来のタイプに比べて低エネルギー、低ドラッグ、軽量で、圧力の変化に敏感な風センサーを開発しました。風向風速計は、風力タービンプロジェクトで風向と風速をモニターするために広く使用されています。北米全域で、風力タービンはクリーンエネルギーの生産に重要な役割を果たしています。米国風力タービンデータベース(USWTDB)などいくつかの団体が、米国内の陸上と洋上の風力タービンの位置を提供しています。米国地質調査所(United States Geological Survey)によると、7万2731基のタービンが43の州(グアムとプエルトリコも含む)をカバーしています。2022年第4四半期の時点で、最新のタービンがUSWTDBに追加されました。さらに、R. M. YoungやCampbell Scientific, Inc.など、北米全域の様々な市場参入企業が風速計を提供しています。北米におけるこのような参入企業の存在は、風速計市場の成長に貢献しています。
北米の風速計市場の収益と2030年までの予測(金額)
北米の風速計市場のセグメンテーション
北米の風速計市場は、測定タイプ、風速計タイプ、用途、国に基づいてセグメント化されます。
測定タイプに基づき、北米の風速計市場は速度風速計と圧力風速計に二分されます。2022年には速度風速計セグメントが大きなシェアを占めています。
風速計タイプによって、北米の風速計市場は機械式、超音波式、その他に区分されます。機械式セグメントが2022年に最大のシェアを占めました。
用途別では、北米の風速計市場は陸上と洋上に二分されます。2022年には陸上セグメントが大きなシェアを占めています。
国別では、北米の風速計市場は米国、カナダ、メキシコに分類されます。2022年の北米風速計市場は米国が独占。
Vaisala Oyj、R M Young Co、Campbell Scientific In、OTT HydroMet Fellbach GmbHは、北米風速計市場で事業を展開している大手企業です。
目次
第1章 イントロダクション
第2章 エグゼクティブ概要
- 主要洞察
- 市場の魅力
第3章 調査手法
- 調査範囲
- 2次調査
- 1次調査
第4章 北米の風速計市場情勢
- イントロダクション
- エコシステム分析
- バリューチェーンのベンダー一覧
第5章 北米の風速計市場-主要産業力学
- 北米の風速計市場:主要産業力学
- 市場促進要因
- 再生可能エネルギー源に対する需要の高まり
- 気候変動に対する意識の高まり
- 市場抑制要因
- 高い初期投資とメンテナンスコスト
- 熟練した専門家の不足
- 市場機会
- 高度で革新的な風速計の開発
- 航空・気象モニタリング用途での風速計使用の増加
- 今後の動向
- 洋上風力発電所の開発
- 促進要因と抑制要因の影響
第6章 風速計市場:北米市場分析
- 北米の風速計市場収益、2022~2030年
- 北米の風速計市場の予測と分析
第7章 北米風速計市場分析-測定タイプ
- 速度風速計
- 速度風速計概要
- 速度風速計市場の収益と2030年までの予測
- 圧力風速計
- 圧力風速計概要
- 圧力風速計市場の収益と2030年までの予測
第8章 北米の風速計市場分析:風速計タイプ
- 機械式
- 機械式市場の収益と2030年までの予測
- 超音波式
- 超音波式市場の収益と2030年までの予測
- その他
- その他概要
- その他市場の収益と2030年までの予測
第9章 北米の風速計市場分析-用途
- 陸上
- 陸上市場の収益と2030年までの予測
- 洋上
- 洋上概要
- 洋上市場の収益と2030年までの予測
第10章 北米の風速計市場:国別分析
- 北米の風速計市場の収益と予測:国別分析
- 北米の風速計市場の収益と予測・分析:国別
- 米国の風速計市場の収益と2030年までの予測
- カナダの風速計市場の収益と2030年までの予測
- メキシコの風速計市場の収益と2030年までの予測
第11章 業界情勢
- イントロダクション
- 市場イニシアティブ
- 新製品開発
- 合併と買収
第12章 企業プロファイル
- Vaisala Oyj
- R M Young Co
- Campbell Scientific Inc
- OTT HydroMet Fellbach GmbH
第13章 付録
List Of Tables
- Table 1. North America Wind Anemometers Market Segmentation
- Table 2. North America Wind Anemometers Market Revenue and Forecasts To 2030 (US$ Million)
- Table 3. North America Wind Anemometers Market Revenue and Forecasts To 2030 (US$ Million) - Measuring Type
- Table 4. North America Wind Anemometers Market Revenue and Forecasts To 2030 (US$ Million) -Anemometers Type
- Table 5. North America Wind Anemometers Market Revenue and Forecasts To 2030 (US$ Million) - Application
- Table 6. North America Wind Anemometers Market Revenue and Forecasts To 2030 (US$ Mn) - By Country
- Table 7. US Wind Anemometers Market Revenue and Forecasts To 2030 (US$ Mn) - By Type
- Table 8. US Wind Anemometers Market Revenue and Forecasts To 2030 (US$ Mn) - By Anemometers Type
- Table 9. US Wind Anemometers Market Revenue and Forecasts To 2030 (US$ Mn) - By Application
- Table 10. Canada Wind Anemometers Market Revenue and Forecasts To 2030 (US$ Mn) - By Type
- Table 11. Canada Wind Anemometers Market Revenue and Forecasts To 2030 (US$ Mn) - By Anemometers Type
- Table 12. Canada Wind Anemometers Market Revenue and Forecasts To 2030 (US$ Mn) - By Application
- Table 13. Mexico Wind Anemometers Market Revenue and Forecasts To 2030 (US$ Mn) - By Type
- Table 14. Mexico Wind Anemometers Market Revenue and Forecasts To 2030 (US$ Mn) - By Anemometers Type
- Table 15. Mexico Wind Anemometers Market Revenue and Forecasts To 2030 (US$ Mn) - By Application
- Table 16. List of Abbreviation
List Of Figures
- Figure 1. North America Wind Anemometers Market Segmentation, By Country
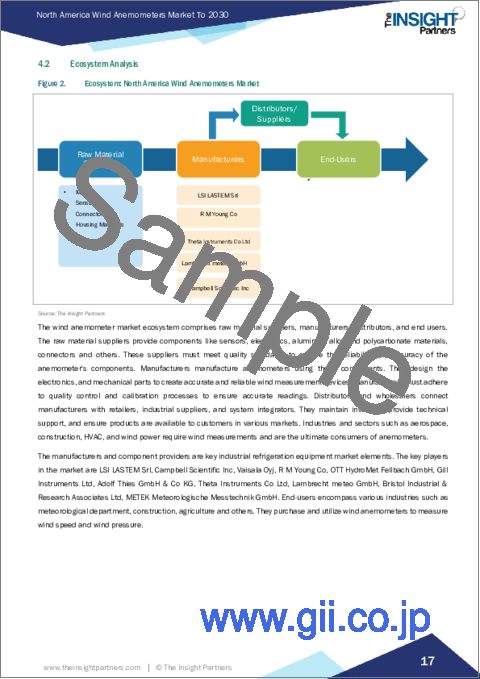
- Figure 2. Ecosystem: North America Wind Anemometers Market
- Figure 3. Impact Analysis of Drivers and Restraints
- Figure 4. North America Wind Anemometers Market Revenue (US$ Million), 2022 - 2030
- Figure 5. North America Wind Anemometers Market Share (%) - Measuring Type, 2022 and 2030
- Figure 6. Velocity Anemometers Market Revenue and Forecasts To 2030 (US$ Million)
- Figure 7. Pressure Anemometers Market Revenue and Forecasts To 2030 (US$ Million)
- Figure 8. North America Wind Anemometers Market Share (%) - Measuring Type, 2022 and 2030
- Figure 9. Mechanical Market Revenue and Forecasts To 2030 (US$ Million)
- Figure 10. Ultrasonic Market Revenue and Forecasts To 2030 (US$ Million)
- Figure 11. Others Market Revenue and Forecasts To 2030 (US$ Million)
- Figure 12. North America Wind Anemometers Market Share (%) - Application, 2022 and 2030
- Figure 13. Onshore Market Revenue and Forecasts To 2030 (US$ Million)
- Figure 14. Offshore Market Revenue and Forecasts To 2030 (US$ Million)
- Figure 15. North America Wind Anemometers Market, by Key Country - Revenue (2022) (US$ Million)
- Figure 16. Wind Anemometers Market Breakdown by Key Countries, 2022 and 2030 (%)
- Figure 17. US Wind Anemometers Market Revenue and Forecasts To 2030 (US$ Mn)
- Figure 18. Canada Wind Anemometers Market Revenue and Forecasts To 2030 (US$ Mn)
- Figure 19. Mexico Wind Anemometers Market Revenue and Forecasts To 2030 (US$ Mn)
The North America wind anemometer market was valued at US$ 59.65 million in 2022 and is expected to reach US$ 102.06 million by 2030; it is estimated to grow at a CAGR of 6.9% from 2022 to 2030.
Development of Offshore Wind Farms Drive North America Wind Anemometer Market
Offshore wind power is one of the fast-growing solutions to the world's need for clean and renewable energy. Wind farm technology is advancing rapidly, with increasing attention paid to offshore wind farms placed in deep waters and away from the shore than traditional wind farms. In addition, offshore wind farms have a significantly smaller environmental footprint than fossil fuel plants and deliver no greenhouse gas emissions. They also offer an environment for marine life, with the platforms operating as artificial reefs that attract fish and other aquatic species. Before constructing offshore wind farms, developers must assess the potential locations' wind conditions. Wind anemometers are essential for accurately measuring wind speed, direction, and other environmental factors at sea, helping identify suitable and optimal locations for offshore wind turbines. This drives the demand for specialized offshore anemometer systems. Also, detailed wind resource assessments are essential to determine the energy production potential of an offshore wind farm. Wind anemometers provide the data needed to estimate the energy output, helping developers make informed investment decisions and secure financing for these large-scale projects.
North America Wind Anemometer Market Overview
The wind anemometer market in North America is segmented into the US, Canada, and Mexico. Wind sensors are widely used in autonomous aircraft vehicles to sense weather changes and perform safer take-offs and landings. With the increase in the adoption of autonomous aircraft vehicles, the demand for wind anemometer is increasing. By knowing the application of wind anemometers, various engineers across the globe are developing wind anemometers for application in autonomous aircraft. For instance, according to the Engineers in August 2022, the engineers developed a wind sensor for autonomous aircraft and drones that is low-energy, low-drag, lightweight, and more sensitive to changes in pressure compared to conventional types. The wind anemometer is widely used in wind turbine projects to monitor wind direction and speed. Across North America, wind turbines play a significant role in producing clean energy. Several entities, such as the United States Wind Turbine Database (USWTDB), provide the locations of land-based and offshore wind turbines in the US. According to the United States Geological Survey, 72,731 turbines cover 43 states (plus Guam and PR). As of the fourth quarter of 2022, the most recent turbines were added to the USWTDB. Further, various market players across North America provide wind anemometer, including R. M. Young and Campbell Scientific, Inc. The presence of such players in North America contributes to the wind anemometer market growth.
North America Wind Anemometer Market Revenue and Forecast to 2030 (US$ Million)
North America Wind Anemometer Market Segmentation
The North America wind anemometer market is segmented based on measuring type, anemometers type, applications, and country.
Based on measuring type, the North America wind anemometer market is bifurcated into velocity anemometers and pressure anemometers. The velocity anemometers segment held a larger share in 2022.
Based on anemometers type, the North America wind anemometer market is segmented into mechanical, ultrasonic, and others. The mechanical segment held the largest share in 2022.
In terms of applications, the North America wind anemometer market is bifurcated into onshore and offshore. The onshore segment held a larger share in 2022.
Based on country, the North America wind anemometer market is categorized into the US, Canada, and Mexico. The US held dominated the North America wind anemometer market in 2022.
Vaisala Oyj, R M Young Co, Campbell Scientific In, and OTT HydroMet Fellbach GmbH are some of the leading companies operating in the North America wind anemometer market.
Table Of Contents
1. Introduction
- 1.1 The Insight Partners Research Report Guidance
- 1.2 Market Segmentation
2. Executive Summary
- 2.1 Key Insights
- 2.2 Market Attractiveness
3. Research Methodology
- 3.1 Coverage
- 3.2 Secondary Research
- 3.3 Primary Research
4. North America Wind Anemometers Market Landscape
- 4.1 Overview
- 4.2 Ecosystem Analysis
- 4.2.1 List of Vendors in Value Chain
5. North America Wind Anemometers Market - Key Industry Dynamics
- 5.1 North America Wind Anemometers Market - Key Industry Dynamics
- 5.2 Market Drivers
- 5.2.1 Growing Demand for Renewable Energy Sources
- 5.2.2 Growing Awareness of Climate Change
- 5.3 Market Restraints
- 5.3.1 High Initial Investment and Maintenance Costs
- 5.3.2 Scarcity of Skilled Professionals
- 5.4 Market Opportunities
- 5.4.1 Development Of Advanced and Innovative Wind Anemometers
- 5.4.2 Increasing in Use of Wind Anemometers in Aviation and Weather Monitoring Applications
- 5.5 Future Trends
- 5.5.1 Development of Offshore Wind Farms
- 5.6 Impact of Drivers and Restraints:
6. Wind Anemometers Market - North America Market Analysis
- 6.1 North America Wind Anemometers Market Revenue (US$ Million), 2022 - 2030
- 6.2 North America Wind Anemometers Market Forecast and Analysis
7. North America Wind Anemometers Market Analysis - Measuring Type
- 7.1 Velocity Anemometers
- 7.1.1 Overview
- 7.1.2 Velocity Anemometers Market, Revenue and Forecast to 2030 (US$ Million)
- 7.2 Pressure Anemometers
- 7.2.1 Overview
- 7.2.2 Pressure Anemometers Market, Revenue and Forecast to 2030 (US$ Million)
8. North America Wind Anemometers Market Analysis - Anemometers Type
- 8.1 Mechanical
- 8.1.1 Overview
- 8.1.2 Mechanical Market, Revenue and Forecast to 2030 (US$ Million)
- 8.2 Ultrasonic
- 8.2.1 Overview
- 8.2.2 Ultrasonic Market, Revenue and Forecast to 2030 (US$ Million)
- 8.3 Others
- 8.3.1 Overview
- 8.3.2 Others Market, Revenue and Forecast to 2030 (US$ Million)
9. North America Wind Anemometers Market Analysis - Application
- 9.1 Onshore
- 9.1.1 Overview
- 9.1.2 Onshore Market Revenue, and Forecast to 2030 (US$ Million)
- 9.2 Offshore
- 9.2.1 Overview
- 9.2.2 Offshore Market Revenue, and Forecast to 2030 (US$ Million)
10. North America Wind Anemometers Market - Country Analysis
- 10.1.1 North America Wind Anemometers Market Revenue and Forecasts and Analysis - By Country
- 10.1.1.1 North America Wind Anemometers Market Revenue and Forecasts and Analysis - By Country
- 10.1.1.2 US Wind Anemometers Market Revenue and Forecasts to 2030 (US$ Mn)
- 10.1.1.2.1 US Wind Anemometers Market Breakdown by Type
- 10.1.1.2.2 US Wind Anemometers Market Breakdown by Anemometers Type
- 10.1.1.2.3 US Wind Anemometers Market Breakdown by Application
- 10.1.1.3 Canada Wind Anemometers Market Revenue and Forecasts to 2030 (US$ Mn)
- 10.1.1.3.1 Canada Wind Anemometers Market Breakdown by Type
- 10.1.1.3.2 Canada Wind Anemometers Market Breakdown by Anemometers Type
- 10.1.1.3.3 Canada Wind Anemometers Market Breakdown by Application
- 10.1.1.4 Mexico Wind Anemometers Market Revenue and Forecasts to 2030 (US$ Mn)
- 10.1.1.4.1 Mexico Wind Anemometers Market Breakdown by Type
- 10.1.1.4.2 Mexico Wind Anemometers Market Breakdown by Anemometers Type
- 10.1.1.4.3 Mexico Wind Anemometers Market Breakdown by Application
11. Industry Landscape
- 11.1 Overview
- 11.2 Market Initiative
- 11.3 New Product Development
- 11.4 Merger and Acquisition
12. Company Profiles
- 12.1 Vaisala Oyj
- 12.1.1 Key Facts
- 12.1.2 Business Description
- 12.1.3 Products and Services
- 12.1.4 Financial Overview
- 12.1.5 SWOT Analysis
- 12.1.6 Key Developments
- 12.2 R M Young Co
- 12.2.1 Key Facts
- 12.2.2 Business Description
- 12.2.3 Products and Services
- 12.2.4 Financial Overview
- 12.2.5 SWOT Analysis
- 12.2.6 Key Developments
- 12.3 Campbell Scientific Inc
- 12.3.1 Key Facts
- 12.3.2 Business Description
- 12.3.3 Products and Services
- 12.3.4 Financial Overview
- 12.3.5 SWOT Analysis
- 12.3.6 Key Developments
- 12.4 OTT HydroMet Fellbach GmbH
- 12.4.1 Key Facts
- 12.4.2 Business Description
- 12.4.3 Products and Services
- 12.4.4 Financial Overview
- 12.4.5 SWOT Analysis
- 12.4.6 Key Developments
13. Appendix
- 13.1 About The Insight Partners
- 13.2 Word Index

