|
|
市場調査レポート
商品コード
1482334
アジア太平洋地域のプロセス計装の市場規模および予測、地域シェア、動向、成長機会分析レポート:技術別、流量計、レベル計、エンドユーザー産業別Asia Pacific Process Instrumentation Market Size and Forecast, Regional Share, Trend, and Growth Opportunity Analysis Report Coverage: By Technology, Flow Meter, Level Meter, and End-user Industry |
||||||
|
|||||||
|
|||||||

| アジア太平洋地域のプロセス計装の市場規模および予測、地域シェア、動向、成長機会分析レポート:技術別、流量計、レベル計、エンドユーザー産業別 |
|
出版日: 2024年05月02日
発行: The Insight Partners
ページ情報: 英文 118 Pages
納期: 即納可能
|

全表示
- 概要
- 図表
- 目次
アジア太平洋地域のプロセス計装市場規模は、2023年の59億1,000万米ドルから2031年には93億5,000万米ドルに達すると予測されています。2023~2031年のCAGRは5.9%と予測されます。
インド、中国、ベトナムなどの国々における急速な工業化は、プロセス計装の採用に大きく寄与しています。化学、石油・ガス、発電などの産業は、引き続き大量のエネルギーを消費しています。その結果、アジア太平洋地域諸国は、セクターを超えたエネルギー使用の具体的な変化を導く政策やプログラムによって、エネルギー効率化プログラムに対応しています。例えば、中国経済は、膨大な数の製造業によりエネルギー集約的です。中国中央政府は、建築物のエネルギー効率を高めるための対策を策定し続けてきました。エネルギー機器の規制やラベリング、エネルギーサービス企業(ESCO)は、いずれも建物のエネルギー効率化において重要な役割を果たしてきました。中国の第14次5カ年計画(2021-2025年)には、2025年までにエネルギー強度を2020年比で13.5%低下させるという国家目標が義務付けられています。また、ジャオナの新戦略エネルギー計画では、6,200万KLOEの省エネ達成を目指しており、2013年から2030年までにさらに40%の効率改善が必要です。
アジア太平洋地域の各国政府は、エネルギー・電力部門への投資を進めています。例えば、2024年1月、ベトナム共産党の政府最高機関であるベトナム政治局中央委員会は、2020年2月11日、「ビジョン2045を伴う2030年までの戦略的エネルギーオリエンテーション」に関する決議No.55-NQ/TWを発表しました。この文書では、2030年までの設備容量は125-130GWになると予測され、10年間で容量が倍増すると定義されています。ベトナムの第8次国家電力開発計画(PDP8)によると、2030年までに導入される総電力容量は~146,000MWで、2045年までに416,000MW以上になります。2030年までに石炭が占める発電容量は約30,000MWです。発電における石炭の役割が減少するにつれ、太陽光、天然ガス、風力が主要なエネルギー源となる可能性が高いです。
シンガポールの化学・エネルギー産業は、世界貿易統計レビュー2023によると、2022年には世界のトップ10に入り、第9位の化学品輸出国に浮上するなど、世界的に重要な地位を獲得しています。シンガポールの化学・エネルギー産業がこのように成長した背景には、プロセス機器に対する需要の増加と、同国におけるエネルギー効率とコスト最適化の重要性の高まりがあります。同産業が世界な事業展開をさらに拡大し続ける中、同国の急速な経済成長と、業務効率と持続可能性の向上に対する同産業のコミットメントを反映し、高度なプロセス計装ソリューションの需要が高まると予想されます。プロセス計装には、シンガポール全土の多様な産業でプロセス制御と効率を高めるために設計されたさまざまな技術とソリューションが含まれます。この市場を牽引しているのは、技術の進歩、プロセス制御システムに対する要求の高まり、エネルギー効率と費用対効果の重視の高まりです。プロセス計装機器の導入は、製品品質の向上、排出量の削減、ヒューマンエラーの減少、コスト効率の向上などのメリットをもたらします。
アジア太平洋地域のプロセス計装市場全体の規模は、一次情報と二次情報の両方を用いて算出されています。徹底的な二次調査は内外の情報源を利用して実施し、アジア太平洋地域のプロセス計装市場に関連する質的・量的情報を入手しています。また、このプロセスは、すべての市場セグメントに関するアジア太平洋地域のプロセス計装市場の概観を得るのに役立ちます。また、データを検証し、分析的洞察を得るために、業界関係者に複数の一次インタビューを実施しました。このプロセスには、副社長、市場開拓マネージャー、マーケットインテリジェンスマネージャー、国内営業マネージャーなどの業界専門家と、アジア太平洋地域プロセス計装市場を専門とする評価専門家、調査アナリスト、キーオピニオンリーダーなどの外部コンサルタントが参加しています。アジア太平洋地域のプロセス計装市場予測は、このマーケットプレースの利害関係者が成長戦略を計画するのに役立ちます。
目次
第1章 イントロダクション
第2章 エグゼクティブサマリー
- 主要な洞察
第3章 調査手法
- 調査範囲
- 2次調査
- 1次調査
第4章 アジア太平洋地域のプロセス計装市場情勢
- PEST分析
- エコシステム分析
- 原材料プロバイダー
- メーカー
- ディストリビューター/サプライヤー
- エンドユーザー
- バリューチェーンのベンダー一覧
第5章 アジア太平洋地域のプロセス計装市場:主要市場力学
- アジア太平洋地域のプロセス計装市場:主要市場力学
- 市場促進要因
- 産業オートメーションの台頭
- 効率的なエネルギーへのニーズの高まり
- 市場抑制要因
- プロセス機器の投資、設置、メンテナンスの高コスト
- 市場機会
- エネルギー・電力分野への投資の増加
- 製薬・化学産業の成長
- 今後の動向
- スマート計装の普及
- 促進要因と抑制要因の影響
第6章 アジア太平洋地域のプロセス計装市場分析
- アジア太平洋地域のプロセス計装市場の収益、2023-2031年
- アジア太平洋地域のプロセス計装市場の予測と分析
第7章 アジア太平洋地域のプロセス計装市場分析:技術別
- 流量計
- マスフロー
- 電磁流速計
- ボルテックス
- 超音波
- その他
- 圧力・温度計
- 分析機器
- レベル計
- 高周波レーダー
- TDR
- その他
第8章 アジア太平洋地域のプロセス計装市場分析:エンドユーザー産業別
- 石油・ガス
- エネルギー・電力
- 水・廃水
- 飲食品
- 海洋
- 石油化学
- 化学
- その他
第9章 アジア太平洋地域のプロセス計装市場:国別分析
- アジア太平洋地域
- シンガポール
- タイ
- フィリピン
- ベトナム
- APACのその他諸国
第10章 競合情勢
- 各社のポジショニングと集中度
- 主要プレーヤーによるヒートマップ分析
第11章 業界情勢
- 市場イニシアティブ
- 製品開発
第12章 企業プロファイル
- ABB Ltd
- Emerson Electric Co
- ENDRESS+HAUSER GROUP SERVICES AG
- Honeywell International Inc
- Metso Outotec Corp
- Brooks Instrument
- Schneider Electric SE
- Siemens AG
- Yokogawa Electric Corp
- Fuji Electric Co Ltd
第13章 付録
List Of Tables
- Table 1. Asia Pacific Process Instrumentation Market Segmentation
- Table 2. List of Vendors
- Table 3. Asia Pacific Process Instrumentation Market - Revenue and Forecast to 2031 (US$ Million)
- Table 4. Asia Pacific Process Instrumentation Market - Revenue and Forecast to 2031 (US$ Million) - by Technology
- Table 5. Asia Pacific Process Instrumentation Market - Revenue and Forecast to 2031 (US$ Million) - by End-user Industry
- Table 6. Asia Pacific Process Instrumentation Market - Revenue and Forecast to 2031 (US$ Million) - by Country
- Table 7. Singapore: Asia Pacific Process Instrumentation Market - Revenue and Forecast to 2031 (US$ Million) - by Technology
- Table 8. Singapore: Asia Pacific Process Instrumentation Market - Revenue and Forecast to 2031 (US$ Million) - by Flow Meter
- Table 9. Singapore: Asia Pacific Process Instrumentation Market - Revenue and Forecast to 2031 (US$ Million) - by Level Meter
- Table 10. Singapore: Asia Pacific Process Instrumentation Market - Revenue and Forecast to 2031 (US$ Million) - by End-user Industry
- Table 11. Thailand: Asia Pacific Process Instrumentation Market - Revenue and Forecast to 2031 (US$ Million) - by Technology
- Table 12. Thailand: Asia Pacific Process Instrumentation Market - Revenue and Forecast to 2031 (US$ Million) - by Flow Meter
- Table 13. Thailand: Asia Pacific Process Instrumentation Market - Revenue and Forecast to 2031 (US$ Million) - by Level Meter
- Table 14. Thailand: Asia Pacific Process Instrumentation Market - Revenue and Forecast to 2031 (US$ Million) - by End-user Industry
- Table 15. Philippines: Asia Pacific Process Instrumentation Market - Revenue and Forecast to 2031 (US$ Million) - by Technology
- Table 16. Philippines: Asia Pacific Process Instrumentation Market - Revenue and Forecast to 2031 (US$ Million) - by Flow Meter
- Table 17. Philippines: Asia Pacific Process Instrumentation Market - Revenue and Forecast to 2031 (US$ Million) - by Level Meter
- Table 18. Philippines: Asia Pacific Process Instrumentation Market - Revenue and Forecast to 2031 (US$ Million) - by End-user Industry
- Table 19. Vietnam: Asia Pacific Process Instrumentation Market - Revenue and Forecast to 2031 (US$ Million) - by Technology
- Table 20. Vietnam: Asia Pacific Process Instrumentation Market - Revenue and Forecast to 2031 (US$ Million) - by Flow Meter
- Table 21. Vietnam: Asia Pacific Process Instrumentation Market - Revenue and Forecast to 2031 (US$ Million) - by Level Meter
- Table 22. Vietnam: Asia Pacific Process Instrumentation Market - Revenue and Forecast to 2031 (US$ Million) - by End-user Industry
- Table 23. Rest of APAC: Asia Pacific Process Instrumentation Market - Revenue and Forecast to 2031 (US$ Million) - by Technology
- Table 24. Rest of APAC: Asia Pacific Process Instrumentation Market - Revenue and Forecast to 2031 (US$ Million) - by Flow Meter
- Table 25. Rest of APAC: Asia Pacific Process Instrumentation Market - Revenue and Forecast to 2031 (US$ Million) - by Level Meter
- Table 26. Rest of APAC: Asia Pacific Process Instrumentation Market - Revenue and Forecast to 2031 (US$ Million) - by End-user Industry
- Table 27. Heat Map Analysis by Key Players
- Table 28. List of Abbreviation
List Of Figures
- Figure 1. Asia Pacific Process Instrumentation Market Segmentation, by Country
- Figure 2. PEST Analysis
- Figure 3. Impact Analysis of Drivers and Restraints
- Figure 4. Asia Pacific Process Instrumentation Market Revenue (US$ Million), 2023-2031
- Figure 5. Asia Pacific Process Instrumentation Market Share (%) - by Technology, 2023 and 2031
- Figure 6. Flow Meter: Asia Pacific Process Instrumentation Market- Revenue and Forecast to 2031 (US$ Million)
- Figure 7. Mass Flow: Asia Pacific Process Instrumentation Market- Revenue and Forecast to 2031 (US$ Million)
- Figure 8. EMF: Asia Pacific Process Instrumentation Market- Revenue and Forecast to 2031 (US$ Million)
- Figure 9. Vortex: Asia Pacific Process Instrumentation Market- Revenue and Forecast to 2031 (US$ Million)
- Figure 10. Ultrasonic: Asia Pacific Process Instrumentation Market- Revenue and Forecast to 2031 (US$ Million)
- Figure 11. Others: Asia Pacific Process Instrumentation Market- Revenue and Forecast to 2031 (US$ Million)
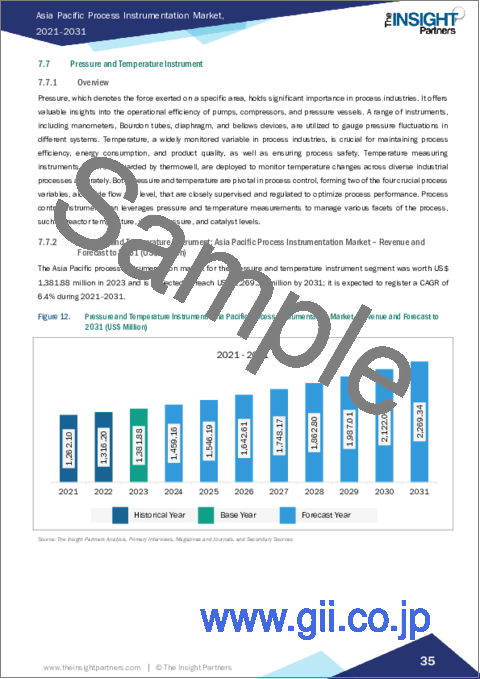
- Figure 12. Pressure and Temperature Instrument: Asia Pacific Process Instrumentation Market- Revenue and Forecast to 2031 (US$ Million)
- Figure 13. Analytical Instrument: Asia Pacific Process Instrumentation Market- Revenue and Forecast to 2031 (US$ Million)
- Figure 14. Level Meter: Asia Pacific Process Instrumentation Market- Revenue and Forecast to 2031 (US$ Million)
- Figure 15. High frequency Radar: Asia Pacific Process Instrumentation Market- Revenue and Forecast to 2031 (US$ Million)
- Figure 16. TDR: Asia Pacific Process Instrumentation Market- Revenue and Forecast to 2031 (US$ Million)
- Figure 17. Others: Asia Pacific Process Instrumentation Market- Revenue and Forecast to 2031 (US$ Million)
- Figure 18. Asia Pacific Process Instrumentation Market Share (%) - by End-user Industry, 2023 and 2031
- Figure 19. Oil and Gas: Asia Pacific Process Instrumentation Market- Revenue and Forecast to 2031 (US$ Million)
- Figure 20. Energy and Power: Asia Pacific Process Instrumentation Market- Revenue and Forecast to 2031 (US$ Million)
- Figure 21. Water and Waste water: Asia Pacific Process Instrumentation Market- Revenue and Forecast to 2031 (US$ Million)
- Figure 22. Food and Beverage: Asia Pacific Process Instrumentation Market- Revenue and Forecast to 2031 (US$ Million)
- Figure 23. Marine: Asia Pacific Process Instrumentation Market- Revenue and Forecast to 2031 (US$ Million)
- Figure 24. Petrochemical: Asia Pacific Process Instrumentation Market- Revenue and Forecast to 2031 (US$ Million)
- Figure 25. Chemical: Asia Pacific Process Instrumentation Market- Revenue and Forecast to 2031 (US$ Million)
- Figure 26. Others: Asia Pacific Process Instrumentation Market- Revenue and Forecast to 2031 (US$ Million)
- Figure 27. Asia Pacific Process Instrumentation Market Breakdown by Key Countries, 2023 and 2031 (%)
- Figure 28. Singapore: Asia Pacific Process Instrumentation Market - Revenue and Forecast to 2031 (US$ Million)
- Figure 29. Thailand: Asia Pacific Process Instrumentation Market - Revenue and Forecast to 2031 (US$ Million)
- Figure 30. Philippines: Asia Pacific Process Instrumentation Market - Revenue and Forecast to 2031 (US$ Million)
- Figure 31. Vietnam: Asia Pacific Process Instrumentation Market - Revenue and Forecast to 2031 (US$ Million)
- Figure 32. Rest of APAC: Asia Pacific Process Instrumentation Market - Revenue and Forecast to 2031 (US$ Million)
- Figure 33. Company Positioning & Concentration
The Asia Pacific process Instrumentation market size is projected to reach US$ 9.35 billion by 2031 from US$ 5.91 billion in 2023. The market is expected to register a CAGR of 5.9% in 2023-2031.
Rapid industrialization in countries such as India, China, and Vietnam are a significant contributor to the adoption of process instrumentation. Industries such as chemicals, oil & gas, and power generation continue to be large energy consumers. As a result, countries in Asia Pacific are responding to energy efficiency programs with policies and programs to guide specific changes in energy use across sectors. For example, China's economy is energy-intensive due to a huge number of manufacturing industries. The Central Government of China has continued to develop measures to increase building energy efficiency. Energy appliance regulations and labeling, as well as energy service corporations (ESCOs), have all played crucial roles in building energy efficiency. China's 14th Five-Year Plan (2021-2025) contains a mandatory national target to lower energy intensity by 13.5% below 2020 levels by 2025. Also, Jaona's New Strategic Energy Plan aims to achieve 62 million KLOE energy savings, which requires a further 40% efficiency improvement from 2013 to 2030.
Governments of various countries across Asia Pacific are investing in the energy & power sector. For example, in January 2024, the Central Committee of the Politburo of Vietnam, the top government body of the Communist Party of Vietnam, issued resolution no. 55-NQ/TW on February 11, 2020, on Strategic Energy Orientation until 2030 with Vision 2045. This document defined that installed capacity by 2030 is projected to be 125-130GW, which will double its capacity in 10 years. According to Vietnam's Eight National Power Development Plan (PDP8), the total power capacity installed by 2030 will be ~146,000 MW and account for more than 416,000 MW by 2045. The proposed capacity that coal accounts for approximately 30,000 MW of power generation by 2030. As coal's role in power generation diminishes, solar, natural gas, and wind are likely to account for major sources of energy.
The chemicals & energy industry in Singapore has achieved significant global standing, ranking among the top 10 worldwide and emerging as the 9th largest exporter of chemicals in 2022, as per the World Trade Statistical Review 2023. This growth in the chemicals & energy sector in Singapore is attributed to the increasing demand for process instrumentation and the growing importance of energy efficiency and cost optimization in the country. As the industry continues to further expand its global footprint, the demand for advanced process instrumentation solutions is expected to rise, reflecting the country's rapid economic growth and the industry's commitment to enhancing operational efficiency and sustainability. Process instrumentation involves a variety of technologies and solutions designed to enhance process control and efficiency in diverse industries across Singapore. This market is driven by advancements in technology, rising requirements for process control systems, and the increasing emphasis on energy efficiency and cost-effectiveness. The implementation of process instrumentation equipment offers advantages such as enhanced product quality, reduced emissions, decreased human errors, and cost efficiencies.
ABB Ltd.; Emerson Electric Co.; Honeywell International Inc.; Brooks Instrument; Schneider Electric; Siemens; Yokogawa Electric Corporation; Endress+Hauser Group Services AG; Metso Corporation; and Fuji Electric Co, Ltd are among the prominent players profiled in the Asia Pacific process instrumentation market. The Asia Pacific process instrumentation market report emphasizes the key factors driving the market and prominent players' developments.
The overall Asia Pacific process instrumentation market size has been derived using both primary and secondary sources. Exhaustive secondary research has been conducted using internal and external sources to obtain qualitative and quantitative information related to the. The process also helps obtain an overview of Asia Pacific process instrumentation market with respect to all the market segments. Also, multiple primary interviews have been conducted with industry participants to validate the data and gain analytical insights. This process includes industry experts such as VPs, business development managers, market intelligence managers, and national sales managers, along with external consultants such as valuation experts, research analysts, and key opinion leaders, specializing in the Asia Pacific process instrumentation market. The Asia Pacific process instrumentation market forecast can help stakeholders in this marketplace plan their growth strategies.
Table Of Contents
1. Introduction
- 1.1 The Insight Partners Research Report Guidance
- 1.2 Market Segmentation
2. Executive Summary
- 2.1 Key Insights
3. Research Methodology
- 3.1 Coverage
- 3.2 Secondary Research
- 3.3 Primary Research
4. Asia Pacific Process Instrumentation Market Landscape
- 4.1 Overview
- 4.2 PEST Analysis
- 4.3 Ecosystem Analysis
- 4.3.1 Raw Material Providers
- 4.3.2 Manufacturers
- 4.3.3 Distributors/Suppliers
- 4.3.4 End Users
- 4.3.5 List of Vendors in the Value Chain
5. Asia Pacific Process Instrumentation Market - Key Market Dynamics
- 5.1 Asia Pacific Process Instrumentation Market - Key Market Dynamics
- 5.2 Market Drivers
- 5.2.1 Rising Industrial Automation
- 5.2.2 Growing Need for Efficient Energy
- 5.3 Market Restraint
- 5.3.1 High Cost of Investment, Installation, and Maintenance of Process Instruments
- 5.4 Market Opportunities
- 5.4.1 Increasing Investments in Energy & Power Sector
- 5.4.2 Growth in Pharmaceuticals and Chemical Industries
- 5.5 Future Trends
- 5.5.1 Popularity of Smart Instrumentation
- 5.6 Impact of Drivers and Restraints:
6. Asia Pacific Process Instrumentation Market Analysis
- 6.1 Asia Pacific Process Instrumentation Market Revenue (US$ Million), 2023-2031
- 6.2 Asia Pacific Process Instrumentation Market Forecast and Analysis
7. Asia Pacific Process Instrumentation Market Analysis - by Technology
- 7.1 Flow Meter
- 7.1.1 Overview
- 7.1.2 Flow Meter: Asia Pacific Process Instrumentation Market - Revenue and Forecast to 2031 (US$ Million)
- 7.2 Mass Flow
- 7.2.1 Overview
- 7.2.2 Mass Flow: Asia Pacific Process Instrumentation Market - Revenue and Forecast to 2031 (US$ Million)
- 7.3 EMF
- 7.3.1 Overview
- 7.3.2 EMF: Asia Pacific Process Instrumentation Market - Revenue and Forecast to 2031 (US$ Million)
- 7.4 Vortex
- 7.4.1 Overview
- 7.4.2 Vortex: Asia Pacific Process Instrumentation Market - Revenue and Forecast to 2031 (US$ Million)
- 7.5 Ultrasonic
- 7.5.1 Overview
- 7.5.2 Ultrasonic: Asia Pacific Process Instrumentation Market - Revenue and Forecast to 2031 (US$ Million)
- 7.6 Others
- 7.6.1 Overview
- 7.6.2 Others: Asia Pacific Process Instrumentation Market - Revenue and Forecast to 2031 (US$ Million)
- 7.7 Pressure and Temperature Instrument
- 7.7.1 Overview
- 7.7.2 Pressure and Temperature Instrument: Asia Pacific Process Instrumentation Market - Revenue and Forecast to 2031 (US$ Million)
- 7.8 Analytical Instrument
- 7.8.1 Overview
- 7.8.2 Analytical Instrument: Asia Pacific Process Instrumentation Market - Revenue and Forecast to 2031 (US$ Million)
- 7.9 Level Meter
- 7.9.1 Overview
- 7.9.2 Level Meter: Asia Pacific Process Instrumentation Market - Revenue and Forecast to 2031 (US$ Million)
- 7.10 High frequency Radar
- 7.10.1 Overview
- 7.10.2 High frequency Radar: Asia Pacific Process Instrumentation Market - Revenue and Forecast to 2031 (US$ Million)
- 7.11 TDR
- 7.11.1 Overview
- 7.11.2 TDR: Asia Pacific Process Instrumentation Market - Revenue and Forecast to 2031 (US$ Million)
- 7.12 Others
- 7.12.1 Overview
- 7.12.2 Others: Asia Pacific Process Instrumentation Market - Revenue and Forecast to 2031 (US$ Million)
8. Asia Pacific Process Instrumentation Market Analysis - by End-user Industry
- 8.1 Oil and Gas
- 8.1.1 Overview
- 8.1.2 Oil and Gas: Asia Pacific Process Instrumentation Market - Revenue and Forecast to 2031 (US$ Million)
- 8.2 Energy and Power
- 8.2.1 Overview
- 8.2.2 Energy and Power: Asia Pacific Process Instrumentation Market - Revenue and Forecast to 2031 (US$ Million)
- 8.3 Water and Waste water
- 8.3.1 Overview
- 8.3.2 Water and Waste water: Asia Pacific Process Instrumentation Market - Revenue and Forecast to 2031 (US$ Million)
- 8.4 Food and Beverage
- 8.4.1 Overview
- 8.4.2 Food and Beverage: Asia Pacific Process Instrumentation Market - Revenue and Forecast to 2031 (US$ Million)
- 8.5 Marine
- 8.5.1 Overview
- 8.5.2 Marine: Asia Pacific Process Instrumentation Market - Revenue and Forecast to 2031 (US$ Million)
- 8.6 Petrochemical
- 8.6.1 Overview
- 8.6.2 Petrochemical: Asia Pacific Process Instrumentation Market - Revenue and Forecast to 2031 (US$ Million)
- 8.7 Chemical
- 8.7.1 Overview
- 8.7.2 Chemical: Asia Pacific Process Instrumentation Market - Revenue and Forecast to 2031 (US$ Million)
- 8.8 Others
- 8.8.1 Overview
- 8.8.2 Others: Asia Pacific Process Instrumentation Market - Revenue and Forecast to 2031 (US$ Million)
9. Asia Pacific Process Instrumentation Market - Country Analysis
- 9.1 Asia Pacific
- 9.1.1 Asia Pacific Process Instrumentation Market Breakdown by Countries
- 9.1.2 Asia Pacific Process Instrumentation Market Revenue and Forecast and Analysis - by Country
- 9.1.2.1 Asia Pacific Process Instrumentation Market Revenue and Forecast and Analysis - by Country
- 9.1.2.2 Singapore: Asia Pacific Process Instrumentation Market - Revenue and Forecast to 2031 (US$ Million)
- 9.1.2.2.1 Singapore: Asia Pacific Process Instrumentation Market Breakdown by Technology
- 9.1.2.2.2 Singapore: Asia Pacific Process Instrumentation Market Breakdown by Flow Meter
- 9.1.2.2.3 Singapore: Asia Pacific Process Instrumentation Market Breakdown by Level Meter
- 9.1.2.2.4 Singapore: Asia Pacific Process Instrumentation Market Breakdown by End-user Industry
- 9.1.2.3 Thailand: Asia Pacific Process Instrumentation Market - Revenue and Forecast to 2031 (US$ Million)
- 9.1.2.3.1 Thailand: Asia Pacific Process Instrumentation Market Breakdown by Technology
- 9.1.2.3.2 Thailand: Asia Pacific Process Instrumentation Market Breakdown by Flow Meter
- 9.1.2.3.3 Thailand: Asia Pacific Process Instrumentation Market Breakdown by Level Meter
- 9.1.2.3.4 Thailand: Asia Pacific Process Instrumentation Market Breakdown by End-user Industry
- 9.1.2.4 Philippines: Asia Pacific Process Instrumentation Market - Revenue and Forecast to 2031 (US$ Million)
- 9.1.2.4.1 Philippines: Asia Pacific Process Instrumentation Market Breakdown by Technology
- 9.1.2.4.2 Philippines: Asia Pacific Process Instrumentation Market Breakdown by Flow Meter
- 9.1.2.4.3 Philippines: Asia Pacific Process Instrumentation Market Breakdown by Level Meter
- 9.1.2.4.4 Philippines: Asia Pacific Process Instrumentation Market Breakdown by End-user Industry
- 9.1.2.5 Vietnam: Asia Pacific Process Instrumentation Market - Revenue and Forecast to 2031 (US$ Million)
- 9.1.2.5.1 Vietnam: Asia Pacific Process Instrumentation Market Breakdown by Technology
- 9.1.2.5.2 Vietnam: Asia Pacific Process Instrumentation Market Breakdown by Flow Meter
- 9.1.2.5.3 Vietnam: Asia Pacific Process Instrumentation Market Breakdown by Level Meter
- 9.1.2.5.4 Vietnam: Asia Pacific Process Instrumentation Market Breakdown by End-user Industry
- 9.1.2.6 Rest of APAC: Asia Pacific Process Instrumentation Market - Revenue and Forecast to 2031 (US$ Million)
- 9.1.2.6.1 Rest of APAC: Asia Pacific Process Instrumentation Market Breakdown by Technology
- 9.1.2.6.2 Rest of APAC: Asia Pacific Process Instrumentation Market Breakdown by Flow Meter
- 9.1.2.6.3 Rest of APAC: Asia Pacific Process Instrumentation Market Breakdown by Level Meter
- 9.1.2.6.4 Rest of APAC: Asia Pacific Process Instrumentation Market Breakdown by End-user Industry
10. Competitive Landscape
- 10.1 Company Positioning & Concentration
- 10.2 Heat Map Analysis by Key Players
11. Industry Landscape
- 11.1 Overview
- 11.2 Market Initiative
- 11.3 Product Development
12. Company Profiles
- 12.1 ABB Ltd
- 12.1.1 Key Facts
- 12.1.2 Business Description
- 12.1.3 Products and Services
- 12.1.4 Financial Overview
- 12.1.5 SWOT Analysis
- 12.1.6 Key Developments
- 12.2 Emerson Electric Co
- 12.2.1 Key Facts
- 12.2.2 Business Description
- 12.2.3 Products and Services
- 12.2.4 Financial Overview
- 12.2.5 SWOT Analysis
- 12.2.6 Key Developments
- 12.3 ENDRESS + HAUSER GROUP SERVICES AG
- 12.3.1 Key Facts
- 12.3.2 Business Description
- 12.3.3 Products and Services
- 12.3.4 Financial Overview
- 12.3.5 SWOT Analysis
- 12.3.6 Key Developments
- 12.4 Honeywell International Inc
- 12.4.1 Key Facts
- 12.4.2 Business Description
- 12.4.3 Products and Services
- 12.4.4 Financial Overview
- 12.4.5 SWOT Analysis
- 12.4.6 Key Developments
- 12.5 Metso Outotec Corp
- 12.5.1 Key Facts
- 12.5.2 Business Description
- 12.5.3 Products and Services
- 12.5.4 Financial Overview
- 12.5.5 SWOT Analysis
- 12.5.6 Key Developments
- 12.6 Brooks Instrument
- 12.6.1 Key Facts
- 12.6.2 Business Description
- 12.6.3 Products and Services
- 12.6.4 Financial Overview
- 12.6.5 SWOT Analysis
- 12.6.6 Key Developments
- 12.7 Schneider Electric SE
- 12.7.1 Key Facts
- 12.7.2 Business Description
- 12.7.3 Products and Services
- 12.7.4 Financial Overview
- 12.7.5 SWOT Analysis
- 12.7.6 Key Developments
- 12.8 Siemens AG
- 12.8.1 Key Facts
- 12.8.2 Business Description
- 12.8.3 Products and Services
- 12.8.4 Financial Overview
- 12.8.5 SWOT Analysis
- 12.8.6 Key Developments
- 12.9 Yokogawa Electric Corp
- 12.9.1 Key Facts
- 12.9.2 Business Description
- 12.9.3 Products and Services
- 12.9.4 Financial Overview
- 12.9.5 SWOT Analysis
- 12.9.6 Key Developments
- 12.10 Fuji Electric Co Ltd
- 12.10.1 Key Facts
- 12.10.2 Business Description
- 12.10.3 Products and Services
- 12.10.4 Financial Overview
- 12.10.5 SWOT Analysis
- 12.10.6 Key Developments
13. Appendix
- 13.1 Word Index
- 13.2 About The Insight Partners
