|
|
市場調査レポート
商品コード
1481949
アジア太平洋地域のビジュアライゼーションと3Dレンダリングソフトウェア:2030年までの市場予測 - 地域分析 - 用途、展開、エンドユーザー別Asia Pacific Visualization & 3D Rendering Software Market Forecast to 2030 - Regional Analysis - by Application, Deployment, and End User |
||||||

|
|||||||
|
|||||||


| アジア太平洋地域のビジュアライゼーションと3Dレンダリングソフトウェア:2030年までの市場予測 - 地域分析 - 用途、展開、エンドユーザー別 |
|
出版日: 2024年03月04日
発行: The Insight Partners
ページ情報: 英文 97 Pages
納期: 即納可能
|

全表示
- 概要
- 図表
- 目次
アジア太平洋地域のビジュアライゼーションと3Dレンダリングソフトウェア市場は、2022年の6億1,422万米ドルから2030年には30億5,698万米ドルに成長すると予測されています。2022年から2030年までのCAGRは22.2%と推定されています。
バーチャルリアリティ(VR)の普及がアジア太平洋地域のビジュアライゼーションと3Dレンダリングソフトウェア市場を活性化
バーチャルリアリティ(VR)は世界的に大きな支持を得ています。3Dアニメーションの制作やデザインにVRを使用することで、3Dアニメーションのインタラクティブ性が大幅に向上しています。VR技術は、コンピュータ技術の進歩や社会的な要求によって大きく発展してきました。バーチャルリアリティのイントロダクションは、世界の3Dアニメーションソフトウェア産業を強化するかもしれないです。一方、バーチャルリアリティでアニメ映画を見ることへの関心の高まりは、市場の有利な拡大の基調になると予想されます。さらに、VR技術の採用は、ゲーム、広告、ホームエンターテイメントなど様々な業界で拡大しています。アニメーターはVR技術を使って同様の効果を生み出しています。3Dアニメーション市場のプレイヤーは、より複雑なアニメーションの制作や、より魅力的な仮想環境の構築の仕事が増えているため、3Dビジュアライゼーションの需要が増加しています。視覚効果もバーチャルリアリティも、観客を驚かせるような新しい環境を開発することに主眼を置いています。例えば、2022年9月、上海ディズニー・リゾートは、ディズニー・タウンのエンターテイメント、ダイニング、ショッピング・センターで没入型バーチャル・リアリティ(VR)体験を導入しました。エンターテインメントにおけるVRの人気の高まりは、ビジュアライゼーションと3Dレンダリングソフトウェア市場の成長機会をもたらすと期待されています。
スタジオは、リアルタイムグラフィックス、モーションキャプチャ、フェイシャルキャプチャ、カメラトラッキング技術を使用して、重要なVR資産であるバーチャルプロダクションを作成するためのツールを増やしています。VRは、ほとんどの視覚効果会社にとってますます重要になってきています。例えば、Framestore StudiosはHBOと協力し、テレビ番組 "Game of Thrones "に基づくVRプロジェクト "Ascend the Wall "を立ち上げました。バーチャルリアリティ技術の進歩に伴い、近い将来、よりユーザーフレンドリーなインターフェースが期待されます。その用途はより一般的になり、より高品質になる可能性が高いです。VRやその他の拡張現実(XR)技術は、今後2、3年の間に間違いなくアニメーションを大きく進歩させると予想されます。このように、バーチャルリアリティ技術の出現は、3Dアニメーションビジネスに新たな展望を開く。
アジア太平洋地域のビジュアライゼーションと3Dレンダリングソフトウェア市場概要
APACは世界の製造拠点であり、高度に成長する製造業で構成されています。APACの各国政府は、FDIの機会を増やす努力をしています。各国政府は、税制優遇措置、補助金、資金を提供し、製造企業が自国に製造施設を設置するよう誘致しています。さらに、「メイド・イン・チャイナ2025」や「メイド・イン・インド」といったイニシアティブが、それぞれの製造業の成長を後押ししています。しかし、この地域最大の製造拠点である中国は、人件費の上昇を目の当たりにしています。高技能を要する製造業のハブへと進化する中、インド、韓国、台湾、ベトナムといった他の新興諸国は、より低い労働コストを提供することで、中小規模の製造施設を近隣諸国に移転させようと、多くの企業を惹きつけています。インフラの改善、国内消費の増加、コストの低下が、国際的な製造企業をAPACでの事業拠点設立に惹きつけています。
APACでは人口が多いため、住宅や商業施設の建設需要が高まっています。さらに、地域政府は、建設やインフラ開発への民間投資を誘致するために、いくつかのイニシアチブをとっています。例えば、マレーシア政府が2011年から2020年にかけて実施した経済変革プログラム(ETP)は、インフラや建設活動への巨額の直接投資を誘致するためのものでした。APACの新興国は毎年GDPが高成長しており、国民の消費能力を押し上げています。生活水準の上昇に伴い、この地域では過去数十年間にインフラ建設が大幅に急増しました。さらに、住宅の改造、改築、美的向上への注目の高まりが、APACにおけるビジュアライゼーションおよび3Dレンダリングソフトウェア市場の成長を促進しています。
バーチャルリアリティや同様の動向の採用が増加していることから、今後数年間、APACにおけるハイテク視覚化・3Dレンダリングツールの採用が促進されると予想されます。若い人口が多く、スマートフォンの価格が手ごろになっていることから、この地域ではここ数年、モバイルゲーム産業が盛んになっています。一方、この地域には、グラフィカルでリッチなコンテンツを制作するためのデザイン・ツールを開発するコンテンツ・クリエイターも数多く存在します。同地域の中小企業は、広告アプリケーションでアニメーションコンテンツを使用する傾向にあり、これがビジュアライゼーションおよび3Dレンダリングツールの採用をさらに後押ししています。
アジア太平洋地域のビジュアライゼーションと3Dレンダリングソフトウェア市場の収益と2030年までの予測(金額)
アジア太平洋地域のビジュアライゼーションと3Dレンダリングソフトウェア市場のセグメンテーション
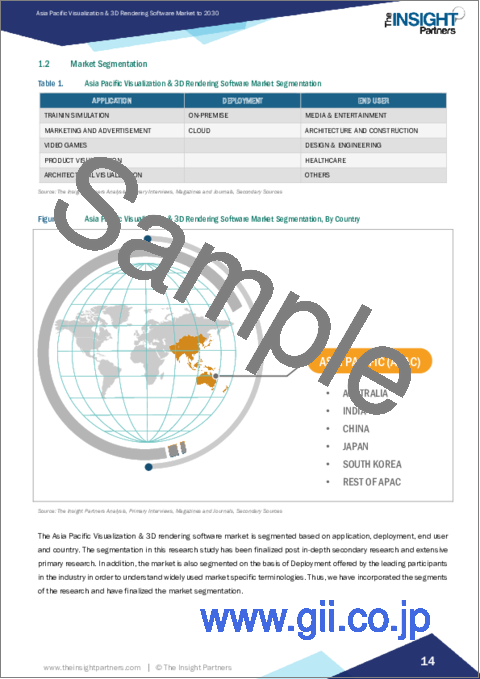
アジア太平洋地域のビジュアライゼーションと3Dレンダリングソフトウェア市場は、用途、展開、エンドユーザー、国別に区分されます。
用途別では、アジア太平洋地域のビジュアライゼーションと3Dレンダリングソフトウェア市場は、トレーニングシミュレーション、マーケティング&広告、ビデオゲーム、製品ビジュアライゼーション、建築ビジュアライゼーションに区分されます。建築ビジュアライゼーションセグメントは、2022年のアジア太平洋地域ビジュアライゼーションと3Dレンダリングソフトウェア市場で最大のシェアを占めました。
展開に基づき、アジア太平洋地域のビジュアライゼーションと3Dレンダリングソフトウェア市場はオンプレミスとクラウドに区分されます。2022年のアジア太平洋地域のビジュアライゼーションと3Dレンダリングソフトウェア市場では、オンプレミスセグメントが大きなシェアを占めています。
エンドユーザー別に見ると、アジア太平洋地域のビジュアライゼーションと3Dレンダリングソフトウェア市場は、メディア&エンターテインメント、建築&建設、デザイン&エンジニアリング、ヘルスケア、その他に区分されます。2022年のアジア太平洋地域ビジュアライゼーションと3Dレンダリングソフトウェア市場では、建築・建設セグメントが最大のシェアを占めています。
国別に見ると、アジア太平洋地域のビジュアライゼーションと3Dレンダリングソフトウェア市場は、オーストラリア、中国、インド、日本、韓国、その他アジア太平洋地域に区分されます。2022年のアジア太平洋地域のビジュアライゼーションと3Dレンダリングソフトウェア市場は中国が独占。
Act-3D、Chaos Group、Christie Digital Systems、Dassault Systemes SE、NVIDIA Corp、Thea Render by Altairは、アジア太平洋地域のビジュアライゼーションと3Dレンダリングソフトウェア市場で事業を展開している大手企業です。
目次
第1章 イントロダクション
第2章 エグゼクティブサマリー
- 主要洞察
- 市場の魅力
第3章 調査手法
- 調査範囲
- 2次調査
- 1次調査
第4章 アジア太平洋地域のビジュアライゼーションと3Dレンダリングソフトウェア市場情勢
- エコシステム分析
- サービスプロバイダー
- エンドユーザー業界
- バリューチェーンのベンダー一覧
- 重要考察
- 3Dファイルフォーマットで使用されるデータフォーマットの詳細分析
- OBJ
- ステップ
- COLLADA
- STL
- FBX
- GLTF
- 3DS
- IGES
- 3Dファイルフォーマットで使用されるデータフォーマットの詳細分析
第5章 アジア太平洋地域のビジュアライゼーションと3Dレンダリングソフトウェア市場- 主要産業力学
- 促進要因
- より高速で効率的なソリューションへのニーズの増加
- ゲームとビデオ撮影の需要の急増
- 建設およびインフラ開発の増加
- リアルなビジュアルに対する需要の増加
- 市場抑制要因
- 新興諸国における熟練労働力と支援インフラの不足
- 市場機会
- バーチャルリアリティ(VR)の普及
- 製造業の急拡大とプロトタイピングの必要性
- 医療および科学研究におけるビジュアライゼーションと3Dレンダリングソフトウェアの使用の増加
- 今後の動向
- ファクトリーオートメーションの出現
- クラウドベースの技術採用の増加
- 促進要因と阻害要因の影響
第6章 ビジュアライゼーションと3Dレンダリングソフトウェア市場:アジア太平洋地域市場分析
- アジア太平洋地域のビジュアライゼーションと3Dレンダリングソフトウェア市場概要
- アジア太平洋地域のビジュアライゼーションと3Dレンダリングソフトウェア市場収益:2022年~2030年
- アジア太平洋地域のビジュアライゼーションと3Dレンダリングソフトウェア市場の予測・分析
第7章 アジア太平洋地域のビジュアライゼーションと3Dレンダリングソフトウェア市場分析:用途
- トレーニングシミュレーション
- マーケティングと広告
- ビデオゲーム
- 製品ビジュアライゼーション
- アーキテクチャのビジュアライゼーション
第8章 アジア太平洋地域のビジュアライゼーションと3Dレンダリングソフトウェア市場分析:展開
- オンプレミス
- クラウド
第9章 アジア太平洋地域のビジュアライゼーションと3Dレンダリングソフトウェア市場分析:エンドユーザー
- メディアとエンターテインメント
- 建築と建設
- 設計とエンジニアリング
- ヘルスケア
- その他
第10章 アジア太平洋地域のビジュアライゼーションと3Dレンダリングソフトウェア市場:国別分析
- オーストラリア
- 中国
- インド
- 日本
- 韓国
- その他アジア太平洋地域
第11章 業界情勢
- 市場イニシアティブ
- 製品開発
- 合併と買収
第12章 企業プロファイル
- Autodesk Inc
- Christie Digital Systems
- Dassault Systemes SE
- NVIDIA Corp
- Chaos Group
- Thea Render by Altair
第13章 付録
List Of Tables
- Table 1. Asia Pacific Visualization & 3D Rendering Software Market Segmentation
- Table 2. Asia Pacific Visualization & 3D Rendering Software Market Revenue and Forecasts To 2030 (US$ Million)
- Table 3. Asia Pacific Visualization & 3D Rendering Software Market Revenue and Forecasts To 2030 (US$ Million) - Application
- Table 4. Asia Pacific Visualization & 3D Rendering Software Market Revenue and Forecasts To 2030 (US$ Million) - Deployment
- Table 5. Asia Pacific Visualization & 3D Rendering Software Market Revenue and Forecasts To 2030 (US$ Million) - End User
- Table 6. Asia Pacific Visualization & 3D Rendering Software Market, by Country - Revenue and Forecast to 2030 (USD Million)
- Table 7. Australia: Asia Pacific Visualization & 3D Rendering Software Market Revenue and Forecasts To 2030 (US$ Mn) - By Application
- Table 8. Australia: Asia Pacific Visualization & 3D Rendering Software Market Revenue and Forecasts To 2030 (US$ Mn) - By Deployment
- Table 9. Australia: Asia Pacific Visualization & 3D Rendering Software Market Revenue and Forecasts To 2030 (US$ Mn) - By End User
- Table 10. China: Asia Pacific Visualization & 3D Rendering Software Market Revenue and Forecasts To 2030 (US$ Mn) - By Application
- Table 11. China: Asia Pacific Visualization & 3D Rendering Software Market Revenue and Forecasts To 2030 (US$ Mn) - By Deployment
- Table 12. China: Asia Pacific Visualization & 3D Rendering Software Market Revenue and Forecasts To 2030 (US$ Mn) - By End User
- Table 13. India: Asia Pacific Visualization & 3D Rendering Software Market Revenue and Forecasts To 2030 (US$ Mn) - By Application
- Table 14. India: Asia Pacific Visualization & 3D Rendering Software Market Revenue and Forecasts To 2030 (US$ Mn) - By Deployment
- Table 15. India: Asia Pacific Visualization & 3D Rendering Software Market Revenue and Forecasts To 2030 (US$ Mn) - By End User
- Table 16. Japan: Asia Pacific Visualization & 3D Rendering Software Market Revenue and Forecasts To 2030 (US$ Mn) - By Application
- Table 17. Japan: Asia Pacific Visualization & 3D Rendering Software Market Revenue and Forecasts To 2030 (US$ Mn) - By Deployment
- Table 18. Japan: Asia Pacific Visualization & 3D Rendering Software Market Revenue and Forecasts To 2030 (US$ Mn) - By End User
- Table 19. South Korea: Asia Pacific Visualization & 3D Rendering Software Market Revenue and Forecasts To 2030 (US$ Mn) - By Application
- Table 20. South Korea: Asia Pacific Visualization & 3D Rendering Software Market Revenue and Forecasts To 2030 (US$ Mn) - By Deployment
- Table 21. South Korea: Asia Pacific Visualization & 3D Rendering Software Market Revenue and Forecasts To 2030 (US$ Mn) - By End User
- Table 22. Rest of Asia Pacific: Asia Pacific Visualization & 3D Rendering Software Market Revenue and Forecasts To 2030 (US$ Mn) - By Application
- Table 23. Rest of Asia Pacific: Asia Pacific Visualization & 3D Rendering Software Market Revenue and Forecasts To 2030 (US$ Mn) - By Deployment
- Table 24. Rest of Asia Pacific: Asia Pacific Visualization & 3D Rendering Software Market Revenue and Forecasts To 2030 (US$ Mn) - By End User
- Table 25. List of Abbreviation
List Of Figures
- Figure 1. Asia Pacific Visualization & 3D Rendering Software Market Segmentation, By Country
- Figure 2. Ecosystem: Asia Pacific Visualization & 3D Rendering Software Market
- Figure 3. Asia Pacific Visualization & 3D Rendering Software Market - Key Industry Dynamics
- Figure 4. Impact Analysis of Drivers and Restraints
- Figure 5. Asia Pacific Visualization & 3D Rendering Software Market Revenue (US$ Million), 2022 & 2030
- Figure 6. Asia Pacific Visualization & 3D Rendering Software Market Share (%) - Application, 2022 and 2030
- Figure 7. Training Simulation: Asia Pacific Visualization & 3D Rendering Software Market Revenue and Forecasts To 2030 (US$ Million)
- Figure 8. Marketing and Advertisement: Asia Pacific Visualization & 3D Rendering Software Market Revenue and Forecasts To 2030 (US$ Million)
- Figure 9. Video Games: Asia Pacific Visualization & 3D Rendering Software Market Revenue and Forecasts To 2030 (US$ Million)
- Figure 10. Product Visualization: Asia Pacific Visualization & 3D Rendering Software Market Revenue and Forecasts To 2030 (US$ Million)
- Figure 11. Architectural Visualization: Asia Pacific Visualization & 3D Rendering Software Market Revenue and Forecasts To 2030 (US$ Million)
- Figure 12. Asia Pacific Visualization & 3D Rendering Software Market Share (%) - Deployment, 2022 and 2030
- Figure 13. On-Premise: Asia Pacific Visualization & 3D Rendering Software Market Revenue and Forecasts To 2030 (US$ Million)
- Figure 14. Cloud: Asia Pacific Visualization & 3D Rendering Software Market Revenue and Forecasts To 2030 (US$ Million)
- Figure 15. Asia Pacific Visualization & 3D Rendering Software Market Share (%) - End User, 2022 and 2030
- Figure 16. Media and Entertainment: Asia Pacific Visualization & 3D Rendering Software Market Revenue and Forecasts To 2030 (US$ Million)
- Figure 17. Architecture and Construction: Asia Pacific Visualization & 3D Rendering Software Market Revenue and Forecasts To 2030 (US$ Million)
- Figure 18. Design and Engineering: Asia Pacific Visualization & 3D Rendering Software Market Revenue and Forecasts To 2030 (US$ Million)
- Figure 19. Healthcare: Asia Pacific Visualization & 3D Rendering Software Market Revenue and Forecasts To 2030 (US$ Million)
- Figure 20. Others: Asia Pacific Visualization & 3D Rendering Software Market Revenue and Forecasts To 2030 (US$ Million)
- Figure 21. Asia Pacific Visualization & 3D Rendering Software Market, By Country, 2022 ($Mn)
- Figure 22. Asia Pacific Visualization & 3D Rendering Software Market Breakdown By Key Countries, 2022 And 2030 (%)
- Figure 23. Australia: Asia Pacific Visualization & 3D Rendering Software Market Revenue and Forecasts To 2030 (US$ Mn)
- Figure 24. China: Asia Pacific Visualization & 3D Rendering Software Market Revenue and Forecasts To 2030 (US$ Mn)
- Figure 25. India: Asia Pacific Visualization & 3D Rendering Software Market Revenue and Forecasts To 2030 (US$ Mn)
- Figure 26. Japan: Asia Pacific Visualization & 3D Rendering Software Market Revenue and Forecasts To 2030 (US$ Mn)
- Figure 27. South Korea: Asia Pacific Visualization & 3D Rendering Software Market Revenue and Forecasts To 2030 (US$ Mn)
- Figure 28. Rest of Asia Pacific: Asia Pacific Visualization & 3D Rendering Software Market Revenue and Forecasts To 2030 (US$ Mn)
The Asia Pacific visualization & 3D rendering software market is expected to grow from US$ 614.22 million in 2022 to US$ 3,056.98 million by 2030. It is estimated to grow at a CAGR of 22.2% from 2022 to 2030.
Proliferation of Virtual Reality (VR) Fuels Asia Pacific Visualization & 3D Rendering Software Market
Virtual reality (VR) is gaining significant traction globally. The use of VR in the production and design of 3D animation has significantly increased the interactivity of 3D animation. VR technologies have developed considerably due to advancements in computer technology and societal requirements. The introduction of virtual reality might enhance the global 3D animation software industry. On the other hand, increased interest in viewing animated movies in virtual reality is expected to set the tone for the markets lucrative expansion. Furthermore, the adoption of VR technology is growing in various industries such as gaming, advertising, and home entertainment. Animators are using VR technology to produce similar effects. Players in the 3D animation market are seeing a rise in demand for 3D visualization due to increased work on more complicated animations and creating more engaging virtual environments. Both visual effects and virtual reality are primarily concerned with developing a new environment that may astonish spectators. For instance, in September 2022, Shanghai Disney Resort introduced an immersive virtual reality (VR) experience at its Disney town entertainment, dining, and shopping center. The increased popularity of VR in entertainment is expected to provide opportunities for visualization and 3D rendering software market growth.
Studios are increasing their tools for creating virtual production-a significant VR asset-using real-time graphics, motion capture, facial capture, and camera tracking techniques. VR is increasingly becoming important to most visual effects firms. For instance, Framestore Studios collaborated with HBO to launch "Ascend the Wall", a VR project based on the TV show "Game of Thrones." As virtual reality technology advances, more user-friendly interfaces are expected in the near future. Their applications are likely to become more common and be of higher quality. VR and other extended reality (XR) technologies are expected to undoubtedly make significant advances in animation during the next couple of years. Thus, the emergence of virtual reality technology opens new prospects in the 3D animation business.
Asia Pacific Visualization & 3D Rendering Software Market Overview
APAC is a global manufacturing hub that comprises highly growing manufacturing sectors. Governments of APAC are making efforts to grab greater FDI opportunities. They offer tax rebates, subsidies, and funds to attract manufacturing companies to set up manufacturing facilities in their respective countries. Moreover, initiatives such as "Made in China 2025" and "Made in India" are propelling the growth of their respective manufacturing sectors. However, China, the largest manufacturing hub in the region, is witnessing a rise in labor costs. Amid its evolution into a high-skilled manufacturing hub, other developing countries-such as India, South Korea, Taiwan, and Vietnam-are attracting several businesses in a quest to relocate their low-to-medium-scaled manufacturing facilities to neighboring countries by offering lower labor costs. Improving infrastructure, rising domestic consumption, and lowering costs attract international manufacturing companies to establish their operating sites in APAC.
A large population has increased demand for residential and commercial construction in APAC. Further, regional governments are taking several initiatives to entice private investments in construction and infrastructure developments. For instance, the Malaysian Governments 2011-2020 Economic Transformation Program (ETP) was meant to attract a huge FDI in infrastructure and construction activities. The emerging economies in APAC are experiencing high growth in their GDPs every year, boosting the populations spending capacity. With the rising standard of living, there has been a considerable surge in infrastructural construction in the region in the last few decades. Moreover, the increased focus on modification, renovation, and aesthetic enhancement of homes facilitates the visualization and 3D rendering software market growth in APAC.
The growing adoption of virtual reality and similar trends is anticipated to boost the adoption of high-tech visualization and 3D rendering tools in APAC in the coming years. Owing to a large young population and the increasing affordability of smartphones, the mobile gaming industry has flourished in the region in the last several years. Meanwhile, the region also houses numerous content creators developing designing tools to produce graphically rich content. SMEs in the region are inclined toward using animated content in advertisement applications, which further propels the adoption of visualization and 3D rendering tools.
Asia Pacific Visualization & 3D Rendering Software Market Revenue and Forecast to 2030 (US$ Million)
Asia Pacific Visualization & 3D Rendering Software Market Segmentation
The Asia Pacific visualization & 3D rendering software market is segmented into application, deployment, end user, and country.
Based on application, the Asia Pacific visualization & 3D rendering software market is segmented into training simulation, marketing and advertisement, video games, product visualization, and architectural visualization. The architectural visualization segment held the largest share of the Asia Pacific visualization & 3D rendering software market in 2022.
Based on deployment, the Asia Pacific visualization & 3D rendering software market is segmented into on-premise and cloud. The on-premise segment held a larger share of the Asia Pacific visualization & 3D rendering software market in 2022.
Based on end user, the Asia Pacific visualization & 3D rendering software market is segmented into media and entertainment, architecture and construction, design and engineering, healthcare, and others. The architecture and construction segment held the largest share of the Asia Pacific visualization & 3D rendering software market in 2022.
Based on country, the Asia Pacific visualization & 3D rendering software market is segmented into Australia, China, India, Japan, South Korea, and the Rest of Asia Pacific. China dominated the Asia Pacific visualization & 3D rendering software market in 2022.
Act-3D, Chaos Group, Christie Digital Systems, Dassault Systemes SE, NVIDIA Corp, and Thea Render by Altair are some of the leading companies operating in the Asia Pacific visualization & 3D rendering software market.
Table Of Contents
1. Introduction
- 1.1 The Insight Partners Research Report Guidance
- 1.2 Market Segmentation
2. Executive Summary
- 2.1 Key Insights
- 2.2 Market Attractiveness
3. Research Methodology
- 3.1 Coverage
- 3.2 Secondary Research
- 3.3 Primary Research
4. Asia Pacific Visualization & 3D Rendering Software Market Landscape
- 4.1 Overview
- 4.2 Ecosystem Analysis
- 4.2.1 Service Provider:
- 4.2.2 End-User Industry:
- 4.2.3 List of Vendors in the Value Chain:
- 4.3 Premium Insights
- 4.3.1 In-depth Analysis on Data Formats used in 3D File Formats
- 4.3.1.1 OBJ
- 4.3.1.2 STEP
- 4.3.1.3 COLLADA
- 4.3.1.4 STL
- 4.3.1.5 FBX
- 4.3.1.6 GLTF
- 4.3.1.7 3DS
- 4.3.1.8 IGES
- 4.3.1 In-depth Analysis on Data Formats used in 3D File Formats
5. Asia Pacific Visualization & 3D Rendering Software Market - Key Industry Dynamics
- 5.1 Drivers
- 5.1.1 Increase in Need for Faster and Efficient Solutions
- 5.1.2 Surge in Demand for Gaming and Videography
- 5.1.3 Rise in Construction and Infrastructure Developments
- 5.1.4 Increase in Demand for Realistic Visuals
- 5.2 Market Restraints
- 5.2.1 Lack of Skilled Workforce and Supporting Infrastructure in Developing Countries
- 5.3 Market Opportunities
- 5.3.1 Proliferation of Virtual Reality (VR)
- 5.3.2 Rapid Expansion in Manufacturing Industry and Need for Prototyping
- 5.3.3 Increased Use of Visualization and 3D Rendering Software in Medical and Scientific Research
- 5.4 Future Trends
- 5.4.1 Emergence of Factory Automation
- 5.4.2 Rise in Adoption of Cloud-based Technologies
- 5.5 Impact of Drivers and Restraints:
6. Visualization & 3D Rendering Software Market - Asia Pacific Market Analysis
- 6.1 Asia Pacific Visualization & 3D Rendering Software Market Overview
- 6.2 Asia Pacific Visualization & 3D Rendering Software Market Revenue (US$ Million), 2022 - 2030
- 6.3 Asia Pacific Visualization & 3D Rendering Software Market Forecast and Analysis
7. Asia Pacific Visualization & 3D Rendering Software Market Analysis - Application
- 7.1 Training Simulation
- 7.1.1 Overview
- 7.1.2 Training Simulation: Asia Pacific Visualization & 3D Rendering Software Market Revenue and Forecasts To 2030 (US$ Million)
- 7.2 Marketing and Advertisement
- 7.2.1 Overview
- 7.2.2 Marketing and Advertisement: Asia Pacific Visualization & 3D Rendering Software Market Revenue and Forecasts To 2030 (US$ Million)
- 7.3 Video Games
- 7.3.1 Overview
- 7.3.2 Video Games: Asia Pacific Visualization & 3D Rendering Software Market Revenue and Forecasts To 2030 (US$ Million)
- 7.4 Product Visualization
- 7.4.1 Overview
- 7.4.2 Product Visualization: Asia Pacific Visualization & 3D Rendering Software Market Revenue and Forecasts To 2030 (US$ Million)
- 7.5 Architectural Visualization
- 7.5.1 Overview
- 7.5.2 Architectural Visualization: Asia Pacific Visualization & 3D Rendering Software Market Revenue and Forecasts To 2030 (US$ Million)
8. Asia Pacific Visualization & 3D Rendering Software Market Analysis - Deployment
- 8.1 On-Premise
- 8.1.1 Overview
- 8.1.2 On-Premise: Asia Pacific Visualization & 3D Rendering Software Market Revenue and Forecasts To 2030 (US$ Million)
- 8.2 Cloud
- 8.2.1 Overview
- 8.2.2 Cloud: Asia Pacific Visualization & 3D Rendering Software Market Revenue and Forecasts To 2030 (US$ Million)
9. Asia Pacific Visualization & 3D Rendering Software Market Analysis - End User
- 9.1 Media and Entertainment
- 9.1.1 Overview
- 9.1.2 Media and Entertainment: Asia Pacific Visualization & 3D Rendering Software Market Revenue and Forecasts To 2030 (US$ Million)
- 9.2 Architecture and Construction
- 9.2.1 Overview
- 9.2.2 Architecture and Construction: Asia Pacific Visualization & 3D Rendering Software Market Revenue and Forecasts To 2030 (US$ Million)
- 9.3 Design and Engineering
- 9.3.1 Overview
- 9.3.2 Design and Engineering: Asia Pacific Visualization & 3D Rendering Software Market Revenue and Forecasts To 2030 (US$ Million)
- 9.4 Healthcare
- 9.4.1 Overview
- 9.4.2 Healthcare: Asia Pacific Visualization & 3D Rendering Software Market Revenue and Forecasts To 2030 (US$ Million)
- 9.5 Others
- 9.5.1 Overview
- 9.5.2 Others: Asia Pacific Visualization & 3D Rendering Software Market Revenue and Forecasts To 2030 (US$ Million)
10. Asia Pacific Visualization & 3D Rendering Software Market - Country Analysis
- 10.1 Asia Pacific Visualization & 3D Rendering Software Market
- 10.1.1 Asia Pacific Visualization & 3D rendering software market Breakdown by Countries
- 10.1.1.1 Australia: Asia Pacific Visualization & 3D Rendering Software Market Revenue and Forecasts to 2030 (US$ Mn)
- 10.1.1.1.1 Australia: Asia Pacific Visualization & 3D Rendering Software Market Breakdown by Application
- 10.1.1.1.2 Australia: Asia Pacific Visualization & 3D Rendering Software Market Breakdown by Deployment
- 10.1.1.1.3 Australia: Asia Pacific Visualization & 3D Rendering Software Market Breakdown by End User
- 10.1.1.2 China: Asia Pacific Visualization & 3D Rendering Software Market Revenue and Forecasts to 2030 (US$ Mn)
- 10.1.1.2.1 China: Asia Pacific Visualization & 3D Rendering Software Market Breakdown by Application
- 10.1.1.2.2 China: Asia Pacific Visualization & 3D Rendering Software Market Breakdown by Deployment
- 10.1.1.2.3 China: Asia Pacific Visualization & 3D Rendering Software Market Breakdown by End User
- 10.1.1.3 India: Asia Pacific Visualization & 3D Rendering Software Market Revenue and Forecasts to 2030 (US$ Mn)
- 10.1.1.3.1 India: Asia Pacific Visualization & 3D Rendering Software Market Breakdown by Application
- 10.1.1.3.2 India: Asia Pacific Visualization & 3D Rendering Software Market Breakdown by Deployment
- 10.1.1.3.3 India: Asia Pacific Visualization & 3D Rendering Software Market Breakdown by End User
- 10.1.1.4 Japan: Asia Pacific Visualization & 3D Rendering Software Market Revenue and Forecasts to 2030 (US$ Mn)
- 10.1.1.4.1 Japan: Asia Pacific Visualization & 3D Rendering Software Market Breakdown by Application
- 10.1.1.4.2 Japan: Asia Pacific Visualization & 3D Rendering Software Market Breakdown by Deployment
- 10.1.1.4.3 Japan: Asia Pacific Visualization & 3D Rendering Software Market Breakdown by End User
- 10.1.1.5 South Korea: Asia Pacific Visualization & 3D Rendering Software Market Revenue and Forecasts to 2030 (US$ Mn)
- 10.1.1.5.1 South Korea: Asia Pacific Visualization & 3D Rendering Software Market Breakdown by Application
- 10.1.1.5.2 South Korea: Asia Pacific Visualization & 3D Rendering Software Market Breakdown by Deployment
- 10.1.1.5.3 South Korea: Asia Pacific Visualization & 3D Rendering Software Market Breakdown by End User
- 10.1.1.6 Rest of Asia Pacific: Asia Pacific Visualization & 3D Rendering Software Market Revenue and Forecasts to 2030 (US$ Mn)
- 10.1.1.6.1 Rest of Asia Pacific: Asia Pacific Visualization & 3D Rendering Software Market Breakdown by Application
- 10.1.1.6.2 Rest of Asia Pacific: Asia Pacific Visualization & 3D Rendering Software Market Breakdown by Deployment
- 10.1.1.6.3 Rest of Asia Pacific: Asia Pacific Visualization & 3D Rendering Software Market Breakdown by End User
- 10.1.1.1 Australia: Asia Pacific Visualization & 3D Rendering Software Market Revenue and Forecasts to 2030 (US$ Mn)
- 10.1.1 Asia Pacific Visualization & 3D rendering software market Breakdown by Countries
11. Industry Landscape
- 11.1 Overview
- 11.2 Market Initiative
- 11.3 Product Development
- 11.4 Mergers & Acquisitions
12. Company Profiles
- 12.1 Autodesk Inc
- 12.1.1 Key Facts
- 12.1.2 Business Description
- 12.1.3 Products and Services
- 12.1.4 Financial Overview
- 12.1.5 SWOT Analysis
- 12.1.6 Key Developments
- 12.2 Christie Digital Systems
- 12.2.1 Key Facts
- 12.2.2 Business Description
- 12.2.3 Products and Services
- 12.2.4 Financial Overview
- 12.2.5 SWOT Analysis
- 12.2.6 Key Developments
- 12.3 Dassault Systemes SE
- 12.3.1 Key Facts
- 12.3.2 Business Description
- 12.3.3 Products and Services
- 12.3.4 Financial Overview
- 12.3.5 SWOT Analysis
- 12.3.6 Key Developments
- 12.4 NVIDIA Corp
- 12.4.1 Key Facts
- 12.4.2 Business Description
- 12.4.3 Products and Services
- 12.4.4 Financial Overview
- 12.4.5 SWOT Analysis
- 12.4.6 Key Developments
- 12.5 Chaos Group
- 12.5.1 Key Facts
- 12.5.2 Business Description
- 12.5.3 Products and Services
- 12.5.4 Financial Overview
- 12.5.5 SWOT Analysis
- 12.5.6 Key Developments
- 12.6 Thea Render by Altair
- 12.6.1 Key Facts
- 12.6.2 Business Description
- 12.6.3 Products and Services
- 12.6.4 Financial Overview
- 12.6.5 SWOT Analysis
- 12.6.6 Key Developments
13. Appendix
- 13.1 Word Index

