|
|
市場調査レポート
商品コード
1450852
油汚染浄化材料 - 市場規模と予測、世界および地域のシェア、動向、成長機会分析レポート:タイプ別Oil Pollution Remediation Materials Market Size and Forecasts (2020 - 2030), Global and Regional Share, Trend, and Growth Opportunity Analysis Report Coverage: By Type |
||||||
|
|||||||
|
|||||||

| 油汚染浄化材料 - 市場規模と予測、世界および地域のシェア、動向、成長機会分析レポート:タイプ別 |
|
出版日: 2024年02月16日
発行: The Insight Partners
ページ情報: 英文 195 Pages
納期: 即納可能
|

全表示
- 概要
- 図表
- 目次
油汚染浄化材料の市場規模は2022年に36億8,000万米ドルと評価され、2030年には47億4,000万米ドルに達すると予測され、2022年から2030年までのCAGRは3.2%と推定されます。
油汚染浄化材料は、世界中で行われている様々な石油探査、輸送、産業運営活動による水域の高い汚染リスクを低減するために利用されています。浄化技術は、物理的浄化、化学的浄化、熱的浄化、バイオレメディエーションなどに大別され、海洋油流出問題に取り組む上で極めて重要であると考えられています。物理的浄化は、ブーム、スキマー、吸着材などの資材で構成されます。化学的浄化材には、分散剤や固化剤が含まれます。
油汚染浄化材料市場規模の拡大に寄与する主な要因は、海洋石油探査・輸送活動の活発化と、油流出への備えと対応に関連する政府規制です。過去数年間、各国政府は環境緊急事態への迅速かつ効果的な対応を確保するため、油流出浄化規制を策定してきました。これらの規制は通常、油流出を封じ込め、制御し、浄化するために企業が従わなければならない手順、技術、基準を概説しています。規制は、環境への影響を最小限に抑え、効果的な浄化を確実にするために採用しなければならない浄化資材の種類を規定することが多いです。効果的な油流出浄化に対するニーズの高まりが、浄化資材の需要を後押ししています。環境に対する懸念や規制が強まるにつれ、浄化のために先進的で環境に優しい材料を使用することが重視されるようになっています。特定の吸収剤、分散剤、バリアは、安全性と有効性の基準を満たすことが義務付けられる場合があり、油流出対応作業において環境にやさしく効率的な材料の使用が促進されています。政府および石油業界は、定期的な油流出対応を実施するための準備計画を有しています。油流出に迅速に対処し、生態系への影響を最小限に抑えるという政府の義務付けが、吸収剤、分散剤、その他の修復材料の需要を押し上げています。2023年、米国環境保護庁は、連邦政府の国家非常事態計画(NCP)に基づき、米国海域および隣接する海岸線における油流出対応を改善するための規制を強化しました。この基準には、化学剤や生物剤などの効果的な油濁浄化製品の開発、およびこれらの製品の使用に関連する透明性と情報の提供が含まれます。
油汚染浄化材料市場は、タイプ別に物理的浄化(ブーム、スキマー、吸着材)、化学的浄化(分散剤、固化剤)、熱的浄化、バイオレメディエーションに区分されます。物理的浄化分野が最大の油汚染浄化資材市場シェアを占めています。物理的浄化は一般的に水環境での油流出を制御するために使用されます。水面に残った油を、その性質を変えることなく封じ込め、回収するために使用されます。また、主に流出油の物理的・化学的特性を変えることなく、流出油の拡散を抑制するバリアとして使用されます。物理的浄化法を使用する最も一般的な利点は、油がその特性を保持することです。そのため、将来も精製して使用することができ、廃棄物を減らし、経済的損失を軽減できる可能性があります。物理的浄化プロセスには、ブーム、スキマー、吸着剤が含まれます。
ブームは、油流出を封じ込めるために使用される一時的な浮体バリアです。ブームを使用することで、海岸線やその他の資源を汚染する可能性を低減し、流出油の回収を容易にします。吸収性ブームは、バキューム、スキマー、その他の回収方法をより効率的に使用できるよう、油をより厚い表層に集中させるのに役立ちます。ブームは多くの場合、円形に成形された独立気泡のポリエチレンフォームでできています。スキマーは、水面から流出油を回収するために使用される機械装置です。自走式でコンベアベルトで構成され、リザーバーから流出油を運搬し、処理・回収のために回収します。スキマー技術の中には、流出油の除去に吸引を利用するものもあるが、他のスキマーは重力を利用して、スキミングされた油を水中の貯蔵タンクに集める。スキマーの効率は、海の状況に大きく左右されます。適度に荒れた海や穏やかな海では、スキマーは油よりも水を多く回収する傾向があります。スキマーの効率は、回収される油の種類、浄化作業中の海況、水中の氷や瓦礫の有無によっても決まる。化学的浄化は、油の物理的・化学的性質を変化させ、回収した油の再利用を妨げます。化学的浄化は、流出油の拡散を制限し、海岸線や敏感な海洋生息地を保護するため、海洋流出油浄化の物理的方法と組み合わせて使用されます。油の物理的・化学的性質を変える能力があるため、流出油の処理には様々な化学物質が使用されます。油流出を制御するために使用される化学物質には、分散剤と固化剤が含まれます。
2022年には、中東・アフリカが世界の油汚染浄化材料市場シェアを独占しました。中東・アフリカには主要な原油埋蔵量があり、この地域ではここ数年、原油探査活動が顕著に急増しています。石油探査と生産作業を支援する技術の開発が石油流出リスクを押し上げ、油汚染浄化材料とサービスの需要を押し上げています。このように、技術の開拓は中東・アフリカにおける油汚染浄化材料市場規模の拡大に寄与しています。米国エネルギー情報局によると、中東は5つの主要産油国-サウジアラビア、イラク、UAE、イラン、クウェート-で構成されています。この地域は、世界の石油生産量の27%を占めています。同地域の新興諸国および低開発諸国は、石油・ガス製品の国際貿易レベルを引き上げるために努力しています。
Sarva Bio Remed LLC, Oil Technics Ltd, Ansell Ltd, Oil-Dri Corp of America, Verde Environmental Group Ltd, Ecolab Inc, Cosco Shipping Heavy Industry Co Ltd, Regenesis, TOLSA SA, CL Solutions LLC, Procon Environmental Technologies(Pty)Ltd, Brady Corp, Oil Spill Eater International Corp、Osprey Spill Control、NOV Inc、Fender &Spill Response Services LLC、RX Marine International、Cura Inc、Compania Espanola de Petroleos SA、SkimOIL LLCなどが、この油汚染浄化材料市場レポートで紹介されている著名な企業です。加えて、市場とそのエコシステムの全体像を把握するために、いくつかの他のプレーヤーも調査・分析されています。また、油汚染浄化材料市場調査には、市場で事業展開している競合企業/プレイヤーの業績を評価するための企業のポジショニングと集中も含まれています。
油汚染浄化材料の世界市場全体の規模は、一次情報と二次情報の両方を用いて導き出されたものです。調査プロセスを開始するにあたり、市場に関連する質的・量的情報を入手するため、社内外の情報源を用いて徹底的な二次調査を実施しました。また、データを検証し、トピックに関するより分析的な洞察を得るために、業界関係者に複数の一次インタビューを実施しました。このプロセスの参入企業には、副社長、事業開発マネージャー、マーケットインテリジェンスマネージャー、国内営業マネージャーなどの業界専門家と、油汚染浄化材料市場を専門とする評価専門家、研究アナリスト、キーオピニオンリーダーなどの外部コンサルタントが含まれます。
目次
第1章 イントロダクション
第2章 エグゼクティブサマリー
- 主要洞察
- 市場の魅力
第3章 調査手法
- 調査範囲
- 2次調査
- 1次調査
第4章 油汚染浄化材料の市場情勢
- ポーターのファイブフォース分析
- 供給企業の交渉力
- 買い手の交渉力
- 新規参入業者の脅威
- 競争企業間の敵対関係
- 代替品の脅威
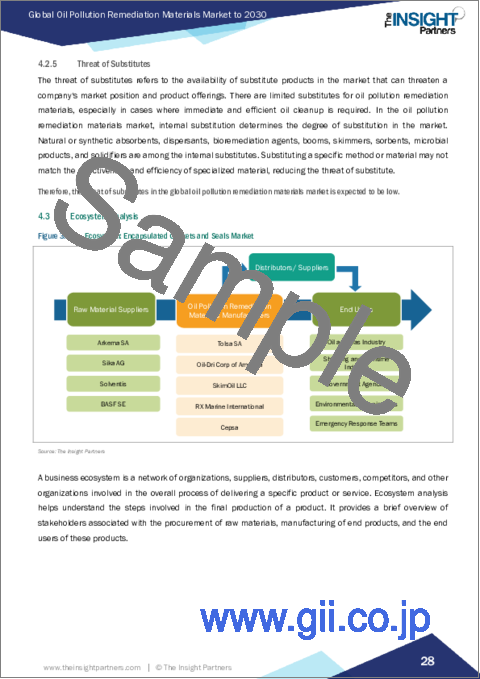
- エコシステム分析
- バリューチェーンのベンダー一覧
第5章 油汚染浄化材料市場:主要市場力学
- 油汚染浄化材料市場- 主な市場力学
- 市場促進要因
- 海洋石油探査および輸送活動の増加
- 油流出への備えと対応に関連する政府規制
- 市場抑制要因
- 物理的および化学的修復の原材料価格の変動
- 市場機会
- 効率的で環境に優しい油汚染修復ソリューションの利用重視の高まり
- 今後の動向
- 新しい油汚染浄化材料料の開発
- 促進要因と抑制要因の影響
第6章 油汚染浄化材料市場:世界市場分析
- 油汚染浄化材料の市場収益、2022-2030年
- 油汚染浄化材料の市場予測分析
第7章 油汚染浄化材料市場分析:タイプ別
- 物理的浄化
- 化学的浄化
- 熱浄化
- バイオレメディエーション
第8章 油汚染浄化材料市場:地域別分析
- 北米
- 米国
- カナダ
- メキシコ
- 欧州
- ドイツ
- フランス
- 英国
- イタリア
- ロシア
- その他欧州
- アジア太平洋
- オーストラリア
- 中国
- インド
- 日本
- 韓国
- APACのその他諸国
- 中東・アフリカ
- 南アフリカ
- サウジアラビア
- アラブ首長国連邦
- その他中東とアフリカ
- 中南米
- ブラジル
- アルゼンチン
- その他中南米
第9章 油汚染浄化材料市場:COVID-19パンデミックの影響
- COVID-19前後の影響
第10章 競合情勢
- 主要プレーヤーによるヒートマップ分析
- 企業のポジショニングと集中度
第11章 業界情勢
- 事業拡大
- パートナーシップ
第12章 企業プロファイル
- Sarva Bio Remed LLC
- Oil Technics Ltd
- Ansell Ltd
- Oil-Dri Corp of America
- Verde Environmental Group Ltd
- Ecolab Inc
- Cosco Shipping Heavy Industry Co Ltd
- Regenesis
- TOLSA SA
- CL Solutions LLC
第13章 付録
List Of Tables
- Table 1. Oil Pollution Remediation Materials Market Segmentation
- Table 2. Oil Pollution Remediation Materials Market - Revenue and Forecast to 2030 (US$ Million)
- Table 3. Oil Pollution Remediation Materials Market - Revenue and Forecast to 2030 (US$ Million) - by Type
- Table 4. North America: Oil Pollution Remediation Materials Market - Revenue and Forecast to 2030(US$ Million) - by Type
- Table 5. North America: Oil Pollution Remediation Materials Market - Revenue and Forecast to 2030(US$ Million) - by Country
- Table 6. US: Oil Pollution Remediation Materials Market - Revenue and Forecast to 2030(US$ Million) - by Type
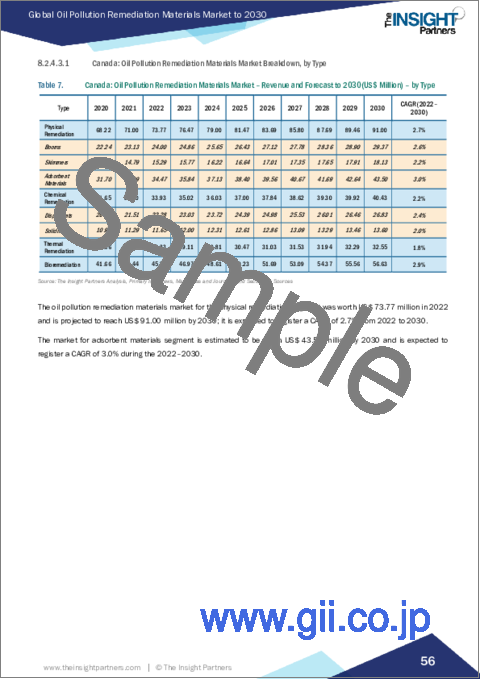
- Table 7. Canada: Oil Pollution Remediation Materials Market - Revenue and Forecast to 2030(US$ Million) - by Type
- Table 8. Mexico: Oil Pollution Remediation Materials Market - Revenue and Forecast to 2030(US$ Million) - by Type
- Table 9. Europe: Oil Pollution Remediation Materials Market - Revenue and Forecast to 2030(US$ Million) - by Type
- Table 10. Europe: Oil Pollution Remediation Materials Market - Revenue and Forecast to 2030(US$ Million) - by Country
- Table 11. Germany: Oil Pollution Remediation Materials Market - Revenue and Forecast to 2030(US$ Million) - by Type
- Table 12. France: Oil Pollution Remediation Materials Market - Revenue and Forecast to 2030(US$ Million) - by Type
- Table 13. UK: Oil Pollution Remediation Materials Market - Revenue and Forecast to 2030(US$ Million) - by Type
- Table 14. Italy: Oil Pollution Remediation Materials Market - Revenue and Forecast to 2030(US$ Million) - by Type
- Table 15. Russia: Oil Pollution Remediation Materials Market - Revenue and Forecast to 2030(US$ Million) - by Type
- Table 16. Rest of Europe: Oil Pollution Remediation Materials Market - Revenue and Forecast to 2030(US$ Million) - by Type
- Table 17. Asia Pacific: Oil Pollution Remediation Materials Market - Revenue and Forecast to 2030(US$ Million) - by Type
- Table 18. Asia Pacific: Oil Pollution Remediation Materials Market - Revenue and Forecast to 2030(US$ Million) - by Country
- Table 19. Australia: Oil Pollution Remediation Materials Market - Revenue and Forecast to 2030(US$ Million) - by Type
- Table 20. China: Oil Pollution Remediation Materials Market - Revenue and Forecast to 2030(US$ Million) - by Type
- Table 21. India: Oil Pollution Remediation Materials Market - Revenue and Forecast to 2030(US$ Million) - by Type
- Table 22. Japan: Oil Pollution Remediation Materials Market - Revenue and Forecast to 2030(US$ Million) - by Type
- Table 23. South Korea: Oil Pollution Remediation Materials Market - Revenue and Forecast to 2030(US$ Million) - by Type
- Table 24. Rest of APAC: Oil Pollution Remediation Materials Market - Revenue and Forecast to 2030(US$ Million) - by Type
- Table 25. Middle East and Africa: Oil Pollution Remediation Materials Market - Revenue and Forecast to 2030(US$ Million) - by Type
- Table 26. Middle East and Africa: Oil Pollution Remediation Materials Market - Revenue and Forecast to 2030(US$ Million) - by Country
- Table 27. South Africa: Oil Pollution Remediation Materials Market - Revenue and Forecast to 2030(US$ Million) - by Type
- Table 28. Saudi Arabia: Oil Pollution Remediation Materials Market - Revenue and Forecast to 2030(US$ Million) - by Type
- Table 29. UAE: Oil Pollution Remediation Materials Market - Revenue and Forecast to 2030(US$ Million) - by Type
- Table 30. Rest of Middle East and Africa: Oil Pollution Remediation Materials Market - Revenue and Forecast to 2030(US$ Million) - by Type
- Table 31. South and Central America: Oil Pollution Remediation Materials Market - Revenue and Forecast to 2030(US$ Million) - by Type
- Table 32. South and Central America: Oil Pollution Remediation Materials Market - Revenue and Forecast to 2030(US$ Million) - by Country
- Table 33. Brazil: Oil Pollution Remediation Materials Market - Revenue and Forecast to 2030(US$ Million) - by Type
- Table 34. Argentina: Oil Pollution Remediation Materials Market - Revenue and Forecast to 2030(US$ Million) - by Type
- Table 35. Rest of South and Central America: Oil Pollution Remediation Materials Market - Revenue and Forecast to 2030(US$ Million) - by Type
List Of Figures
- Figure 1. Oil Pollution Remediation Materials Market Segmentation, by Geography
- Figure 2. Oil Pollution Remediation Materials Market - Porter's Analysis
- Figure 3. Ecosystem: Encapsulated Gaskets and Seals Market
- Figure 4. Crude Oil Production (Million Barrels per Day) in US
- Figure 5. Impact Analysis of Drivers and Restraints
- Figure 6. Oil Pollution Remediation Materials Market Revenue (US$ Million), 2022-2030
- Figure 7. Oil Pollution Remediation Materials Market Share (%) - by Type (2022 and 2030)
- Figure 8. Physical Remediation: Oil Pollution Remediation Materials Market - Revenue and Forecast to 2030 (US$ Million)
- Figure 9. Booms: Oil Pollution Remediation Materials Market - Revenue and Forecast to 2030 (US$ Million)
- Figure 10. Skimmers: Oil Pollution Remediation Materials Market - Revenue and Forecast to 2030 (US$ Million)
- Figure 11. Adsorbent Materials: Oil Pollution Remediation Materials Market - Revenue and Forecast to 2030 (US$ Million)
- Figure 12. Chemical Remediation: Oil Pollution Remediation Materials Market - Revenue and Forecast to 2030 (US$ Million)
- Figure 13. Dispersants: Oil Pollution Remediation Materials Market - Revenue and Forecast to 2030 (US$ Million)
- Figure 14. Solidifiers: Oil Pollution Remediation Materials Market - Revenue and Forecast to 2030 (US$ Million)
- Figure 15. Thermal Remediation: Oil Pollution Remediation Materials Market - Revenue and Forecast to 2030 (US$ Million)
- Figure 16. Bioremediation: Oil Pollution Remediation Materials Market - Revenue and Forecast to 2030 (US$ Million)
- Figure 17. Oil Pollution Remediation Materials Market Breakdown by Region, 2022 and 2030 (%)
- Figure 18. North America: Oil Pollution Remediation Materials Market - Revenue and Forecast to 2030(US$ Million)
- Figure 19. North America: Oil Pollution Remediation Materials Market Breakdown, by Type (2022 and 2030)
- Figure 20. North America: Oil Pollution Remediation Materials Market Breakdown, by Key Countries, 2022 and 2030 (%)
- Figure 21. US: Oil Pollution Remediation Materials Market - Revenue and Forecast to 2030(US$ Million)
- Figure 22. Canada: Oil Pollution Remediation Materials Market - Revenue and Forecast to 2030(US$ Million)
- Figure 23. Mexico: Oil Pollution Remediation Materials Market - Revenue and Forecast to 2030(US$ Million)
- Figure 24. Europe: Oil Pollution Remediation Materials Market - Revenue and Forecast to 2030(US$ Million)
- Figure 25. Europe: Oil Pollution Remediation Materials Market Breakdown, by Type (2022 and 2030)
- Figure 26. Europe: Oil Pollution Remediation Materials Market Breakdown, by Key Countries, 2022 and 2030 (%)
- Figure 27. Germany: Oil Pollution Remediation Materials Market - Revenue and Forecast to 2030(US$ Million)
- Figure 28. France: Oil Pollution Remediation Materials Market - Revenue and Forecast to 2030(US$ Million)
- Figure 29. UK: Oil Pollution Remediation Materials Market - Revenue and Forecast to 2030(US$ Million)
- Figure 30. Italy: Oil Pollution Remediation Materials Market - Revenue and Forecast to 2030(US$ Million)
- Figure 31. Russia: Oil Pollution Remediation Materials Market - Revenue and Forecast to 2030(US$ Million)
- Figure 32. Rest of Europe: Oil Pollution Remediation Materials Market - Revenue and Forecast to 2030(US$ Million)
- Figure 33. Asia Pacific: Oil Pollution Remediation Materials Market - Revenue and Forecast to 2030(US$ Million)
- Figure 34. Asia Pacific: Oil Pollution Remediation Materials Market Breakdown, by Type (2022 and 2030)
- Figure 35. Asia Pacific: Oil Pollution Remediation Materials Market Breakdown, by Key Countries, 2022 and 2030 (%)
- Figure 36. Australia: Oil Pollution Remediation Materials Market - Revenue and Forecast to 2030(US$ Million)
- Figure 37. China: Oil Pollution Remediation Materials Market - Revenue and Forecast to 2030(US$ Million)
- Figure 38. India: Oil Pollution Remediation Materials Market - Revenue and Forecast to 2030(US$ Million)
- Figure 39. Japan: Oil Pollution Remediation Materials Market - Revenue and Forecast to 2030(US$ Million)
- Figure 40. South Korea: Oil Pollution Remediation Materials Market - Revenue and Forecast to 2030(US$ Million)
- Figure 41. Rest of APAC: Oil Pollution Remediation Materials Market - Revenue and Forecast to 2030(US$ Million)
- Figure 42. Middle East and Africa: Oil Pollution Remediation Materials Market - Revenue and Forecast to 2030 (US$ Million)
- Figure 43. Middle East and Africa: Oil Pollution Remediation Materials Market Breakdown, by Type (2022 and 2030)
- Figure 44. Middle East and Africa: Oil Pollution Remediation Materials Market Breakdown, by Key Countries, 2022 and 2030 (%)
- Figure 45. South Africa: Oil Pollution Remediation Materials Market - Revenue and Forecast to 2030(US$ Million)
- Figure 46. Saudi Arabia: Oil Pollution Remediation Materials Market - Revenue and Forecast to 2030(US$ Million)
- Figure 47. UAE: Oil Pollution Remediation Materials Market - Revenue and Forecast to 2030(US$ Million)
- Figure 48. Rest of Middle East and Africa: Oil Pollution Remediation Materials Market - Revenue and Forecast to 2030(US$ Million)
- Figure 49. South and Central America: Oil Pollution Remediation Materials Market - Revenue and Forecast to 2030(US$ Million)
- Figure 50. South and Central America: Oil Pollution Remediation Materials Market Breakdown, by Type (2022 and 2030)
- Figure 51. South and Central America: Oil Pollution Remediation Materials Market Breakdown, by Key Countries, 2022 and 2030 (%)
- Figure 52. Brazil: Oil Pollution Remediation Materials Market - Revenue and Forecast to 2030(US$ Million)
- Figure 53. Argentina: Oil Pollution Remediation Materials Market - Revenue and Forecast to 2030(US$ Million)
- Figure 54. Rest of South and Central America: Oil Pollution Remediation Materials Market - Revenue and Forecast to 2030(US$ Million)
- Figure 55. Heat Map Analysis by Key Players
- Figure 56. Company Positioning & Concentration
The oil pollution remediation materials market size was valued at US$ 3.68 billion in 2022 and is expected to reach US$ 4.74 billion by 2030; it is estimated to register a CAGR of 3.2% from 2022 to 2030.
The oil pollution remediation materials are utilized to reduce the high risk of contamination of water bodies due to various oil exploration, transport, and industrial operational activities that are taking place across the globe. The remediation techniques are majorly classified, such as physical remediation, chemical remediation, thermal remediation, and bioremediation, and are considered extremely important for tackling the problems of marine oil spills. The physical remediation consists of materials such as booms, skimmers, and adsorbent materials. The chemical remediation materials include dispersants and solidifiers.
Major factors contributing to the growing oil pollution remediation materials market size are the rising offshore oil exploration and transportation activities and government regulations related to oil spill preparedness and responses. In the past few years, governments of various countries have designed oil spill cleanup regulations to ensure a prompt and effective response to environmental emergencies. These regulations typically outline procedures, technologies, and standards that companies must follow to contain, control, and clean up oil spills. Regulations often stipulate the type of remediation materials that must be employed to minimize environmental impact and ensure effective cleanup. The rising need for effective oil spill cleanup propels the demand for remediation materials. As environmental concerns and regulations intensify, there is a growing emphasis on using advanced and eco-friendly materials for remediation. Certain absorbents, dispersants, and barriers may be mandated to meet safety and efficacy standards, promoting the use of environment-friendly and efficient materials in oil spill response efforts. Governments and the oil industry have preparedness plans to conduct regular oil spill response. Government mandates to address oil spills promptly, and minimization of ecological impact have driven the demand for absorbents, dispersants, and other remediation materials. In 2023, the US Environmental Protection Agency strengthened regulations to improve oil spill responses in the US waters and adjoining shorelines under the federal government's National Contingency Plan (NCP). The standards include the development of effective oil spill remediation products, such as chemical and biological agents, and the provision of transparency and information related to the use of these products.
Based on type, the oil pollution remediation materials market is segmented into physical remediation (booms, skimmers, and adsorbent materials), chemical remediation (dispersants and solidifiers), thermal remediation, and bioremediation. The physical remediation segment holds the largest oil pollution remediation materials market share. Physical remediation is commonly used to control oil spills in a water environment. It is used to contain and recover oil that remains on the water surface without changing its properties. It is also mainly used as a barrier to control the spreading of oil spills without changing its physical and chemical characteristics. The most common advantage of using physical remediation methods is that oil retains its properties. Therefore, it can still be refined and used in the future, reducing waste and potentially mitigating financial losses. The physical remediation process includes booms, skimmers, and sorbent materials.
A boom is a temporary floating barrier that is used to contain oil spills. The use of booms reduces the possibility of polluting shorelines and other resources and helps make easy spill recovery. Absorbent booms help to concentrate oil in thicker surface layers so that vacuums, skimmers, or other collection methods can be used more efficiently. Booms are often made of closed-cell, polyethylene foam shaped into circular sections. Skimmers are mechanical devices used to recover spilled oil from the water's surface. They may be self-propelled and consist of conveyor belts, which are utilized to carry the spilled oil from the reservoir, which is further collected for processing and recovery. Few skimmer technologies also use suction to remove spilled oil, while other skimmers use gravity to gather skimmed oil into underwater storage tanks. The efficiency of skimmers is highly dependent upon the conditions of the sea. In moderately rough or calm water, skimmers tend to recover more water than oil. The efficiency of skimmers can also be determined by the type of oil being recovered, the sea conditions during cleanup efforts, and the presence of ice or debris in the water. Chemical remediation changes the physical and chemical properties of the oil, preventing the reuse of collected oil. Chemical remediation is used in combination with physical methods for marine oil spill remediation as they restrict the spreading of oil spills and offer protection to the shorelines and sensitive marine habitats. Various chemicals are used to treat oil spills due to their capability to change the physical and chemical properties of oil. Chemicals used to control oil spills include dispersants and solidifiers.
In 2022, the Middle East & Africa dominated the global oil pollution remediation materials market share. The Middle East & Africa is home to major crude oil reserves; the number of crude oil exploration activities has surged notably in this region in the past few years. Developments in technologies that aid in oil exploration and production operations have propelled the risk of oil spills, driving the demand for oil pollution remediation materials and services. Thus, developments in technologies are contributing to the growing oil pollution remediation materials market size in the Middle East & Africa. According to the US Energy Information Administration, the Middle East consists of five leading oil-producing countries-Saudi Arabia, Iraq, the UAE, Iran, and Kuwait. The region accounts for ~27% of the total global production of oil. Developing and low-developed countries in the region are taking strides to raise their international oil & gas products trade levels.
Sarva Bio Remed LLC, Oil Technics Ltd, Ansell Ltd, Oil-Dri Corp of America, Verde Environmental Group Ltd, Ecolab Inc, Cosco Shipping Heavy Industry Co Ltd, Regenesis, TOLSA SA, CL Solutions LLC, Procon Environmental Technologies (Pty) Ltd, Brady Corp, Oil Spill Eater International Corp, Osprey Spill Control, NOV Inc, Fender & Spill Response Services LLC, RX Marine International, Cura Inc, Compania Espanola de Petroleos SA, and SkimOIL LLC are among the prominent players profiled in the oil pollution remediation materials market report. In addition, several other players have been studied and analyzed during the study to get a holistic view of the market and its ecosystem. The oil pollution remediation materials market study also includes company positioning and concentration to evaluate the performance of competitors/players operating in the market.
The overall global oil pollution remediation materials market size has been derived using both primary and secondary sources. To begin the research process, exhaustive secondary research has been conducted using internal and external sources to obtain qualitative and quantitative information related to the market. Also, multiple primary interviews have been conducted with industry participants to validate the data and gain more analytical insights into the topic. Participants in this process include industry experts such as VPs, business development managers, market intelligence managers, and national sales managers, along with external consultants such as valuation experts, research analysts, and key opinion leaders specializing in the oil pollution remediation materials market.
Table Of Contents
1. Introduction
- 1.1 The Insight Partners Research Report Guidance
- 1.2 Market Segmentation
- 1.3 Limitations and Assumptions
2. Executive Summary
- 2.1 Key Insights
- 2.2 Market Attractiveness
3. Research Methodology
- 3.1 Coverage
- 3.2 Secondary Research
- 3.3 Primary Research
4. Oil Pollution Remediation Materials Market Landscape
- 4.1 Overview
- 4.2 Porter's Five Forces Analysis
- 4.2.1 Bargaining Power of Suppliers
- 4.2.2 Bargaining Power of Buyers
- 4.2.3 Threat of New Entrants
- 4.2.4 Intensity of Competitive Rivalry
- 4.2.5 Threat of Substitutes
- 4.3 Ecosystem Analysis
- 4.3.1 List of Vendors in Value Chain
5. Oil Pollution Remediation Materials Market - Key Market Dynamics
- 5.1 Oil Pollution Remediation Materials Market - Key Market Dynamics
- 5.2 Market Drivers
- 5.2.1 Rising Offshore Oil Exploration and Transportation Activities
- 5.2.2 Government Regulations Related to Oil Spill Preparedness and Responses
- 5.3 Market Restraints
- 5.3.1 Fluctuations in Raw Material Prices of Physical and Chemical Remediation
- 5.4 Market Opportunities
- 5.4.1 Growing Emphasis on Utilization of Efficient and Eco-friendly Oil Pollution Remediation Solutions
- 5.5 Future Trends
- 5.5.1 Development of Novel Oil Pollution Remediation Materials
- 5.6 Impact of Drivers and Restraints:
6. Oil Pollution Remediation Materials Market - Global Market Analysis
- 6.1 Oil Pollution Remediation Materials Market Revenue (US$ Million), 2022-2030
- 6.2 Oil Pollution Remediation Materials Market Forecast Analysis
7. Oil Pollution Remediation Materials Market Analysis - by Type
- 7.1 Physical Remediation
- 7.1.1 Overview
- 7.1.2 Physical Remediation: Oil Pollution Remediation Materials Market - Revenue and Forecast to 2030 (US$ Million)
- 7.1.3 Booms
- 7.1.3.1 Overview
- 7.1.3.2 Booms: Oil Pollution Remediation Materials Market - Revenue and Forecast to 2030 (US$ Million)
- 7.1.4 Skimmers
- 7.1.4.1 Overview
- 7.1.4.2 Skimmers: Oil Pollution Remediation Materials Market - Revenue and Forecast to 2030 (US$ Million)
- 7.1.5 Adsorbent Materials
- 7.1.5.1 Overview
- 7.1.5.2 Adsorbent Materials: Oil Pollution Remediation Materials Market - Revenue and Forecast to 2030 (US$ Million)
- 7.2 Chemical Remediation
- 7.2.1 Overview
- 7.2.2 Chemical Remediation: Oil Pollution Remediation Materials Market - Revenue and Forecast to 2030 (US$ Million)
- 7.2.3 Dispersants
- 7.2.3.1 Overview
- 7.2.3.2 Dispersants: Oil Pollution Remediation Materials Market - Revenue and Forecast to 2030 (US$ Million)
- 7.2.4 Solidifiers
- 7.2.4.1 Overview
- 7.2.4.2 Solidifiers: Oil Pollution Remediation Materials Market - Revenue and Forecast to 2030 (US$ Million)
- 7.3 Thermal Remediation
- 7.3.1 Overview
- 7.3.2 Thermal Remediation: Oil Pollution Remediation Materials Market - Revenue and Forecast to 2030 (US$ Million)
- 7.4 Bioremediation
- 7.4.1 Overview
- 7.4.2 Bioremediation: Oil Pollution Remediation Materials Market - Revenue and Forecast to 2030 (US$ Million)
8. Oil Pollution Remediation Materials Market - Geographical Analysis
- 8.1 Overview
- 8.2 North America
- 8.2.1 North America Oil Pollution Remediation Materials Market Overview
- 8.2.2 North America: Oil Pollution Remediation Materials Market - Revenue and Forecast to 2030 (US$ Million)
- 8.2.3 North America: Oil Pollution Remediation Materials Market Breakdown, by Type
- 8.2.3.1 North America: Oil Pollution Remediation Materials Market - Revenue and Forecast Analysis - by Type
- 8.2.4 North America: Oil Pollution Remediation Materials Market - Revenue and Forecast Analysis - by Country
- 8.2.4.1 North America: Oil Pollution Remediation Materials Market - Revenue and Forecast Analysis - by Country
- 8.2.4.2 US: Oil Pollution Remediation Materials Market - Revenue and Forecast to 2030 (US$ Million)
- 8.2.4.2.1 US: Oil Pollution Remediation Materials Market Breakdown, by Type
- 8.2.4.3 Canada: Oil Pollution Remediation Materials Market - Revenue and Forecast to 2030 (US$ Million)
- 8.2.4.3.1 Canada: Oil Pollution Remediation Materials Market Breakdown, by Type
- 8.2.4.4 Mexico: Oil Pollution Remediation Materials Market - Revenue and Forecast to 2030 (US$ Million)
- 8.2.4.4.1 Mexico: Oil Pollution Remediation Materials Market Breakdown, by Type
- 8.3 Europe
- 8.3.1 Europe Oil Pollution Remediation Materials Market Overview
- 8.3.2 Europe: Oil Pollution Remediation Materials Market - Revenue and Forecast to 2030 (US$ Million)
- 8.3.3 Europe: Oil Pollution Remediation Materials Market Breakdown, by Type
- 8.3.3.1 Europe: Oil Pollution Remediation Materials Market - Revenue and Forecast Analysis - by Type
- 8.3.4 Europe: Oil Pollution Remediation Materials Market - Revenue and Forecast Analysis - by Country
- 8.3.4.1 Europe: Oil Pollution Remediation Materials Market - Revenue and Forecast Analysis - by Country
- 8.3.4.2 Germany: Oil Pollution Remediation Materials Market - Revenue and Forecast to 2030 (US$ Million)
- 8.3.4.2.1 Germany: Oil Pollution Remediation Materials Market Breakdown, by Type
- 8.3.4.3 France: Oil Pollution Remediation Materials Market - Revenue and Forecast to 2030 (US$ Million)
- 8.3.4.3.1 France: Oil Pollution Remediation Materials Market Breakdown, by Type
- 8.3.4.4 UK: Oil Pollution Remediation Materials Market - Revenue and Forecast to 2030 (US$ Million)
- 8.3.4.4.1 UK: Oil Pollution Remediation Materials Market Breakdown, by Type
- 8.3.4.5 Italy: Oil Pollution Remediation Materials Market - Revenue and Forecast to 2030 (US$ Million)
- 8.3.4.5.1 Italy: Oil Pollution Remediation Materials Market Breakdown, by Type
- 8.3.4.6 Russia: Oil Pollution Remediation Materials Market - Revenue and Forecast to 2030 (US$ Million)
- 8.3.4.6.1 Russia: Oil Pollution Remediation Materials Market Breakdown, by Type
- 8.3.4.7 Rest of Europe: Oil Pollution Remediation Materials Market - Revenue and Forecast to 2030 (US$ Million)
- 8.3.4.7.1 Rest of Europe: Oil Pollution Remediation Materials Market Breakdown, by Type
- 8.4 Asia Pacific
- 8.4.1 Asia Pacific Oil Pollution Remediation Materials Market Overview
- 8.4.2 Asia Pacific: Oil Pollution Remediation Materials Market - Revenue and Forecast to 2030 (US$ Million)
- 8.4.3 Asia Pacific: Oil Pollution Remediation Materials Market Breakdown, by Type
- 8.4.3.1 Asia Pacific: Oil Pollution Remediation Materials Market - Revenue and Forecast Analysis - by Type
- 8.4.4 Asia Pacific: Oil Pollution Remediation Materials Market - Revenue and Forecast Analysis - by Country
- 8.4.4.1 Asia Pacific: Oil Pollution Remediation Materials Market - Revenue and Forecast Analysis - by Country
- 8.4.4.2 Australia: Oil Pollution Remediation Materials Market - Revenue and Forecast to 2030 (US$ Million)
- 8.4.4.2.1 Australia: Oil Pollution Remediation Materials Market Breakdown, by Type
- 8.4.4.3 China: Oil Pollution Remediation Materials Market - Revenue and Forecast to 2030 (US$ Million)
- 8.4.4.3.1 China: Oil Pollution Remediation Materials Market Breakdown, by Type
- 8.4.4.4 India: Oil Pollution Remediation Materials Market - Revenue and Forecast to 2030 (US$ Million)
- 8.4.4.4.1 India: Oil Pollution Remediation Materials Market Breakdown, by Type
- 8.4.4.5 Japan: Oil Pollution Remediation Materials Market - Revenue and Forecast to 2030 (US$ Million)
- 8.4.4.5.1 Japan: Oil Pollution Remediation Materials Market Breakdown, by Type
- 8.4.4.6 South Korea: Oil Pollution Remediation Materials Market - Revenue and Forecast to 2030 (US$ Million)
- 8.4.4.6.1 South Korea: Oil Pollution Remediation Materials Market Breakdown, by Type
- 8.4.4.7 Rest of APAC: Oil Pollution Remediation Materials Market - Revenue and Forecast to 2030 (US$ Million)
- 8.4.4.7.1 Rest of APAC: Oil Pollution Remediation Materials Market Breakdown, by Type
- 8.5 Middle East and Africa
- 8.5.1 Middle East and Africa Oil Pollution Remediation Materials Market Overview
- 8.5.2 Middle East and Africa: Oil Pollution Remediation Materials Market - Revenue and Forecast to 2030 (US$ Million)
- 8.5.3 Middle East and Africa: Oil Pollution Remediation Materials Market Breakdown, by Type
- 8.5.3.1 Middle East and Africa: Oil Pollution Remediation Materials Market - Revenue and Forecast Analysis - by Type
- 8.5.4 Middle East and Africa: Oil Pollution Remediation Materials Market - Revenue and Forecast Analysis - by Country
- 8.5.4.1 Middle East and Africa: Oil Pollution Remediation Materials Market - Revenue and Forecast Analysis - by Country
- 8.5.4.2 South Africa: Oil Pollution Remediation Materials Market - Revenue and Forecast to 2030 (US$ Million)
- 8.5.4.2.1 South Africa: Oil Pollution Remediation Materials Market Breakdown, by Type
- 8.5.4.3 Saudi Arabia: Oil Pollution Remediation Materials Market - Revenue and Forecast to 2030 (US$ Million)
- 8.5.4.3.1 Saudi Arabia: Oil Pollution Remediation Materials Market Breakdown, by Type
- 8.5.4.4 UAE: Oil Pollution Remediation Materials Market - Revenue and Forecast to 2030 (US$ Million)
- 8.5.4.4.1 UAE: Oil Pollution Remediation Materials Market Breakdown, by Type
- 8.5.4.5 Rest of Middle East and Africa: Oil Pollution Remediation Materials Market - Revenue and Forecast to 2030 (US$ Million)
- 8.5.4.5.1 Rest of Middle East and Africa: Oil Pollution Remediation Materials Market Breakdown, by Type
- 8.6 South and Central America
- 8.6.1 South and Central America Oil Pollution Remediation Materials Market Overview
- 8.6.2 South and Central America: Oil Pollution Remediation Materials Market - Revenue and Forecast to 2030 (US$ Million)
- 8.6.3 South and Central America: Oil Pollution Remediation Materials Market Breakdown, by Type
- 8.6.3.1 South and Central America: Oil Pollution Remediation Materials Market - Revenue and Forecast Analysis - by Type
- 8.6.4 South and Central America: Oil Pollution Remediation Materials Market - Revenue and Forecast Analysis - by Country
- 8.6.4.1 South and Central America: Oil Pollution Remediation Materials Market - Revenue and Forecast Analysis - by Country
- 8.6.4.2 Brazil: Oil Pollution Remediation Materials Market - Revenue and Forecast to 2030 (US$ Million)
- 8.6.4.2.1 Brazil: Oil Pollution Remediation Materials Market Breakdown, by Type
- 8.6.4.3 Argentina: Oil Pollution Remediation Materials Market - Revenue and Forecast to 2030 (US$ Million)
- 8.6.4.3.1 Argentina: Oil Pollution Remediation Materials Market Breakdown, by Type
- 8.6.4.4 Rest of South and Central America: Oil Pollution Remediation Materials Market - Revenue and Forecast to 2030 (US$ Million)
- 8.6.4.4.1 Rest of South and Central America: Oil Pollution Remediation Materials Market Breakdown, by Type
9. Oil Pollution Remediation Materials Market - Impact of COVID-19 Pandemic
- 9.1 Pre & Post COVID-19 Impact
10. Competitive Landscape
- 10.1 Heat Map Analysis by Key Players
- 10.2 Company Positioning & Concentration
11. Industry Landscape
- 11.1 Overview
- 11.2 Expansion
- 11.3 Partnerships
12. Company Profiles
- 12.1 Sarva Bio Remed LLC
- 12.1.1 Key Facts
- 12.1.2 Business Description
- 12.1.3 Products and Services
- 12.1.4 Financial Overview
- 12.1.5 SWOT Analysis
- 12.1.6 Key Developments
- 12.2 Oil Technics Ltd
- 12.2.1 Key Facts
- 12.2.2 Business Description
- 12.2.3 Products and Services
- 12.2.4 Financial Overview
- 12.2.5 SWOT Analysis
- 12.2.6 Key Developments
- 12.3 Ansell Ltd
- 12.3.1 Key Facts
- 12.3.2 Business Description
- 12.3.3 Products and Services
- 12.3.4 Financial Overview
- 12.3.5 SWOT Analysis
- 12.3.6 Key Developments
- 12.4 Oil-Dri Corp of America
- 12.4.1 Key Facts
- 12.4.2 Business Description
- 12.4.3 Products and Services
- 12.4.4 Financial Overview
- 12.4.5 SWOT Analysis
- 12.4.6 Key Developments
- 12.5 Verde Environmental Group Ltd
- 12.5.1 Key Facts
- 12.5.2 Business Description
- 12.5.3 Products and Services
- 12.5.4 Financial Overview
- 12.5.5 SWOT Analysis
- 12.5.6 Key Developments
- 12.6 Ecolab Inc
- 12.6.1 Key Facts
- 12.6.2 Business Description
- 12.6.3 Products and Services
- 12.6.4 Financial Overview
- 12.6.5 SWOT Analysis
- 12.6.6 Key Developments
- 12.7 Cosco Shipping Heavy Industry Co Ltd
- 12.7.1 Key Facts
- 12.7.2 Business Description
- 12.7.3 Products and Services
- 12.7.4 Financial Overview
- 12.7.5 SWOT Analysis
- 12.7.6 Key Developments
- 12.8 Regenesis
- 12.8.1 Key Facts
- 12.8.2 Business Description
- 12.8.3 Products and Services
- 12.8.4 Financial Overview
- 12.8.5 SWOT Analysis
- 12.8.6 Key Developments
- 12.9 TOLSA SA
- 12.9.1 Key Facts
- 12.9.2 Business Description
- 12.9.3 Products and Services
- 12.9.4 Financial Overview
- 12.9.5 SWOT Analysis
- 12.9.6 Key Developments
- 12.10 CL Solutions LLC
- 12.10.1 Key Facts
- 12.10.2 Business Description
- 12.10.3 Products and Services
- 12.10.4 Financial Overview
- 12.10.5 SWOT Analysis
- 12.10.6 Key Developments
13. Appendix
- 13.1 About The Insight Partners

