|
|
市場調査レポート
商品コード
1389686
SLS 3Dプリンティング用プラスチックの市場規模・動向、タイプ別・最終用途産業別の世界・地域シェア、動向、成長機会分析Plastic for SLS 3D Printing Market Size and Forecasts, Global and Regional Share, Trends, and Growth Opportunity Analysis By Type (Polyamide, Thermoplastic Polyurethane, Polyether Ether Ketone, and Others) and End-Use Industry |
||||||
|
|||||||


| SLS 3Dプリンティング用プラスチックの市場規模・動向、タイプ別・最終用途産業別の世界・地域シェア、動向、成長機会分析 |
|
出版日: 2023年11月13日
発行: The Insight Partners
ページ情報: 英文 196 Pages
納期: 即納可能
|

- 全表示
- 概要
- 図表
- 目次
SLS 3Dプリンティング用プラスチックの市場規模は、2022年に1億5,728万米ドルと評価され、2030年には6億4,179万米ドルに達すると予測され、2022年から2030年までのCAGRは19.2%と推定されています。
選択的レーザー焼結(SLS)は、高出力レーザーを用いてポリマー粒子を固体構造に焼結する積層造形技術です。ラピッドプロトタイピングやカスタム製造など、さまざまな用途に使用されます。SLS 3Dプリンティングは、高い機械的特性を持つ複雑な形状の部品の製造にも使用されます。多くの企業が、耐久性、耐熱性、柔軟性などの特性を向上させたSLS対応プラスチック材料の継続的な開発に注力しています。例えば、HP社やBASF社などは、革新的なSLS材料の開発に共同で取り組んでいます。
タイプ別では、SLS 3Dプリンティング用プラスチック市場は、ポリアミド、熱可塑性ポリウレタン、ポリエーテルエーテルケトン、その他に区分されます。熱可塑性ポリウレタンセグメントは、2022年から2030年にかけてSLS 3Dプリンティング用プラスチック市場で最も高いCAGRを記録すると予測されています。SLS 3Dプリンティングでは、熱可塑性ポリウレタン(TPU)は、弾力性や耐摩耗性などいくつかの利点を備えており、ガスケット、シール、クッション部品などの機能的で柔軟な部品の製造に適しています。TPUは-40℃から100℃までの幅広い温度範囲に耐えることができるため、自動車、靴、スポーツ用品などさまざまな産業への適性がさらに高まっています。さらにヘルスケア分野では、TPUを個別化医療ソリューションに活用しています。患者固有の整形外科用インプラント、人工装具、ウェアラブル医療機器は、TPUを使って3Dプリントされ、ぴったりとフィットして快適性が向上し、患者の予後改善につながっています。自動車産業におけるTPUの存在も非常に重要で、サスペンション・ブッシュやフレキシブル・ダクトといった機能的で衝撃を吸収する部品の製造にこの素材が使われています。
アジア太平洋地域は、2022年から2030年にかけてSLS 3Dプリンティング用プラスチックの世界市場で最も速いCAGRを記録すると推定されています。アジア太平洋地域のエレクトロニクス産業の成長と相まって、電動化分野のプロジェクトが増加しており、SLS 3Dプリンティング用プラスチック市場の成長に有利な機会を提供しています。さらに、インドや中国を含むアジア太平洋諸国における自動車販売の増加は、近年のSLS 3Dプリンティング用プラスチック市場の貢献要因となっています。国際自動車工業会(International Organization of Motor Vehicle Manufacturers)の報告書によると、2021年のアジア太平洋地域の自動車生産台数は~4,673万台と推定されています。さらに、同地域の乗用車生産台数は、2020年の3,582万台から2021年には3,815万台に増加しました。アジア太平洋地域には、中国、日本、韓国といった世界最大の製造業経済圏があります。これらの国々は、SLS 3Dプリンティングなどの高度製造技術に多額の投資を行っています。そのため、この地域にはSLS 3Dプリンティングの大手企業が存在し、自動車産業が新興国市場を開拓していることから、予測期間中にSLSプリンティング用プラスチック市場の成長が促進されると予想されます。
世界のSLS 3Dプリンティング用プラスチック市場で事業を展開している企業には、3D Systems Corp、BASF SE、Evonik Industries AG、Arkema SA、Ensinger GmbH、Fiberlab SA、Stratasys Ltd、Sinterit Sp Zoo、EOS Gmb、CRP Service SRLなどがあります。世界のSLS 3Dプリンティング用プラスチック市場で事業を展開する企業は、顧客の需要を満たすために高品質の製品を提供することに注力しています。また、顧客のために高品質な新製品を発売することにも注力しています。
SLS 3Dプリンティング用プラスチックの世界市場全体の規模は、一次情報と二次情報の両方を用いて算出しました。調査プロセスを開始するにあたり、市場に関連する質的・量的情報を入手するため、社内外の情報源を用いて徹底的な二次調査を実施しました。また、データを検証し、トピックに関するより分析的な洞察を得るために、業界関係者との複数の一次インタビューを実施しました。このプロセスの参入企業には、副社長、市場開拓マネージャー、マーケットインテリジェンスマネージャー、国内営業マネージャーなどの業界専門家と、SLS 3Dプリンティング用プラスチック市場を専門とする評価専門家、調査アナリスト、キーオピニオンリーダーなどの外部コンサルタントが含まれます。
目次
第1章 イントロダクション
第2章 エグゼクティブサマリー
- 主要洞察
- 市場の魅力
第3章 調査手法
- 調査範囲
- 2次調査
- 1次調査
第4章 SLS 3Dプリンティング用プラスチックの世界市場情勢
- ポーターのファイブフォース分析
- 買い手の交渉力
- 供給企業の交渉力
- 新規参入業者の脅威
- 代替品の脅威
- 競争企業間の敵対関係の強さ
- エコシステム分析
- 原材料サプライヤー
- メーカー
- ディストリビューター/サプライヤー
- エンドユーザー
第5章 SLS 3Dプリンティング用プラスチックの世界市場:主要市場力学
- 市場促進要因
- SLS適合プラスチック材料の進歩
- 様々な産業における軽量で耐久性のある部品への需要の高まり
- 市場抑制要因
- SLS適合プラスチックの高コスト
- 市場機会
- ヘルスケア産業からのSLS 3Dプリンティング需要の増加
- 今後の動向
- SLS 3Dプリンティングへのリサイクル可能材料の採用
- 影響分析
第6章 SLS 3Dプリンティング用プラスチックの世界市場分析
- SLS 3Dプリンティング用プラスチックの世界市場収益
- SLS 3Dプリンティング用プラスチックの世界市場数量
- SLS 3Dプリンティング用プラスチックの世界市場予測・分析
第7章 SLS 3Dプリンティング用プラスチックの世界市場分析:タイプ別
- ポリアミド
- 熱可塑性ポリウレタン
- ポリエーテルエーテルケトン
- その他
第8章 SLS 3Dプリンティング用プラスチックの世界市場分析:最終用途産業別
- ヘルスケア
- 航空宇宙・防衛
- 自動車
- エレクトロニクス
- その他
第9章 SLS 3Dプリンティング用プラスチックの世界市場:地域別分析
- 北米
- メキシコ
- 欧州
- その他欧州
- アジア太平洋
- その他アジア太平洋地域
- 中東・アフリカ
- その他の地域
- 中南米
- その他南米
第10章 SLS 3Dプリンティング用プラスチックの世界市場に対するCOVID-19流行の影響
- COVID-19前後の影響
第11章 競合情勢
- 主要プレーヤーによるヒートマップ分析
- 企業のポジショニングと集中度
第12章 業界情勢
- 合併と買収
- その他の事業戦略
第13章 企業プロファイル
- 3D Systems Corp
- BASF SE
- Evonik Industries AG
- Arkema SA
- Ensinger GmbH
- Fiberlab SA
- Stratasys Ltd
- Sinterit Sp Zoo
- EOS GmbH
- CRP Service SRL
第14章 付録
List Of Tables
- Table 1. Global Plastics for SLS 3D Printing Market Segmentation
- Table 2. Global Plastics for SLS 3D Printing Market Revenue and Forecasts To 2030 (US$ Million)
- Table 3. Global Plastics for SLS 3D Printing Market Volume and Forecasts To 2030 (Tons)
- Table 4. Global Plastics for SLS 3D Printing Market Revenue and Forecasts To 2030 (US$ Million) - Type
- Table 5. Global Plastics for SLS 3D Printing Market Volume and Forecasts To 2030 (Tons) - Type
- Table 6. Global Plastics for SLS 3D Printing Market Revenue and Forecasts To 2030 (US$ Million) - End-Use Industry
- Table 7. North America Plastics for SLS 3D Printing Market Revenue and Forecasts To 2030 (US$ Million) - By Type
- Table 8. North America Plastics for SLS 3D Printing Market Volume and Forecasts To 2030 (Tons) - By Type
- Table 9. North America Plastics for SLS 3D Printing Market Revenue and Forecasts To 2030 (US$ Million) - By End-Use Industry
- Table 10. US Plastics for SLS 3D Printing Market Revenue and Forecasts To 2030 (US$ Million) - By Type
- Table 11. US Plastics for SLS 3D Printing Market Volume and Forecasts To 2030 (Tons) - By Type
- Table 12. US Plastics for SLS 3D Printing Market Revenue and Forecasts To 2030 (US$ Million) - By End-Use Industry
- Table 13. Canada Plastics for SLS 3D Printing Market Revenue and Forecasts To 2030 (US$ Million) - By Type
- Table 14. Canada Plastics for SLS 3D Printing Market Volume and Forecasts To 2030 (Tons) - By Type
- Table 15. Canada Plastics for SLS 3D Printing Market Revenue and Forecasts To 2030 (US$ Million) - By End-Use Industry
- Table 16. Mexico Plastics for SLS 3D Printing Market Revenue and Forecasts To 2030 (US$ Million) - By Type
- Table 17. Mexico Plastics for SLS 3D Printing Market Volume and Forecasts To 2030 (Tons) - By Type
- Table 18. Mexico Plastics for SLS 3D Printing Market Revenue and Forecasts To 2030 (US$ Million) - By End-Use Industry
- Table 19. Europe Plastics for SLS 3D Printing Market Revenue and Forecasts To 2030 (US$ Million) - By Type
- Table 20. Europe Plastics for SLS 3D Printing Market Volume and Forecasts To 2030 (Tons) - By Type
- Table 21. Europe Plastics for SLS 3D Printing Market Revenue and Forecasts To 2030 (US$ Million) - By End-Use Industry
- Table 22. Germany Plastics for SLS 3D Printing Market Revenue and Forecasts To 2030 (US$ Million) - By Type
- Table 23. Germany Plastics for SLS 3D Printing Market Volume and Forecasts To 2030 (Tons) - By Type
- Table 24. Germany Plastics for SLS 3D Printing Market Revenue and Forecasts To 2030 (US$ Million) - By End-Use Industry
- Table 25. France Plastics for SLS 3D Printing Market Revenue and Forecasts To 2030 (US$ Million) - By Type
- Table 26. France Plastics for SLS 3D Printing Market Volume and Forecasts To 2030 (Tons) - By Type
- Table 27. France Plastics for SLS 3D Printing Market Revenue and Forecasts To 2030 (US$ Million) - By End-Use Industry
- Table 28. Italy Plastics for SLS 3D Printing Market Revenue and Forecasts To 2030 (US$ Million) - By Type
- Table 29. Italy Plastics for SLS 3D Printing Market Volume and Forecasts To 2030 (Tons) - By Type
- Table 30. Italy Plastics for SLS 3D Printing Market Revenue and Forecasts To 2030 (US$ Million) - By End-Use Industry
- Table 31. UK Plastics for SLS 3D Printing Market Revenue and Forecasts To 2030 (US$ Million) - By Type
- Table 32. UK Plastics for SLS 3D Printing Market Volume and Forecasts To 2030 (Tons) - By Type
- Table 33. UK Plastics for SLS 3D Printing Market Revenue and Forecasts To 2030 (US$ Million) - By End-Use Industry
- Table 34. Russia Plastics for SLS 3D Printing Market Revenue and Forecasts To 2030 (US$ Million) - By Type
- Table 35. Russia Plastics for SLS 3D Printing Market Volume and Forecasts To 2030 (Tons) - By Type
- Table 36. Russia Plastics for SLS 3D Printing Market Revenue and Forecasts To 2030 (US$ Million) - By End-Use Industry
- Table 37. Rest of Europe Plastics for SLS 3D Printing Market Revenue and Forecasts To 2030 (US$ Million) - By Type
- Table 38. Rest of Europe Plastics for SLS 3D Printing Market Volume and Forecasts To 2030 (Tons) - By Type
- Table 39. Rest of Europe Plastics for SLS 3D Printing Market Revenue and Forecasts To 2030 (US$ Million) - By End-Use Industry
- Table 40. Asia Pacific Plastics for SLS 3D Printing Market Revenue and Forecasts To 2030 (US$ Million) - Type
- Table 41. Asia Pacific Plastics for SLS 3D Printing Market Volume and Forecasts To 2030 (Tons) - Type
- Table 42. Asia Pacific Plastics for SLS 3D Printing Market Revenue and Forecasts To 2030 (US$ Million) - End-Use Industry
- Table 43. Australia Plastics for SLS 3D Printing Market Revenue and Forecasts To 2030 (US$ Million) - By Type
- Table 44. Australia Plastics for SLS 3D Printing Market Volume and Forecasts To 2030 (Tons) - By Type
- Table 45. Australia Plastics for SLS 3D Printing Market Revenue and Forecasts To 2030 (US$ Million) - By End-Use Industry
- Table 46. China Plastics for SLS 3D Printing Market Revenue and Forecasts To 2030 (US$ Million) - By Type
- Table 47. China Plastics for SLS 3D Printing Market Volume and Forecasts To 2030 (Tons) - By Type
- Table 48. China Plastics for SLS 3D Printing Market Revenue and Forecasts To 2030 (US$ Million) - By End-Use Industry
- Table 49. India Plastics for SLS 3D Printing Market Revenue and Forecasts To 2030 (US$ Million) - By Type
- Table 50. India Plastics for SLS 3D Printing Market Volume and Forecasts To 2030 (Tons) - By Type
- Table 51. India Plastics for SLS 3D Printing Market Revenue and Forecasts To 2030 (US$ Million) - By End-Use Industry
- Table 52. Japan Plastics for SLS 3D Printing Market Revenue and Forecasts To 2030 (US$ Million) - By Type
- Table 53. Japan Plastics for SLS 3D Printing Market Volume and Forecasts To 2030 (Tons) - By Type
- Table 54. Japan Plastics for SLS 3D Printing Market Revenue and Forecasts To 2030 (US$ Million) - By End-Use Industry
- Table 55. South Korea Plastics for SLS 3D Printing Market Revenue and Forecasts To 2030 (US$ Million) - By Type
- Table 56. South Korea Plastics for SLS 3D Printing Market Volume and Forecasts To 2030 (Tons) - By Type
- Table 57. South Korea Plastics for SLS 3D Printing Market Revenue and Forecasts To 2030 (US$ Million) - By End-Use Industry
- Table 58. Rest of Asia Pacific Plastics for SLS 3D Printing Market Revenue and Forecasts To 2030 (US$ Million) - By Type
- Table 59. Rest of Asia Pacific Plastics for SLS 3D Printing Market Volume and Forecasts To 2030 (Tons) - By Type
- Table 60. Rest of Asia Pacific Plastics for SLS 3D Printing Market Revenue and Forecasts To 2030 (US$ Million) - By End-Use Industry
- Table 61. Middle East and Africa Plastics for SLS 3D Printing Market Revenue and Forecasts To 2030 (US$ Million) - By Type
- Table 62. Middle East and Africa Plastics for SLS 3D Printing Market Volume and Forecasts To 2030 (Tons) - By Type
- Table 63. Middle East and Africa Plastics for SLS 3D Printing Market Revenue and Forecasts To 2030 (US$ Million) - By End-Use Industry
- Table 64. South Africa Plastics for SLS 3D Printing Market Revenue and Forecasts To 2030 (US$ Million) - By Type
- Table 65. South Africa Plastics for SLS 3D Printing Market Volume and Forecasts To 2030 (Tons) - By Type
- Table 66. South Africa Plastics for SLS 3D Printing Market Revenue and Forecasts To 2030 (US$ Million) - By End-Use Industry
- Table 67. Saudi Arabia Plastics for SLS 3D Printing Market Revenue and Forecasts To 2030 (US$ Million) - By Type
- Table 68. Saudi Arabia Plastics for SLS 3D Printing Market Volume and Forecasts To 2030 (Tons) - By Type
- Table 69. Saudi Arabia Plastics for SLS 3D Printing Market Revenue and Forecasts To 2030 (US$ Million) - By End-Use Industry
- Table 70. UAE Plastics for SLS 3D Printing Market Revenue and Forecasts To 2030 (US$ Million) - By Type
- Table 71. UAE Plastics for SLS 3D Printing Market Volume and Forecasts To 2030 (Tons) - By Type
- Table 72. UAE Plastics for SLS 3D Printing Market Revenue and Forecasts To 2030 (US$ Million) - By End-Use Industry
- Table 73. Turkey Plastics for SLS 3D Printing Market Revenue and Forecasts To 2030 (US$ Million) - By Type
- Table 74. Turkey Plastics for SLS 3D Printing Market Volume and Forecasts To 2030 (Tons) - By Type
- Table 75. Turkey Plastics for SLS 3D Printing Market Revenue and Forecasts To 2030 (US$ Million) - By End-Use Industry
- Table 76. Rest of MEA Plastics for SLS 3D Printing Market Revenue and Forecasts To 2030 (US$ Million) - By Type
- Table 77. Rest of MEA Plastics for SLS 3D Printing Market Volume and Forecasts To 2030 (Tons) - By Type
- Table 78. Rest of MEA Plastics for SLS 3D Printing Market Revenue and Forecasts To 2030 (US$ Million) - By End-Use Industry
- Table 79. South and Central America Plastics for SLS 3D Printing Market Revenue and Forecasts To 2030 (US$ Million) - By Type
- Table 80. South and Central America Plastics for SLS 3D Printing Market Volume and Forecasts To 2030 (Tons) - By Type
- Table 81. South and Central America Plastics for SLS 3D Printing Market Revenue and Forecasts To 2030 (US$ Million) - By End-Use Industry
- Table 82. Brazil Plastics for SLS 3D Printing Market Revenue and Forecasts To 2030 (US$ Million) - By Type
- Table 83. Brazil Plastics for SLS 3D Printing Market Volume and Forecasts To 2030 (Tons) - By Type
- Table 84. Brazil Plastics for SLS 3D Printing Market Revenue and Forecasts To 2030 (US$ Million) - By End-Use Industry
- Table 85. Argentina Plastics for SLS 3D Printing Market Revenue and Forecasts To 2030 (US$ Million) - By Type
- Table 86. Argentina Plastics for SLS 3D Printing Market Volume and Forecasts To 2030 (Tons) - By Type
- Table 87. Argentina Plastics for SLS 3D Printing Market Revenue and Forecasts To 2030 (US$ Million) - By End-Use Industry
- Table 88. Rest of SAM Plastics for SLS 3D Printing Market Revenue and Forecasts To 2030 (US$ Million) - By Type
- Table 89. Rest of SAM Plastics for SLS 3D Printing Market Volume and Forecasts To 2030 (Tons) - By Type
- Table 90. Rest of SAM Plastics for SLS 3D Printing Market Revenue and Forecasts To 2030 (US$ Million) - By End-Use Industry
List Of Figures
- Figure 1. Global Plastics for SLS 3D Printing Market Segmentation, By Country
- Figure 2. Porter's Five Forces Analysis
- Figure 3. Ecosystem: Global Plastic for SLS 3D Printing Market
- Figure 4. Market Dynamics: Global Plastic for SLS 3D Printing Market
- Figure 5. Global Plastic for SLS 3D Printing Market Impact Analysis of Drivers and Restraints
- Figure 6. Global Plastics for SLS 3D Printing Market Revenue (US$ Million), 2020 - 2030
- Figure 7. Global Plastics for SLS 3D Printing Market Volume (Tons), 2020 - 2030
- Figure 8. Global Plastics for SLS 3D Printing Market Share (%) - Type, 2022 and 2030
- Figure 9. Polyamide Market Revenue and Forecasts To 2030 (US$ Million)
- Figure 10. Polyamide Market Volume and Forecasts To 2030 (Tons)
- Figure 11. PA11 Market Revenue and Forecasts To 2030 (US$ Million)
- Figure 12. PA11 Market Volume and Forecasts To 2030 (Tons)
- Figure 13. PA12 Market Revenue and Forecasts To 2030 (US$ Million)
- Figure 14. PA12 Market Volume and Forecasts To 2030 (Tons)
- Figure 15. Thermoplastic Polyurethane Market Revenue and Forecasts To 2030 (US$ Million)
- Figure 16. Thermoplastic Polyurethane Market Volume and Forecasts To 2030 (Tons)
- Figure 17. Polyether Ether Ketone Market Revenue and Forecasts To 2030 (US$ Million)
- Figure 18. Polyether Ether Ketone Market Volume and Forecasts To 2030 (Tons)
- Figure 19. Others Market Revenue and Forecasts To 2030 (US$ Million)
- Figure 20. Others Market Volume and Forecasts To 2030 (Tons)
- Figure 21. Global Plastics for SLS 3D Printing Market Share (%) - End-Use Industry, 2022 and 2030
- Figure 22. Healthcare Market Revenue and Forecasts To 2030 (US$ Million)
- Figure 23. Aerospace and Defense Market Revenue and Forecasts To 2030 (US$ Million)
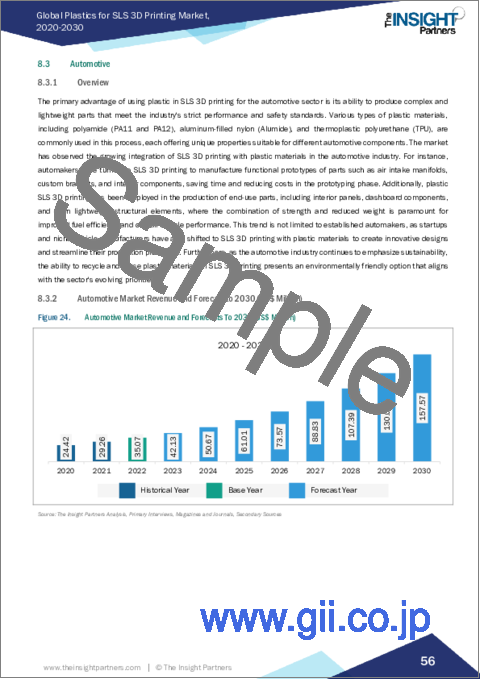
- Figure 24. Automotive Market Revenue and Forecasts To 2030 (US$ Million)
- Figure 25. Electronics Market Revenue and Forecasts To 2030 (US$ Million)
- Figure 26. Others Market Revenue and Forecasts To 2030 (US$ Million)
- Figure 27. Global Plastics for SLS 3D Printing Market Breakdown by Geography, 2022 and 2030
- Figure 28. North America Plastics for SLS 3D Printing Market Revenue and Forecasts To 2030 (US$ Million)
- Figure 29. North America Plastics for SLS 3D Printing Market Volume and Forecasts To 2030 (Tons)
- Figure 30. North America Plastics for SLS 3D Printing Market Breakdown by Type (2022 and 2030)
- Figure 31. North America Plastics for SLS 3D Printing Market Breakdown by End-Use Industry (2022 and 2030)
- Figure 32. North America Plastics for SLS 3D Printing Market Breakdown by Key Countries, 2022 and 2030 (%)
- Figure 33. US Plastics for SLS 3D Printing Market Revenue and Forecasts To 2030 (US$ Million)
- Figure 34. US Plastics for SLS 3D Printing Market Volume and Forecasts To 2030 (Tons)
- Figure 35. Canada Plastics for SLS 3D Printing Market Revenue and Forecasts To 2030 (US$ Million)
- Figure 36. Canada Plastics for SLS 3D Printing Market Volume and Forecasts To 2030 (Tons)
- Figure 37. Mexico Plastics for SLS 3D Printing Market Revenue and Forecasts To 2030 (US$ Million)
- Figure 38. Mexico Plastics for SLS 3D Printing Market Volume and Forecasts To 2030 (Tons)
- Figure 39. Europe Plastics for SLS 3D Printing Market Revenue and Forecasts To 2030 (US$ Million)
- Figure 40. Europe Plastics for SLS 3D Printing Market Volume and Forecasts To 2030 (Tons)
- Figure 41. Europe Plastics for SLS 3D Printing Market Breakdown by Type (2022 and 2030)
- Figure 42. Europe Plastics for SLS 3D Printing Market Breakdown by End-Use Industry (2022 and 2030)
- Figure 43. Europe Plastics for SLS 3D Printing Market Breakdown by Key Countries, 2022 and 2030 (%)
- Figure 44. Germany Plastics for SLS 3D Printing Market Revenue and Forecasts To 2030 (US$ Million)
- Figure 45. Germany Plastics for SLS 3D Printing Market Volume and Forecasts To 2030 (Tons)
- Figure 46. France Plastics for SLS 3D Printing Market Revenue and Forecasts To 2030 (US$ Million)
- Figure 47. France Plastics for SLS 3D Printing Market Volume and Forecasts To 2030 (Tons)
- Figure 48. Italy Plastics for SLS 3D Printing Market Revenue and Forecasts To 2030 (US$ Million)
- Figure 49. Italy Plastics for SLS 3D Printing Market Volume and Forecasts To 2030 (Tons)
- Figure 50. UK Plastics for SLS 3D Printing Market Revenue and Forecasts To 2030 (US$ Million)
- Figure 51. UK Plastics for SLS 3D Printing Market Volume and Forecasts To 2030 (Tons)
- Figure 52. Russia Plastics for SLS 3D Printing Market Revenue and Forecasts To 2030 (US$ Million)
- Figure 53. Russia Plastics for SLS 3D Printing Market Volume and Forecasts To 2030 (Tons)
- Figure 54. Rest of Europe Plastics for SLS 3D Printing Market Revenue and Forecasts To 2030 (US$ Million)
- Figure 55. Rest of Europe Plastics for SLS 3D Printing Market Volume and Forecasts To 2030 (Tons)
- Figure 56. Asia Pacific Plastics for SLS 3D Printing Market Revenue and Forecasts To 2030 (US$ Million)
- Figure 57. Asia Pacific Plastics for SLS 3D Printing Market Volume and Forecasts To 2030 (Tons)
- Figure 58. Asia Pacific Plastics for SLS 3D Printing Market Breakdown by Type (2022 and 2030)
- Figure 59. Asia Pacific Plastics for SLS 3D Printing Market Breakdown by End-Use Industry (2022 and 2030)
- Figure 60. Asia Pacific Plastics for SLS 3D Printing Market Breakdown By Key Countries, 2022 And 2030 (%)
- Figure 61. Australia Plastics for SLS 3D Printing Market Revenue and Forecasts To 2030 (US$ Million)
- Figure 62. Australia Plastics for SLS 3D Printing Market Volume and Forecasts To 2030 (Tons)
- Figure 63. China Plastics for SLS 3D Printing Market Revenue and Forecasts To 2030 (US$ Million)
- Figure 64. China Plastics for SLS 3D Printing Market Volume and Forecasts To 2030 (Tons)
- Figure 65. India Plastics for SLS 3D Printing Market Revenue and Forecasts To 2030 (US$ Million)
- Figure 66. India Plastics for SLS 3D Printing Market Volume and Forecasts To 2030 (Tons)
- Figure 67. Japan Plastics for SLS 3D Printing Market Revenue and Forecasts To 2030 (US$ Million)
- Figure 68. Japan Plastics for SLS 3D Printing Market Volume and Forecasts To 2030 (Tons)
- Figure 69. South Korea Plastics for SLS 3D Printing Market Revenue and Forecasts To 2030 (US$ Million)
- Figure 70. South Korea Plastics for SLS 3D Printing Market Volume and Forecasts To 2030 (Tons)
- Figure 71. Rest of Asia Pacific Plastics for SLS 3D Printing Market Revenue and Forecasts To 2030 (US$ Million)
- Figure 72. Rest of Asia Pacific Plastics for SLS 3D Printing Market Volume and Forecasts To 2030 (Tons)
- Figure 73. Middle East and Africa Plastics for SLS 3D Printing Market Revenue and Forecasts To 2030 (US$ Million)
- Figure 74. Middle East and Africa Plastics for SLS 3D Printing Market Volume and Forecasts To 2030 (Tons)
- Figure 75. Middle East and Africa Plastics for SLS 3D Printing Market Breakdown by Type (2022 and 2030)
- Figure 76. Middle East and Africa Plastics for SLS 3D Printing Market Breakdown by End-Use Industry (2022 and 2030)
- Figure 77. Middle East and Africa Plastics for SLS 3D Printing Market Breakdown by Key Countries, 2022 and 2030 (%)
- Figure 78. South Africa Plastics for SLS 3D Printing Market Revenue and Forecasts To 2030 (US$ Million)
- Figure 79. South Africa Plastics for SLS 3D Printing Market Volume and Forecasts To 2030 (Tons)
- Figure 80. Saudi Arabia Plastics for SLS 3D Printing Market Revenue and Forecasts To 2030 (US$ Million)
- Figure 81. Saudi Arabia Plastics for SLS 3D Printing Market Volume and Forecasts To 2030 (Tons)
- Figure 82. UAE Plastics for SLS 3D Printing Market Revenue and Forecasts To 2030 (US$ Million)
- Figure 83. UAE Plastics for SLS 3D Printing Market Volume and Forecasts To 2030 (Tons)
- Figure 84. Turkey Plastics for SLS 3D Printing Market Revenue and Forecasts To 2030 (US$ Million)
- Figure 85. Turkey Plastics for SLS 3D Printing Market Volume and Forecasts To 2030 (Tons)
- Figure 86. Rest of MEA Plastics for SLS 3D Printing Market Revenue and Forecasts To 2030 (US$ Million)
- Figure 87. Rest of MEA Plastics for SLS 3D Printing Market Volume and Forecasts To 2030 (Tons)
- Figure 88. South and Central America Plastics for SLS 3D Printing Market Revenue and Forecasts To 2030 (US$ Million)
- Figure 89. South and Central America Plastics for SLS 3D Printing Market Volume and Forecasts To 2030 (Tons)
- Figure 90. South and Central America Plastics for SLS 3D Printing Market Breakdown by Type (2022 and 2030)
- Figure 91. South and Central America Plastics for SLS 3D Printing Market Breakdown by End-Use Industry (2022 and 2030)
- Figure 92. South and Central America Plastics for SLS 3D Printing Market Breakdown by Key Countries, 2022 and 2030 (%)
- Figure 93. Brazil Plastics for SLS 3D Printing Market Revenue and Forecasts To 2030 (US$ Million)
- Figure 94. Brazil Plastics for SLS 3D Printing Market Volume and Forecasts To 2030 (Tons)
- Figure 95. Argentina Plastics for SLS 3D Printing Market Revenue and Forecasts To 2030 (US$ Million)
- Figure 96. Argentina Plastics for SLS 3D Printing Market Volume and Forecasts To 2030 (Tons)
- Figure 97. Rest of SAM Plastics for SLS 3D Printing Market Revenue and Forecasts To 2030 (US$ Million)
- Figure 98. Rest of SAM Plastics for SLS 3D Printing Market Volume and Forecasts To 2030 (Tons)
- Figure 99. Heat Map Analysis by Key Players
- Figure 100. Company Positioning & Concentration
The plastic for SLS 3D printing market size was valued at US$ 157.28 million in 2022 and is expected to reach US$ 641.79 million by 2030; it is estimated to register a CAGR of 19.2% from 2022 to 2030.
Selective Laser Sintering (SLS) is an additive manufacturing technology that involves sintering of polymer particles into solid structure using high-power laser. It is used for various applications such as rapid prototyping, and custom manufacturing. SLS 3D printing is also used for manufacturing of complex geometrical components with high mechanical properties. Many companies are focused on the continuous development of SLS-compatible plastic materials with improved properties, such as durability, heat resistance, and flexibility. For instance, companies such as HP and BASF have been collaborating to develop innovative SLS materials.
In terms of type, the plastic for SLS 3D printing market is segmented into polyamide, thermoplastic polyurethane, polyether ether ketone, and others. The thermoplastic polyurethane segment is expected to register highest CAGR in the plastic for SLS 3D printing market from 2022 to 2030. In the SLS 3D printing, thermoplastic polyurethane (TPU) offers several advantages, such as elasticity and resistance to abrasion, making it preferable for producing functional, flexible parts such as gaskets, seals, and cushioning components. TPU's capacity to withstand a broad temperature range, from -40°C to 100°C, further enhances its suitability for various industries, including automotive, footwear, and sports equipment. Furthermore, the healthcare sector has harnessed TPU for personalized medical solutions. Patient-specific orthopedic implants, prosthetics, and wearable medical devices are being 3D printed using TPU to ensure a snug fit and enhanced comfort, leading to improved patient outcomes. TPU's presence in the automotive industry is also very crucial, with the material being used to produce functional, shock-absorbing components such as suspension bushings and flexible ducts.
Asia Pacific is estimated to register the fastest CAGR in the global plastic for SLS 3D printing market from 2022 to 2030. The increasing projects in the field of electrification, coupled with the growth of the electronics industry in the Asia Pacific, provide lucrative opportunities for the plastic for SLS 3D printing market growth. Moreover, the rising automobile sales in the Asia Pacific countries, including India and China, has been contributing factors for the plastic for SLS 3D printing market in recent years. As per the International Organization of Motor Vehicle Manufacturers report, in 2021, motor vehicle production in Asia Pacific was estimated to be ~46.73 million units. Furthermore, passenger car production in the region increased from 35.82 million in 2020 to 38.15 million in 2021. Asia Pacific is home to some of the world's largest manufacturing economies, such as China, Japan, and South Korea. These countries are investing heavily in advanced manufacturing technologies such as SLS 3D printing. Therefore, the presence of major SLS 3D printing companies and the developing automotive industry in the region are expected to boost the growth of the plastics for SLS printing market during the forecast period.
A few players operating in the global plastic for SLS 3D printing market include 3D Systems Corp, BASF SE, Evonik Industries AG, Arkema SA, Ensinger GmbH, Fiberlab SA, Stratasys Ltd, Sinterit Sp Zoo, EOS Gmb, and CRP Service SRL. Players operating in the global plastic for SLS 3D printing market focus on providing high-quality products to fulfill customer demand. Also, they are focusing on launching new and high-quality products for their customers.
The overall global plastic for SLS 3D printing market size has been derived using both primary and secondary sources. To begin the research process, exhaustive secondary research has been conducted using internal and external sources to obtain qualitative and quantitative information related to the market. Also, multiple primary interviews have been conducted with industry participants to validate the data and gain more analytical insights into the topic. The participants of this process include industry experts such as VPs, business development managers, market intelligence managers, and national sales managers-along with external consultants such as valuation experts, research analysts, and key opinion leaders-specializing in the plastic for SLS 3D printing market.
Reasons to Buy:
- Save and reduce time carrying out entry-level research by identifying the growth, size, leading players, and segments in the global plastic for SLS 3D printing market
- Highlights key business priorities in order to assist companies to realign their business strategies
- The key findings and recommendations highlight crucial progressive industry trends in the global plastic for SLS 3D printing market, thereby allowing players across the value chain to develop effective long-term strategies
- Develop/modify business expansion plans by using substantial growth offering developed and emerging markets
- Scrutinize in-depth global market trends and outlook coupled with the factors driving the plastic for SLS 3D printing market as well as those hindering it.
- Enhance the decision-making process by understanding the strategies that underpin commercial interest with respect to client products, segmentation, pricing, and distribution
Table Of Contents
1. Introduction
- 1.1 The Insight Partners Research Report Guidance
- 1.2 Market Segmentation
2. Executive Summary
- 2.1 Key Insights
- 2.2 Market Attractiveness
3. Research Methodology
- 3.1 Coverage
- 3.2 Secondary Research
- 3.3 Primary Research
4. Global Plastics for SLS 3D Printing Market Landscape
- 4.1 Overview
- 4.2 Porter's Five Forces Analysis
- 4.2.1 Bargaining Power of Buyers
- 4.2.2 Bargaining Power of Suppliers
- 4.2.3 Threat of New Entrants
- 4.2.4 Threat of Substitutes
- 4.2.5 Intensity of Competitive Rivalry
- 4.3 Ecosystem Analysis
- 4.3.1 Raw Material Suppliers:
- 4.3.2 Manufacturers:
- 4.3.3 Distributors/Suppliers:
- 4.3.4 End Users:
5. Global Plastics for SLS 3D Printing Market - Key Market Dynamics
- 5.1 Market Drivers
- 5.1.1 Advancements in SLS-Compatible Plastic Materials
- 5.1.2 Growing Demand for Lightweight and Durable Parts in Various Industries
- 5.2 Market Restraints
- 5.2.1 High Cost of SLS-Compatible Plastics
- 5.3 Market Opportunity
- 5.3.1 Increasing Demand for SLS 3D Printing from the Healthcare Industry
- 5.4 Future Trend
- 5.4.1 Adoption of Recyclable Materials for SLS 3D Printing
- 5.5 Impact Analysis
6. Plastics for SLS 3D Printing Market - Global Market Analysis
- 6.1 Global Plastics for SLS 3D Printing Market Revenue (US$ Million)
- 6.2 Global Plastics for SLS 3D Printing Market Volume (Tons)
- 6.3 Global Plastics for SLS 3D Printing Market Forecast and Analysis
7. Global Plastics for SLS 3D Printing Market Analysis - Type
- 7.1 Polyamide
- 7.1.1 Overview
- 7.1.2 Polyamide Market Revenue and Forecast to 2030 (US$ Million)
- 7.1.3 Polyamide Market Volume and Forecast to 2030 (Tons)
- 7.1.3.1 PA11
- 7.1.3.1.1 PA11: Plastics for SLS 3D Printing Market - Revenue and Forecast to 2028 (US$ Million)
- 7.1.3.1.2 PA11: Plastics for SLS 3D Printing Market - Volume and Forecast to 2028 (Tons)
- 7.1.3.2 PA12
- 7.1.3.2.1 PA12: Plastics for SLS 3D Printing Market - Revenue and Forecast to 2028 (US$ Million)
- 7.1.3.2.2 PA12: Plastics for SLS 3D Printing Market - Volume and Forecast to 2028 (Tons)
- 7.1.3.1 PA11
- 7.2 Thermoplastic Polyurethane
- 7.2.1 Overview
- 7.2.2 Thermoplastic Polyurethane Market Revenue and Forecast to 2030 (US$ Million)
- 7.2.3 Thermoplastic Polyurethane Market Volume and Forecast to 2030 (Tons)
- 7.3 Polyether Ether Ketone
- 7.3.1 Overview
- 7.3.2 Polyether Ether Ketone Market Revenue and Forecast to 2030 (US$ Million)
- 7.3.3 Polyether Ether Ketone Market Volume and Forecast to 2030 (Tons)
- 7.4 Others
- 7.4.1 Overview
- 7.4.2 Others Market Revenue and Forecast to 2030 (US$ Million)
- 7.4.3 Others Market Volume and Forecast to 2030 (Tons)
8. Global Plastics for SLS 3D Printing Market Analysis - End-Use Industry
- 8.1 Healthcare
- 8.1.1 Overview
- 8.1.2 Healthcare Market Revenue and Forecast to 2030 (US$ Million)
- 8.2 Aerospace and Defense
- 8.2.1 Overview
- 8.2.2 Aerospace and Defense Market Revenue and Forecast to 2030 (US$ Million)
- 8.3 Automotive
- 8.3.1 Overview
- 8.3.2 Automotive Market Revenue and Forecast to 2030 (US$ Million)
- 8.4 Electronics
- 8.4.1 Overview
- 8.4.2 Electronics Market Revenue and Forecast to 2030 (US$ Million)
- 8.5 Others
- 8.5.1 Overview
- 8.5.2 Others Market Revenue and Forecast to 2030 (US$ Million)
9. Global Plastics for SLS 3D Printing Market - Geographical Analysis
- 9.1 North America
- 9.1.1 North America Plastics for SLS 3D Printing Market Overview
- 9.1.2 North America Plastics for SLS 3D Printing Market Revenue and Forecasts to 2030 (US$ Million)
- 9.1.3 North America Plastics for SLS 3D Printing Market Volume and Forecasts to 2030 (Tons)
- 9.1.4 North America Plastics for SLS 3D Printing Market Breakdown by Type
- 9.1.4.1 North America Plastics for SLS 3D Printing Market Revenue and Forecasts and Analysis - By Type
- 9.1.4.2 North America Plastics for SLS 3D Printing Market Volume and Forecasts and Analysis - By Type
- 9.1.5 North America Plastics for SLS 3D Printing Market Breakdown by End-Use Industry
- 9.1.5.1 North America Plastics for SLS 3D Printing Market Revenue and Forecasts and Analysis - By End-Use Industry
- 9.1.6 North America Plastics for SLS 3D Printing Market Revenue and Forecasts and Analysis - By Countries
- 9.1.6.1 North America Plastics for SLS 3D Printing Market Breakdown by Country
- 9.1.6.2 US Plastics for SLS 3D Printing Market Revenue and Forecasts to 2030 (US$ Million)
- 9.1.6.3 US Plastics for SLS 3D Printing Market Volume and Forecasts to 2030 (Tons)
- 9.1.6.3.1 US Plastics for SLS 3D Printing Market Breakdown by Type
- 9.1.6.3.2 US Plastics for SLS 3D Printing Market Breakdown by End-Use Industry
- 9.1.6.4 Canada Plastics for SLS 3D Printing Market Revenue and Forecasts to 2030 (US$ Million)
- 9.1.6.5 Canada Plastics for SLS 3D Printing Market Volume and Forecasts to 2030 (Tons)
- 9.1.6.5.1 Canada Plastics for SLS 3D Printing Market Breakdown by Type
- 9.1.6.5.2 Canada Plastics for SLS 3D Printing Market Breakdown by End-Use Industry
- 9.1.6.6 Mexico Plastics for SLS 3D Printing Market Revenue and Forecasts to 2030 (US$ Million)
- 9.1.6.7 Mexico Plastics for SLS 3D Printing Market Volume and Forecasts to 2030 (Tons)
- 9.1.6.7.1 Mexico Plastics for SLS 3D Printing Market Breakdown by Type
- 9.1.6.7.2 Mexico Plastics for SLS 3D Printing Market Breakdown by End-Use Industry
- 9.2 Europe
- 9.2.1 Europe Plastics for SLS 3D Printing Market Overview
- 9.2.2 Europe Plastics for SLS 3D Printing Market Revenue and Forecasts to 2030 (US$ Million)
- 9.2.3 Europe Plastics for SLS 3D Printing Market Volume and Forecasts to 2030 (Tons)
- 9.2.4 Europe Plastics for SLS 3D Printing Market Breakdown by Type
- 9.2.4.1 Europe Plastics for SLS 3D Printing Market Revenue and Forecasts and Analysis - By Type
- 9.2.4.2 Europe Plastics for SLS 3D Printing Market Volume and Forecasts and Analysis - By Type
- 9.2.5 Europe Plastics for SLS 3D Printing Market Breakdown by End-Use Industry
- 9.2.5.1 Europe Plastics for SLS 3D Printing Market Revenue and Forecasts and Analysis - By End-Use Industry
- 9.2.6 Europe Plastics for SLS 3D Printing Market Revenue and Forecasts and Analysis - By Countries
- 9.2.6.1 Europe Plastics for SLS 3D Printing Market Breakdown by Country
- 9.2.6.2 Germany Plastics for SLS 3D Printing Market Revenue and Forecasts to 2030 (US$ Million)
- 9.2.6.3 Germany Plastics for SLS 3D Printing Market Volume and Forecasts to 2030 (Tons)
- 9.2.6.3.1 Germany Plastics for SLS 3D Printing Market Breakdown by Type
- 9.2.6.3.2 Germany Plastics for SLS 3D Printing Market Breakdown by End-Use Industry
- 9.2.6.4 France Plastics for SLS 3D Printing Market Revenue and Forecasts to 2030 (US$ Million)
- 9.2.6.5 France Plastics for SLS 3D Printing Market Volume and Forecasts to 2030 (Tons)
- 9.2.6.5.1 France Plastics for SLS 3D Printing Market Breakdown by Type
- 9.2.6.5.2 France Plastics for SLS 3D Printing Market Breakdown by End-Use Industry
- 9.2.6.6 Italy Plastics for SLS 3D Printing Market Revenue and Forecasts to 2030 (US$ Million)
- 9.2.6.7 Italy Plastics for SLS 3D Printing Market Volume and Forecasts to 2030 (Tons)
- 9.2.6.7.1 Italy Plastics for SLS 3D Printing Market Breakdown by Type
- 9.2.6.7.2 Italy Plastics for SLS 3D Printing Market Breakdown by End-Use Industry
- 9.2.6.8 UK Plastics for SLS 3D Printing Market Revenue and Forecasts to 2030 (US$ Million)
- 9.2.6.9 UK Plastics for SLS 3D Printing Market Volume and Forecasts to 2030 (Tons)
- 9.2.6.9.1 UK Plastics for SLS 3D Printing Market Breakdown by Type
- 9.2.6.9.2 UK Plastics for SLS 3D Printing Market Breakdown by End-Use Industry
- 9.2.6.10 Russia Plastics for SLS 3D Printing Market Revenue and Forecasts to 2030 (US$ Million)
- 9.2.6.11 Russia Plastics for SLS 3D Printing Market Volume and Forecasts to 2030 (Tons)
- 9.2.6.11.1 Russia Plastics for SLS 3D Printing Market Breakdown by Type
- 9.2.6.11.2 Russia Plastics for SLS 3D Printing Market Breakdown by End-Use Industry
- 9.2.6.12 Rest of Europe Plastics for SLS 3D Printing Market Revenue and Forecasts to 2030 (US$ Million)
- 9.2.6.13 Rest of Europe Plastics for SLS 3D Printing Market Volume and Forecasts to 2030 (Tons)
- 9.2.6.13.1 Rest of Europe Plastics for SLS 3D Printing Market Breakdown by Type
- 9.2.6.13.2 Rest of Europe Plastics for SLS 3D Printing Market Breakdown by End-Use Industry
- 9.3 Asia Pacific Plastics for SLS 3D Printing Market
- 9.3.1 Overview
- 9.3.2 Asia Pacific Plastics for SLS 3D Printing Market Revenue and Forecasts To 2030 (US$ Million)
- 9.3.3 Asia Pacific Plastics for SLS 3D Printing Market Volume and Forecasts To 2030 (Tons)
- 9.3.4 Asia Pacific Plastics for SLS 3D Printing Market Breakdown by Type
- 9.3.4.1 Asia Pacific Plastics for SLS 3D Printing Market Revenue and Forecasts and Analysis - By Type
- 9.3.4.2 Asia Pacific Plastics for SLS 3D Printing Market Volume and Forecasts and Analysis - By Type
- 9.3.5 Asia Pacific Plastics for SLS 3D Printing Market Breakdown by End-Use Industry
- 9.3.5.1 Asia Pacific Plastics for SLS 3D Printing Market Revenue and Forecasts and Analysis - By End-Use Industry
- 9.3.6 Asia Pacific Plastics for SLS 3D Printing Market Breakdown by Country
- 9.3.6.1 Asia Pacific Plastics for SLS 3D Printing Market Breakdown by Country
- 9.3.6.2 Australia Plastics for SLS 3D Printing Market Revenue and Forecasts to 2030 (US$ Million)
- 9.3.6.3 Australia Plastics for SLS 3D Printing Market Volume and Forecasts to 2030 (Tons)
- 9.3.6.3.1 Australia Plastics for SLS 3D Printing Market Breakdown by Type
- 9.3.6.3.2 Australia Plastics for SLS 3D Printing Market Breakdown by End-Use Industry
- 9.3.6.4 China Plastics for SLS 3D Printing Market Revenue and Forecasts to 2030 (US$ Million)
- 9.3.6.5 China Plastics for SLS 3D Printing Market Volume and Forecasts to 2030 (Tons)
- 9.3.6.5.1 China Plastics for SLS 3D Printing Market Breakdown by Type
- 9.3.6.5.2 China Plastics for SLS 3D Printing Market Breakdown by End-Use Industry
- 9.3.6.6 India Plastics for SLS 3D Printing Market Revenue and Forecasts to 2030 (US$ Million)
- 9.3.6.7 India Plastics for SLS 3D Printing Market Volume and Forecasts to 2030 (Tons)
- 9.3.6.7.1 India Plastics for SLS 3D Printing Market Breakdown by Type
- 9.3.6.7.2 India Plastics for SLS 3D Printing Market Breakdown by End-Use Industry
- 9.3.6.8 Japan Plastics for SLS 3D Printing Market Revenue and Forecasts to 2030 (US$ Million)
- 9.3.6.9 Japan Plastics for SLS 3D Printing Market Volume and Forecasts to 2030 (Tons)
- 9.3.6.9.1 Japan Plastics for SLS 3D Printing Market Breakdown by Type
- 9.3.6.9.2 Japan Plastics for SLS 3D Printing Market Breakdown by End-Use Industry
- 9.3.6.10 South Korea Plastics for SLS 3D Printing Market Revenue and Forecasts to 2030 (US$ Million)
- 9.3.6.11 South Korea Plastics for SLS 3D Printing Market Volume and Forecasts to 2030 (Tons)
- 9.3.6.11.1 South Korea Plastics for SLS 3D Printing Market Breakdown by Type
- 9.3.6.11.2 South Korea Plastics for SLS 3D Printing Market Breakdown by End-Use Industry
- 9.3.6.12 Rest of Asia Pacific Plastics for SLS 3D Printing Market Revenue and Forecasts to 2030 (US$ Million)
- 9.3.6.13 Rest of Asia Pacific Plastics for SLS 3D Printing Market Volume and Forecasts to 2030 (Tons)
- 9.3.6.13.1 Rest of Asia Pacific Plastics for SLS 3D Printing Market Breakdown by Type
- 9.3.6.13.2 Rest of Asia Pacific Plastics for SLS 3D Printing Market Breakdown by End-Use Industry
- 9.4 Middle East and Africa
- 9.4.1 Middle East and Africa Plastics for SLS 3D Printing Market Overview
- 9.4.2 Middle East and Africa Plastics for SLS 3D Printing Market Revenue and Forecasts to 2030 (US$ Million)
- 9.4.3 Middle East and Africa Plastics for SLS 3D Printing Market Volume and Forecasts to 2030 (Tons)
- 9.4.4 Middle East and Africa Plastics for SLS 3D Printing Market Breakdown by Type
- 9.4.4.1 Middle East and Africa Plastics for SLS 3D Printing Market Revenue and Forecasts and Analysis - By Type
- 9.4.4.2 Middle East and Africa Plastics for SLS 3D Printing Market Volume and Forecasts and Analysis - By Type
- 9.4.5 Middle East and Africa Plastics for SLS 3D Printing Market Breakdown by End-Use Industry
- 9.4.5.1 Middle East and Africa Plastics for SLS 3D Printing Market Revenue and Forecasts and Analysis - By End-Use Industry
- 9.4.6 Middle East and Africa Plastics for SLS 3D Printing Market Revenue and Forecasts and Analysis - By Countries
- 9.4.6.1 Middle East and Africa Plastics for SLS 3D Printing Market Breakdown by Country
- 9.4.6.2 South Africa Plastics for SLS 3D Printing Market Revenue and Forecasts to 2030 (US$ Million)
- 9.4.6.3 South Africa Plastics for SLS 3D Printing Market Volume and Forecasts to 2030 (Tons)
- 9.4.6.3.1 South Africa Plastics for SLS 3D Printing Market Breakdown by Type
- 9.4.6.3.2 South Africa Plastics for SLS 3D Printing Market Breakdown by End-Use Industry
- 9.4.6.4 Saudi Arabia Plastics for SLS 3D Printing Market Revenue and Forecasts to 2030 (US$ Million)
- 9.4.6.5 Saudi Arabia Plastics for SLS 3D Printing Market Volume and Forecasts to 2030 (Tons)
- 9.4.6.5.1 Saudi Arabia Plastics for SLS 3D Printing Market Breakdown by Type
- 9.4.6.5.2 Saudi Arabia Plastics for SLS 3D Printing Market Breakdown by End-Use Industry
- 9.4.6.6 UAE Plastics for SLS 3D Printing Market Revenue and Forecasts to 2030 (US$ Million)
- 9.4.6.7 UAE Plastics for SLS 3D Printing Market Volume and Forecasts to 2030 (Tons)
- 9.4.6.7.1 UAE Plastics for SLS 3D Printing Market Breakdown by Type
- 9.4.6.7.2 UAE Plastics for SLS 3D Printing Market Breakdown by End-Use Industry
- 9.4.6.8 Turkey Plastics for SLS 3D Printing Market Revenue and Forecasts to 2030 (US$ Million)
- 9.4.6.9 Turkey Plastics for SLS 3D Printing Market Volume and Forecasts to 2030 (Tons)
- 9.4.6.9.1 Turkey Plastics for SLS 3D Printing Market Breakdown by Type
- 9.4.6.9.2 Turkey Plastics for SLS 3D Printing Market Breakdown by End-Use Industry
- 9.4.6.10 Rest of MEA Plastics for SLS 3D Printing Market Revenue and Forecasts to 2030 (US$ Million)
- 9.4.6.11 Rest of MEA Plastics for SLS 3D Printing Market Volume and Forecasts to 2030 (Tons)
- 9.4.6.11.1 Rest of MEA Plastics for SLS 3D Printing Market Breakdown by Type
- 9.4.6.11.2 Rest of MEA Plastics for SLS 3D Printing Market Breakdown by End-Use Industry
- 9.5 South and Central America
- 9.5.1 South and Central America Plastics for SLS 3D Printing Market Overview
- 9.5.2 South and Central America Plastics for SLS 3D Printing Market Revenue and Forecasts to 2030 (US$ Million)
- 9.5.3 South and Central America Plastics for SLS 3D Printing Market Volume and Forecasts to 2030 (Tons)
- 9.5.4 South and Central America Plastics for SLS 3D Printing Market Breakdown by Type
- 9.5.4.1 South and Central America Plastics for SLS 3D Printing Market Revenue and Forecasts and Analysis - By Type
- 9.5.4.2 South and Central America Plastics for SLS 3D Printing Market Volume and Forecasts and Analysis - By Type
- 9.5.5 South and Central America Plastics for SLS 3D Printing Market Breakdown by End-Use Industry
- 9.5.5.1 South and Central America Plastics for SLS 3D Printing Market Revenue and Forecasts and Analysis - By End-Use Industry
- 9.5.6 South and Central America Plastics for SLS 3D Printing Market Revenue and Forecasts and Analysis - By Countries
- 9.5.6.1 South and Central America Plastics for SLS 3D Printing Market Breakdown by Country
- 9.5.6.2 Brazil Plastics for SLS 3D Printing Market Revenue and Forecasts to 2030 (US$ Million)
- 9.5.6.3 Brazil Plastics for SLS 3D Printing Market Volume and Forecasts to 2030 (Tons)
- 9.5.6.3.1 Brazil Plastics for SLS 3D Printing Market Breakdown by Type
- 9.5.6.3.2 Brazil Plastics for SLS 3D Printing Market Breakdown by End-Use Industry
- 9.5.6.4 Argentina Plastics for SLS 3D Printing Market Revenue and Forecasts to 2030 (US$ Million)
- 9.5.6.5 Argentina Plastics for SLS 3D Printing Market Volume and Forecasts to 2030 (Tons)
- 9.5.6.5.1 Argentina Plastics for SLS 3D Printing Market Breakdown by Type
- 9.5.6.5.2 Argentina Plastics for SLS 3D Printing Market Breakdown by End-Use Industry
- 9.5.6.6 Rest of SAM Plastics for SLS 3D Printing Market Revenue and Forecasts to 2030 (US$ Million)
- 9.5.6.7 Rest of SAM Plastics for SLS 3D Printing Market Volume and Forecasts to 2030 (Tons)
- 9.5.6.7.1 Rest of SAM Plastics for SLS 3D Printing Market Breakdown by Type
- 9.5.6.7.2 Rest of SAM Plastics for SLS 3D Printing Market Breakdown by End-Use Industry
10. Impact of COVID-19 Pandemic on Global Plastics for SLS 3D Printing Market
- 10.1 Pre & Post Covid-19 Impact
11. Competitive Landscape
- 11.1 Heat Map Analysis by Key Players
- 11.2 Company Positioning & Concentration
12. Industry Landscape
- 12.1 Overview
- 12.2 Merger and Acquisition
- 12.3 Other Business Strategies
13. Company Profiles
- 13.1 3D Systems Corp
- 13.1.1 Key Facts
- 13.1.2 Business Description
- 13.1.3 Products and Services
- 13.1.4 Financial Overview
- 13.1.5 SWOT Analysis
- 13.1.6 Key Developments
- 13.2 BASF SE
- 13.2.1 Key Facts
- 13.2.2 Business Description
- 13.2.3 Products and Services
- 13.2.4 Financial Overview
- 13.2.5 SWOT Analysis
- 13.2.6 Key Developments
- 13.3 Evonik Industries AG
- 13.3.1 Key Facts
- 13.3.2 Business Description
- 13.3.3 Products and Services
- 13.3.4 Financial Overview
- 13.3.5 SWOT Analysis
- 13.3.6 OPPORTUNITIES
- 13.3.7 Key Developments
- 13.4 Arkema SA
- 13.4.1 Key Facts
- 13.4.2 Business Description
- 13.4.3 Products and Services
- 13.4.4 Financial Overview
- 13.4.5 SWOT Analysis
- 13.4.6 Key Developments
- 13.5 Ensinger GmbH
- 13.5.1 Key Facts
- 13.5.2 Business Description
- 13.5.3 Products and Services
- 13.5.4 Financial Overview
- 13.5.5 SWOT Analysis
- 13.5.6 Key Developments
- 13.6 Fiberlab SA
- 13.6.1 Key Facts
- 13.6.2 Business Description
- 13.6.3 Products and Services
- 13.6.4 Financial Overview
- 13.6.5 SWOT Analysis
- 13.6.6 Key Developments
- 13.7 Stratasys Ltd
- 13.7.1 Key Facts
- 13.7.2 Business Description
- 13.7.3 Products and Services
- 13.7.4 Financial Overview
- 13.7.5 SWOT Analysis
- 13.7.6 Key Developments
- 13.8 Sinterit Sp Zoo
- 13.8.1 Key Facts
- 13.8.2 Business Description
- 13.8.3 Products and Services
- 13.8.4 Financial Overview
- 13.8.5 SWOT Analysis
- 13.8.6 Key Developments
- 13.9 EOS GmbH
- 13.9.1 Key Facts
- 13.9.2 Business Description
- 13.9.3 Products and Services
- 13.9.4 Financial Overview
- 13.9.5 SWOT Analysis
- 13.9.6 Key Developments
- 13.10 CRP Service SRL
- 13.10.1 Key Facts
- 13.10.2 Business Description
- 13.10.3 Financial Overview
- 13.10.4 SWOT Analysis
- 13.10.5 Key Developments
