|
|
市場調査レポート
商品コード
1389635
タルクの市場規模・予測、世界・地域のシェア、動向、成長機会分析:タイプ別、用途別Talc Market Size and Forecasts, Global and Regional Share, Trends, and Growth Opportunity Analysis Report Coverage: By Deposit Type and End-Use Industry |
||||||
|
|
|||||||
|
|||||||


| タルクの市場規模・予測、世界・地域のシェア、動向、成長機会分析:タイプ別、用途別 |
|
出版日: 2023年11月03日
発行: The Insight Partners
ページ情報: 英文 167 Pages
納期: 即納可能
|

- 全表示
- 概要
- 図表
- 目次
タルクの市場規模は2022年に19億8,000万米ドルと評価され、2030年には29億3,000万米ドルに達すると予測され、2022年から2030年までのCAGRは5.0%を記録すると推定されています。
タルクは水和ケイ酸マグネシウムです。タルク鉱床は、珪酸性熱水による高マグネシウム岩石の変質から形成されます。タルクのほとんどは、ドロマイトまたは超苦鉄質貫入岩の変質に由来します。タルクは常に他の鉱物、一般的には炭酸塩や緑泥石との組み合わせで発見されます。タルク鉱床はそれぞれ独特な形態と鉱物学を持っていますが、どのタイプのタルクも、軟らかさ、撥水性、化学的不活性、平板性、有機物との親和性など、次のような独特な性質を示します。
これらの特性により、タルクはプラスチックから紙、セラミック、塗料に至るまで、幅広い用途の多機能フィラーおよびプロセスイネーブラーとして適しています。タルクは粘着防止剤、固結防止剤、潤滑剤、担体、増粘剤、強化フィラー、平滑フィラー、吸着剤として使用されます。タルク市場成長の主な促進要因は、セラミックス、プラスチック、塗料・コーティング、食品、農業など様々な最終用途産業からの需要が増加していることです。セラミック分野は最も魅力的な分野であり、世界のタルク市場に有利な機会を生み出しています。プラスチック産業もタルクの重要な消費者です。タルクは主にプラスチックの充填剤として使用されます。
タルク市場は鉱床の種類によって、タルククロライトと炭酸タルクに区分されます。2022年の市場シェアは炭酸タルクの方が大きいです。炭酸タルク鉱床は主に炭酸タルクと微量の亜塩素酸塩を含みます。これらの鉱床は変成岩で発見されることが多く、変成岩鉱床の亜型とみなすことができます。炭酸タルク鉱床では、タルクの形成は、マグネシウムに富む鉱物を豊富に含む既存の岩石の交替と関連していることが多いです。タルクは、変成条件の影響下でこれらの鉱物に取って代わり、タルクに富む岩石の発達につながります。タルク-炭酸塩鉱石は、関連鉱物を除去し、純粋なタルク精鉱を生産するために処理されます。タルク市場は、最終用途産業に基づいて、プラスチック、パルプ・製紙、セラミック、塗料・コーティング、ゴム、医薬品、食品、その他に区分されます。2022年のタルク市場シェアは、パルプ・製紙分野が突出しています。パルプ・製紙業界では、タルクはシート強度への悪影響を最小限に抑え、インク受容性を大幅に向上させるため、製紙用充填剤として使用されています。また、不透明度と明度を高め、光沢を抑える効果もあります。タルクは、紙のリサイクルや、紙、パルプ、段ボールの新規生産に填料として使用することができます。タルクの使用は最終製品の特性を向上させ、生産コストを削減します。
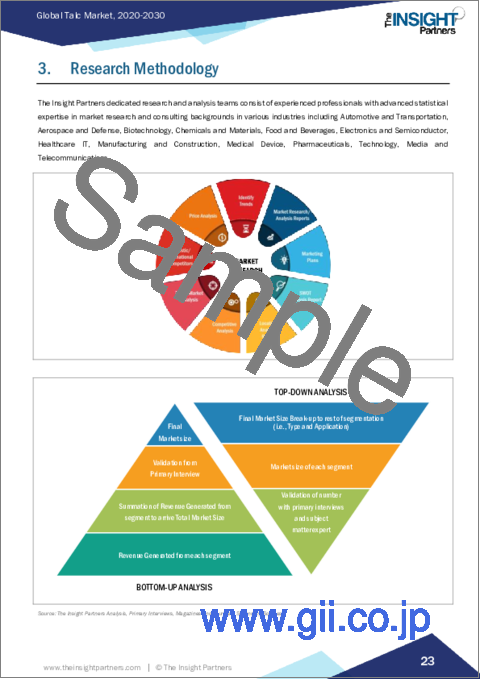
タルクの世界市場全体の規模は、一次情報と二次情報の両方を用いて導き出されたものです。調査プロセスを開始するにあたり、市場に関連する質的・量的情報を入手するため、社内外の情報源を用いて徹底的な二次調査を実施しました。また、データを検証し、トピックに関するより分析的な洞察を得るために、業界関係者に複数の一次インタビューを実施しました。このプロセスの参入企業には、副社長、市場開拓マネージャー、マーケットインテリジェンスマネージャー、国内営業マネージャーなどの業界専門家と、タルク市場を専門とする評価専門家、調査アナリスト、キーオピニオンリーダーなどの外部コンサルタントが含まれます。
目次
第1章 イントロダクション
第2章 エグゼクティブサマリー
- 主要洞察
- 市場の魅力
第3章 調査手法
- 調査範囲
- 2次調査
- 1次調査
第4章 タルクの世界市場情勢
- ポーターのファイブフォース分析
- 新規参入業者の脅威
- 供給企業の交渉力
- 買い手の交渉力:競争力
- 競争企業間の敵対関係
- 代替品の脅威
- エコシステム分析
- 採掘
- 加工と粉砕
- 製品の流通または供給
- 最終用途産業
第5章 タルクの世界市場:主要市場力学
- 市場促進要因
- 紙・パルプ産業におけるタルク使用の増加
- 様々な最終用途産業からの需要増加
- 市場抑制要因
- タルクの使用に関する健康上の懸念
- 市場機会
- セラミックス産業の成長
- 今後の動向
- 自動車産業におけるプラスチックの需要拡大
- 影響分析
第6章 タルク市場:世界市場分析
- タルクの世界市場収益
- タルクの世界市場数量(キロトン)
- タルクの世界市場予測・分析
第7章 タルクの世界市場分析:タイプ別
- タルククロライト
- 炭酸タルク
第8章 タルクの世界市場分析:用途別
- プラスチック
- パルプ・紙
- セラミック
- 塗料・コーティング
- ゴム
- 医薬品
- 食品
- その他
第9章 タルクの世界市場:地域別分析
- 北米
- メキシコ
- 欧州
- その他欧州
- アジア太平洋
- その他アジア太平洋地域
- 中東・アフリカ
- その他中東・アフリカ
- 中南米
- その他南米
第10章 COVID-19パンデミックの世界のタルク市場への影響
- COVID-19前後の影響
第11章 競合情勢
- 主要プレーヤーによるヒートマップ分析
- 企業のポジショニングと集中度
第12章 業界情勢
- 合併と買収
- その他の事業戦略
第13章 企業プロファイル
- Elementis Plc
- Golcha Minerals Pvt Ltd
- Imerys SA
- IMI Fabi SpA
- Liaoning Aihai Talc Co Ltd
- Minerals Technologies Inc
- Nippon Talc Co Ltd
- SCR-Sibelco NV
- Sun Minerals Pvt Ltd
- Xilolite SA
第14章 付録
List Of Tables
- Table 1. Global Talc Market Segmentation
- Table 2. Global Talc Market Revenue and Forecasts To 2030 (US$ Million)
- Table 3. Global Talc Market Volume and Forecasts To 2030 (Kilo Tons)
- Table 4. Global Talc Market Revenue and Forecasts To 2030 (US$ Million) - Type
- Table 5. Global Talc Market Volume and Forecasts To 2030 (Kilo Tons) - Type
- Table 6. Global Talc Market Revenue and Forecasts To 2030 (US$ Million) - Application
- Table 7. North America Talc Market Revenue and Forecasts To 2030 (US$ Million) - By Type
- Table 8. North America Talc Market Volume and Forecasts To 2030 (Kilo Tons) - By Type
- Table 9. North America Talc Market Revenue and Forecasts To 2030 (US$ Million) - By Application
- Table 10. US Talc Market Revenue and Forecasts To 2030 (US$ Million) - By Type
- Table 11. US Talc Market Volume and Forecasts To 2030 (Kilo Tons) - By Type
- Table 12. US Talc Market Revenue and Forecasts To 2030 (US$ Million) - By Application
- Table 13. Canada Talc Market Revenue and Forecasts To 2030 (US$ Million) - By Type
- Table 14. Canada Talc Market Volume and Forecasts To 2030 (Kilo Tons) - By Type
- Table 15. Canada Talc Market Revenue and Forecasts To 2030 (US$ Million) - By Application
- Table 16. Mexico Talc Market Revenue and Forecasts To 2030 (US$ Million) - By Type
- Table 17. Mexico Talc Market Volume and Forecasts To 2030 (Kilo Tons) - By Type
- Table 18. Mexico Talc Market Revenue and Forecasts To 2030 (US$ Million) - By Application
- Table 19. Europe Talc Market Revenue and Forecasts To 2030 (US$ Million) - By Type
- Table 20. Europe Talc Market Volume and Forecasts To 2030 (Kilo Tons) - By Type
- Table 21. Europe Talc Market Revenue and Forecasts To 2030 (US$ Million) - By Application
- Table 22. Germany Talc Market Revenue and Forecasts To 2030 (US$ Million) - By Type
- Table 23. Germany Talc Market Volume and Forecasts To 2030 (Kilo Tons) - By Type
- Table 24. Germany Talc Market Revenue and Forecasts To 2030 (US$ Million) - By Application
- Table 25. France Talc Market Revenue and Forecasts To 2030 (US$ Million) - By Type
- Table 26. France Talc Market Volume and Forecasts To 2030 (Kilo Tons) - By Type
- Table 27. France Talc Market Revenue and Forecasts To 2030 (US$ Million) - By Application
- Table 28. Italy Talc Market Revenue and Forecasts To 2030 (US$ Million) - By Type
- Table 29. Italy Talc Market Volume and Forecasts To 2030 (Kilo Tons) - By Type
- Table 30. Italy Talc Market Revenue and Forecasts To 2030 (US$ Million) - By Application
- Table 31. UK Talc Market Revenue and Forecasts To 2030 (US$ Million) - By Type
- Table 32. UK Talc Market Volume and Forecasts To 2030 (Kilo Tons) - By Type
- Table 33. UK Talc Market Revenue and Forecasts To 2030 (US$ Million) - By Application
- Table 34. Russia Talc Market Revenue and Forecasts To 2030 (US$ Million) - By Type
- Table 35. Russia Talc Market Volume and Forecasts To 2030 (Kilo Tons) - By Type
- Table 36. Russia Talc Market Revenue and Forecasts To 2030 (US$ Million) - By Application
- Table 37. Rest of Europe Talc Market Revenue and Forecasts To 2030 (US$ Million) - By Type
- Table 38. Rest of Europe Talc Market Volume and Forecasts To 2030 (Kilo Tons) - By Type
- Table 39. Rest of Europe Talc Market Revenue and Forecasts To 2030 (US$ Million) - By Application
- Table 40. Asia Pacific Talc Market Revenue and Forecasts To 2030 (US$ Million) - Type
- Table 41. Asia Pacific Talc Market Volume and Forecasts To 2030 (Kilo Tons) - Type
- Table 42. Asia Pacific Talc Market Revenue and Forecasts To 2030 (US$ Million) - Application
- Table 43. Australia Talc Market Revenue and Forecasts To 2030 (US$ Million) - By Type
- Table 44. Australia Talc Market Volume and Forecasts To 2030 (Kilo Tons) - By Type
- Table 45. Australia Talc Market Revenue and Forecasts To 2030 (US$ Million) - By Application
- Table 46. China Talc Market Revenue and Forecasts To 2030 (US$ Million) - By Type
- Table 47. China Talc Market Volume and Forecasts To 2030 (Kilo Tons) - By Type
- Table 48. China Talc Market Revenue and Forecasts To 2030 (US$ Million) - By Application
- Table 49. India Talc Market Revenue and Forecasts To 2030 (US$ Million) - By Type
- Table 50. India Talc Market Volume and Forecasts To 2030 (Kilo Tons) - By Type
- Table 51. India Talc Market Revenue and Forecasts To 2030 (US$ Million) - By Application
- Table 52. Japan Talc Market Revenue and Forecasts To 2030 (US$ Million) - By Type
- Table 53. Japan Talc Market Volume and Forecasts To 2030 (Kilo Tons) - By Type
- Table 54. Japan Talc Market Revenue and Forecasts To 2030 (US$ Million) - By Application
- Table 55. South Korea Talc Market Revenue and Forecasts To 2030 (US$ Million) - By Type
- Table 56. South Korea Talc Market Volume and Forecasts To 2030 (Kilo Tons) - By Type
- Table 57. South Korea Talc Market Revenue and Forecasts To 2030 (US$ Million) - By Application
- Table 58. Rest of Asia Pacific Talc Market Revenue and Forecasts To 2030 (US$ Million) - By Type
- Table 59. Rest of Asia Pacific Talc Market Volume and Forecasts To 2030 (Kilo Tons) - By Type
- Table 60. Rest of Asia Pacific Talc Market Revenue and Forecasts To 2030 (US$ Million) - By Application
- Table 61. Middle East and Africa Talc Market Revenue and Forecasts To 2030 (US$ Million) - By Type
- Table 62. Middle East and Africa Talc Market Volume and Forecasts To 2030 (Kilo Tons) - By Type
- Table 63. Middle East and Africa Talc Market Revenue and Forecasts To 2030 (US$ Million) - By Application
- Table 64. South Africa Talc Market Revenue and Forecasts To 2030 (US$ Million) - By Type
- Table 65. South Africa Talc Market Volume and Forecasts To 2030 (Kilo Tons) - By Type
- Table 66. South Africa Talc Market Revenue and Forecasts To 2030 (US$ Million) - By Application
- Table 67. Saudi Arabia Talc Market Revenue and Forecasts To 2030 (US$ Million) - By Type
- Table 68. Saudi Arabia Talc Market Volume and Forecasts To 2030 (Kilo Tons) - By Type
- Table 69. Saudi Arabia Talc Market Revenue and Forecasts To 2030 (US$ Million) - By Application
- Table 70. UAE Talc Market Revenue and Forecasts To 2030 (US$ Million) - By Type
- Table 71. UAE Talc Market Volume and Forecasts To 2030 (Kilo Tons) - By Type
- Table 72. UAE Talc Market Revenue and Forecasts To 2030 (US$ Million) - By Application
- Table 73. Rest of MEA Talc Market Revenue and Forecasts To 2030 (US$ Million) - By Type
- Table 74. Rest of MEA Talc Market Volume and Forecasts To 2030 (Kilo Tons) - By Type
- Table 75. Rest of MEA Talc Market Revenue and Forecasts To 2030 (US$ Million) - By Application
- Table 76. South and Central America Talc Market Revenue and Forecasts To 2030 (US$ Million) - By Type
- Table 77. South and Central America Talc Market Volume and Forecasts To 2030 (Kilo Tons) - By Type
- Table 78. South and Central America Talc Market Revenue and Forecasts To 2030 (US$ Million) - By Application
- Table 79. Brazil Talc Market Revenue and Forecasts To 2030 (US$ Million) - By Type
- Table 80. Brazil Talc Market Volume and Forecasts To 2030 (Kilo Tons) - By Type
- Table 81. Brazil Talc Market Revenue and Forecasts To 2030 (US$ Million) - By Application
- Table 82. Argentina Talc Market Revenue and Forecasts To 2030 (US$ Million) - By Type
- Table 83. Argentina Talc Market Volume and Forecasts To 2030 (Kilo Tons) - By Type
- Table 84. Argentina Talc Market Revenue and Forecasts To 2030 (US$ Million) - By Application
- Table 85. Rest of SAM Talc Market Revenue and Forecasts To 2030 (US$ Million) - By Type
- Table 86. Rest of SAM Talc Market Volume and Forecasts To 2030 (Kilo Tons) - By Type
- Table 87. Rest of SAM Talc Market Revenue and Forecasts To 2030 (US$ Million) - By Application
List Of Figures
- Figure 1. Global Talc Market Segmentation, By Country
- Figure 2. Global Talc Market - Porter's Five Forces Analysis
- Figure 3. Ecosystem: Global Talc Market
- Figure 4. Market Dynamics: Global Talc Market
- Figure 5. Global Talc Market Impact Analysis of Drivers and Restraints
- Figure 6. Global Talc Market Revenue (US$ Million), 2020 - 2030
- Figure 7. Global Talc Market Volume (Kilo Tons), 2020 - 2030
- Figure 8. Global Talc Market Share (%) - Type, 2022 and 2030
- Figure 9. Talc Chlorite Market Revenue and Forecasts To 2030 (US$ Million)
- Figure 10. Talc Chlorite Market Volume and Forecasts To 2030 (Kilo Tons)
- Figure 11. Talc Carbonate Market Revenue and Forecasts To 2030 (US$ Million)
- Figure 12. Talc Carbonate Market Volume and Forecasts To 2030 (Kilo Tons)
- Figure 13. Global Talc Market Share (%) - Application, 2022 and 2030
- Figure 14. Plastics Market Revenue and Forecasts To 2030 (US$ Million)
- Figure 15. Pulp and Paper Market Revenue and Forecasts To 2030 (US$ Million)
- Figure 16. Ceramics Market Revenue and Forecasts To 2030 (US$ Million)
- Figure 17. Paints and Coatings Market Revenue and Forecasts To 2030 (US$ Million)
- Figure 18. Rubber Market Revenue and Forecasts To 2030 (US$ Million)
- Figure 19. Pharmaceuticals Market Revenue and Forecasts To 2030 (US$ Million)
- Figure 20. Food Market Revenue and Forecasts To 2030 (US$ Million)
- Figure 21. Others Market Revenue and Forecasts To 2030 (US$ Million)
- Figure 22. Global Talc Market Breakdown by Geography, 2022 and 2030
- Figure 23. North America Talc Market Revenue and Forecasts To 2030 (US$ Million)
- Figure 24. North America Talc Market Volume and Forecasts To 2030 (Kilo Tons)
- Figure 25. North America Talc Market Breakdown by Type (2022 and 2030)
- Figure 26. North America Talc Market Breakdown by Application (2022 and 2030)
- Figure 27. North America Talc Market Breakdown by Key Countries, 2022 and 2030 (%)
- Figure 28. US Talc Market Revenue and Forecasts To 2030 (US$ Million)
- Figure 29. US Talc Market Volume and Forecasts To 2030 (Kilo Tons)
- Figure 30. Canada Talc Market Revenue and Forecasts To 2030 (US$ Million)
- Figure 31. Canada Talc Market Volume and Forecasts To 2030 (Kilo Tons)
- Figure 32. Mexico Talc Market Revenue and Forecasts To 2030 (US$ Million)
- Figure 33. Mexico Talc Market Volume and Forecasts To 2030 (Kilo Tons)
- Figure 34. Europe Talc Market Revenue and Forecasts To 2030 (US$ Million)
- Figure 35. Europe Talc Market Volume and Forecasts To 2030 (Kilo Tons)
- Figure 36. Europe Talc Market Breakdown by Type (2022 and 2030)
- Figure 37. Europe Talc Market Breakdown by Application (2022 and 2030)
- Figure 38. Europe Bitumen additives market Breakdown by Key Countries, 2022 and 2030 (%)
- Figure 39. Germany Talc Market Revenue and Forecasts To 2030 (US$ Million)
- Figure 40. Germany Talc Market Volume and Forecasts To 2030 (Kilo Tons)
- Figure 41. France Talc Market Revenue and Forecasts To 2030 (US$ Million)
- Figure 42. France Talc Market Volume and Forecasts To 2030 (Kilo Tons)
- Figure 43. Italy Talc Market Revenue and Forecasts To 2030 (US$ Million)
- Figure 44. Italy Talc Market Volume and Forecasts To 2030 (Kilo Tons)
- Figure 45. UK Talc Market Revenue and Forecasts To 2030 (US$ Million)
- Figure 46. UK Talc Market Volume and Forecasts To 2030 (Kilo Tons)
- Figure 47. Russia Talc Market Revenue and Forecasts To 2030 (US$ Million)
- Figure 48. Russia Talc Market Volume and Forecasts To 2030 (Kilo Tons)
- Figure 49. Rest of Europe Talc Market Revenue and Forecasts To 2030 (US$ Million)
- Figure 50. Rest of Europe Talc Market Volume and Forecasts To 2030 (Kilo Tons)
- Figure 51. Asia Pacific Talc Market Revenue and Forecasts To 2030 (US$ Million)
- Figure 52. Asia Pacific Talc Market Volume and Forecasts To 2030 (Kilo Tons)
- Figure 53. Asia Pacific Talc Market Breakdown by Type (2022 and 2030)
- Figure 54. Asia Pacific Talc Market Breakdown by Application (2022 and 2030)
- Figure 55. Asia Pacific Talc Market Breakdown By Key Countries, 2022 And 2030 (%)
- Figure 56. Australia Talc Market Revenue and Forecasts To 2030 (US$ Million)
- Figure 57. Australia Talc Market Volume and Forecasts To 2030 (Kilo Tons)
- Figure 58. China Talc Market Revenue and Forecasts To 2030 (US$ Million)
- Figure 59. China Talc Market Volume and Forecasts To 2030 (Kilo Tons)
- Figure 60. India Talc Market Revenue and Forecasts To 2030 (US$ Million)
- Figure 61. India Talc Market Volume and Forecasts To 2030 (Kilo Tons)
- Figure 62. Japan Talc Market Revenue and Forecasts To 2030 (US$ Million)
- Figure 63. Japan Talc Market Volume and Forecasts To 2030 (Kilo Tons)
- Figure 64. South Korea Talc Market Revenue and Forecasts To 2030 (US$ Million)
- Figure 65. South Korea Talc Market Volume and Forecasts To 2030 (Kilo Tons)
- Figure 66. Rest of Asia Pacific Talc Market Revenue and Forecasts To 2030 (US$ Million)
- Figure 67. Rest of Asia Pacific Talc Market Volume and Forecasts To 2030 (Kilo Tons)
- Figure 68. Middle East and Africa Talc Market Revenue and Forecasts To 2030 (US$ Million)
- Figure 69. Middle East and Africa Talc Market Volume and Forecasts To 2030 (Kilo Tons)
- Figure 70. Middle East and Africa Talc Market Breakdown by Type (2022 and 2030)
- Figure 71. Middle East and Africa Talc Market Breakdown by Application (2022 and 2030)
- Figure 72. Middle East and Africa Bitumen additives market Breakdown by Key Countries, 2022 and 2030 (%)
- Figure 73. South Africa Talc Market Revenue and Forecasts To 2030 (US$ Million)
- Figure 74. South Africa Talc Market Volume and Forecasts To 2030 (Kilo Tons)
- Figure 75. Saudi Arabia Talc Market Revenue and Forecasts To 2030 (US$ Million)
- Figure 76. Saudi Arabia Talc Market Volume and Forecasts To 2030 (Kilo Tons)
- Figure 77. UAE Talc Market Revenue and Forecasts To 2030 (US$ Million)
- Figure 78. UAE Talc Market Volume and Forecasts To 2030 (Kilo Tons)
- Figure 79. Rest of MEA Talc Market Revenue and Forecasts To 2030 (US$ Million)
- Figure 80. Rest of MEA Talc Market Volume and Forecasts To 2030 (Kilo Tons)
- Figure 81. South and Central America Talc Market Revenue and Forecasts To 2030 (US$ Million)
- Figure 82. South and Central America Talc Market Volume and Forecasts To 2030 (Kilo Tons)
- Figure 83. South and Central America Talc Market Breakdown by Type (2022 and 2030)
- Figure 84. South and Central America Talc Market Breakdown by Application (2022 and 2030)
- Figure 85. South and Central America Talc Market Breakdown by Key Countries, 2022 and 2030 (%)
- Figure 86. Brazil Talc Market Revenue and Forecasts To 2030 (US$ Million)
- Figure 87. Brazil Talc Market Volume and Forecasts To 2030 (Kilo Tons)
- Figure 88. Argentina Talc Market Revenue and Forecasts To 2030 (US$ Million)
- Figure 89. Argentina Talc Market Volume and Forecasts To 2030 (Kilo Tons)
- Figure 90. Rest of SAM Talc Market Revenue and Forecasts To 2030 (US$ Million)
- Figure 91. Rest of SAM Talc Market Volume and Forecasts To 2030 (Kilo Tons)
- Figure 92. Company Positioning & Concentration
- Figure 93. Heat Map Analysis by Key Players
The talc market size was valued at US$ 1.98 billion in 2022 and is expected to reach US$ 2.93 billion by 2030; it is estimated to record a CAGR of 5.0% from 2022 to 2030.
Talc is a hydrated magnesium silicate. Talc deposits are formed from the transformation of high magnesium rocks by siliceous hydrothermal fluids. Most of the talc originates from the alteration of dolomite or ultramafic intrusive rocks. It is always found in combination with other minerals, generally with carbonates and chlorite. Each talc deposit has a unique morphology and mineralogy, but all types of talc exhibit the following unique properties such as softness, water repellency, chemical inertness, platyness, and an affinity for organic substances.
These properties make talc suitable as multi-functional filler and process enabler in a wide range of applications from plastics to paper, ceramics to paint. Talc is used as an anti-sticking agent, anti-caking agent, lubricant, a carrier, a thickener, a strengthening filler, a smooth filler, and an adsorbent. The major driver for the growth of the talc market is the growing demand from various end-use industries, such as ceramics, plastics, paints and coatings, food, and agriculture. The ceramics segment is the most attractive segment and creates lucrative opportunities in the global talc market. The plastics industry is another essential consumer of talc. Talc is mainly used as a filler in plastics.
Based on deposit type, the talc market is segmented into talc chlorite and talc carbonate. The talc carbonate segment held a larger market share in 2022. Talc-carbonate ore bodies mainly contain talc carbonate and chlorite traces. These deposits are often found in metamorphic rocks and can be considered a subtype of metamorphic deposits. In talc carbonate deposits, the formation of talc is often linked to the alternation of pre-existing rocks rich in magnesium-rich minerals. Talc replaces these minerals under the influence of metamorphic conditions, leading to the development of talc-rich rocks. Talc-carbonate ores are processed to remove associated minerals and produce pure talc concentrate. Based on end-use industry, the talc market is segmented into plastics, pulp & paper, ceramics, paints & coatings, rubber, pharmaceuticals, food, and others. The talc market share of the pulp & paper segment was notable in 2022. In the pulp & paper industry, talc is used as a paper filler because it has a minimal negative effect on sheet strength and improves ink receptivity by a large margin. It also enhances opacity and brightness and reduces gloss. Talc can be used in paper recycling and the new production of paper, pulp, and cardboard as filler. Talc use improves the properties of the finished products and reduces production costs.
In 2022, Asia Pacific held the largest share of the global talc market. Asia Pacific is one of the largest crude and processed talc-producing regions globally. The region is home to major manufacturers producing lightweight plastics for automotive components. Rapid industrialization and a surge in disposable income of the middle-class population of emerging economies are expected to drive the demand for talc in Asia Pacific. According to the International Organization of Motor Vehicle Manufacturers (OICA), vehicle production in Asia-Oceania increased from 44.2 million in 2020 to 46.7 million vehicles in 2021.
Elementis Plc, Golcha Minerals Pvt Ltd, Imerys SA, IMI Fabi SpA, Liaoning Aihai Talc Co Ltd, Minerals Technologies Inc, Nippon Talc Co Ltd, SCR-Sibelco NV, Sun Minerals Pvt Ltd, and Xilolite SA are key players operating in the global talc market. Market players focus on providing high-quality products to fulfill customer demand. They are also adopting strategies such as investments in research and development activities and new product launches.
The overall global talc market size has been derived using both primary and secondary sources. To begin the research process, exhaustive secondary research has been conducted using internal and external sources to obtain qualitative and quantitative information related to the market. Also, multiple primary interviews have been conducted with industry participants to validate the data and gain more analytical insights into the topic. Participants of this process include industry experts such as VPs, business development managers, market intelligence managers, and national sales managers, along with external consultants such as valuation experts, research analysts, and key opinion leaders, specializing in the talc market.
Reasons to Buy:
- Progressive industry trends in the talc market to help players develop effective long-term strategies
- Business growth strategies adopted by developed and developing markets
- Quantitative analysis of the talc market from 2020 to 2028
- Estimation of the demand for talc across various industries
- Porter's Five Forces analysis to illustrate the efficacy of buyers and suppliers operating in the industry to predict the market growth
- Recent developments to understand the competitive market scenario and the demand for talc compounds across the globe
- Market trends and outlook coupled with factors driving and restraining the growth of the talc market.
- Decision-making process by understanding strategies that underpin commercial interest concerning the global talc market growth
- The global talc market size at various nodes of market
- Detailed overview and segmentation of the talc market as well as its dynamics in the industry
- The talc market size in different regions with promising growth opportunities
Table Of Contents
1. Introduction
- 1.1 The Insight Partners Research Report Guidance
- 1.2 Market Segmentation
2. Executive Summary
- 2.1 Key Insights
- 2.2 Market Attractiveness
3. Research Methodology
- 3.1 Coverage
- 3.2 Secondary Research
- 3.3 Primary Research
4. Global Talc Market Landscape
- 4.1 Overview
- 4.2 Porter's Five Forces Analysis
- 4.2.1 Threat of New Entrants:
- 4.2.2 Bargaining Power of Suppliers:
- 4.2.3 Bargaining Power of Buyers:
- 4.2.4 Competitive Rivalry:
- 4.2.5 Threat of Substitutes:
- 4.3 Ecosystem Analysis
- 4.3.1 Overview:
- 4.3.2 Mining:
- 4.3.3 Processing and Grinding
- 4.3.4 Product Distribution or Supply
- 4.3.5 End-Use Industries
5. Global Talc Market - Key Market Dynamics
- 5.1 Market Drivers
- 5.1.1 Growing Use of Talc in Paper & Pulp Industry
- 5.1.2 Increasing Demand from Various End-Use Industries
- 5.2 Market Restraints
- 5.2.1 Health Concerns Related to Usage of Talc
- 5.3 Market Opportunities
- 5.3.1 Growth of Ceramics Industry
- 5.4 Future Trends
- 5.4.1 Growing Demand for Plastics in Automotive Industry
- 5.5 Impact Analysis
6. Talc Market - Global Market Analysis
- 6.1 Global Talc Market Revenue (US$ Million)
- 6.2 Global Talc Market Volume (Kilo Tons)
- 6.3 Global Talc Market Forecast and Analysis
7. Global Talc Market Analysis - Type
- 7.1 Talc Chlorite
- 7.1.1 Overview
- 7.1.2 Talc Chlorite Market Revenue and Forecast to 2030 (US$ Million)
- 7.1.3 Talc Chlorite Market Volume and Forecast to 2030 (Kilo Tons)
- 7.2 Talc Carbonate
- 7.2.1 Overview
- 7.2.2 Talc Carbonate Market Revenue and Forecast to 2030 (US$ Million)
- 7.2.3 Talc Carbonate Market Volume and Forecast to 2030 (Kilo Tons)
8. Global Talc Market Analysis - Application
- 8.1 Plastics
- 8.1.1 Overview
- 8.1.2 Plastics Market Revenue and Forecast to 2030 (US$ Million)
- 8.2 Pulp and Paper
- 8.2.1 Overview
- 8.2.2 Pulp and Paper Market Revenue and Forecast to 2030 (US$ Million)
- 8.3 Ceramics
- 8.3.1 Overview
- 8.3.2 Ceramics Market Revenue and Forecast to 2030 (US$ Million)
- 8.4 Paints and Coatings
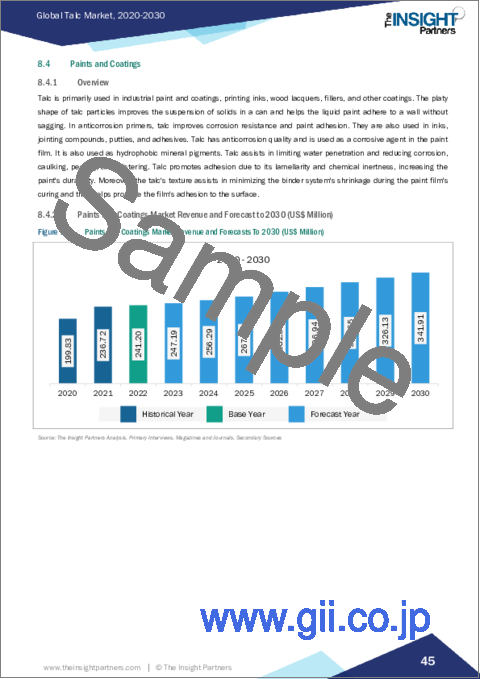
- 8.4.1 Overview
- 8.4.2 Paints and Coatings Market Revenue and Forecast to 2030 (US$ Million)
- 8.5 Rubber
- 8.5.1 Overview
- 8.5.2 Rubber Market Revenue and Forecast to 2030 (US$ Million)
- 8.5.3 Pharmaceuticals
- 8.5.3.1.1 Pharmaceuticals Market Revenue and Forecast to 2028 (US$ Million)
- 8.5.4 Food
- 8.5.4.1.1 Food Market Revenue and Forecast to 2028 (US$ Million)
- 8.6 Others
- 8.6.1 Overview
- 8.6.2 Others Market Revenue and Forecast to 2030 (US$ Million)
9. Global Talc Market - Geographical Analysis
- 9.1 North America
- 9.1.1 North America Talc Market Overview
- 9.1.2 North America Talc Market Revenue and Forecasts to 2030 (US$ Million)
- 9.1.3 North America Talc Market Volume and Forecasts to 2030 (Kilo Tons)
- 9.1.4 North America Talc Market Breakdown by Type
- 9.1.4.1 North America Talc Market Revenue and Forecasts and Analysis - By Type
- 9.1.4.2 North America Talc Market Volume and Forecasts and Analysis - By Type
- 9.1.5 North America Talc Market Breakdown by Application
- 9.1.5.1 North America Talc Market Revenue and Forecasts and Analysis - By Application
- 9.1.6 North America Talc Market Revenue and Forecasts and Analysis - By Countries
- 9.1.6.1 North America Talc Market Breakdown by Country
- 9.1.6.2 US Talc Market Revenue and Forecasts to 2030 (US$ Million)
- 9.1.6.3 US Talc Market Volume and Forecasts to 2030 (Kilo Tons)
- 9.1.6.3.1 US Talc Market Breakdown by Type
- 9.1.6.3.2 US Talc Market Breakdown by Application
- 9.1.6.4 Canada Talc Market Revenue and Forecasts to 2030 (US$ Million)
- 9.1.6.5 Canada Talc Market Volume and Forecasts to 2030 (Kilo Tons)
- 9.1.6.5.1 Canada Talc Market Breakdown by Type
- 9.1.6.5.2 Canada Talc Market Breakdown by Application
- 9.1.6.6 Mexico Talc Market Revenue and Forecasts to 2030 (US$ Million)
- 9.1.6.7 Mexico Talc Market Volume and Forecasts to 2030 (Kilo Tons)
- 9.1.6.7.1 Mexico Talc Market Breakdown by Type
- 9.1.6.7.2 Mexico Talc Market Breakdown by Application
- 9.2 Europe
- 9.2.1 Europe Talc Market Overview
- 9.2.2 Europe Talc Market Revenue and Forecasts to 2030 (US$ Million)
- 9.2.3 Europe Talc Market Volume and Forecasts to 2030 (Kilo Tons)
- 9.2.4 Europe Talc Market Breakdown by Type
- 9.2.4.1 Europe Talc Market Revenue and Forecasts and Analysis - By Type
- 9.2.4.2 Europe Talc Market Volume and Forecasts and Analysis - By Type
- 9.2.5 Europe Talc Market Breakdown by Application
- 9.2.5.1 Europe Talc Market Revenue and Forecasts and Analysis - By Application
- 9.2.6 Europe Talc Market Revenue and Forecasts and Analysis - By Countries
- 9.2.6.1 Europe Talc Market Breakdown by Country
- 9.2.6.2 Germany Talc Market Revenue and Forecasts to 2030 (US$ Million)
- 9.2.6.3 Germany Talc Market Volume and Forecasts to 2030 (Kilo Tons)
- 9.2.6.3.1 Germany Talc Market Breakdown by Type
- 9.2.6.3.2 Germany Talc Market Breakdown by Application
- 9.2.6.4 France Talc Market Revenue and Forecasts to 2030 (US$ Million)
- 9.2.6.5 France Talc Market Volume and Forecasts to 2030 (Kilo Tons)
- 9.2.6.5.1 France Talc Market Breakdown by Type
- 9.2.6.5.2 France Talc Market Breakdown by Application
- 9.2.6.6 Italy Talc Market Revenue and Forecasts to 2030 (US$ Million)
- 9.2.6.7 Italy Talc Market Volume and Forecasts to 2030 (Kilo Tons)
- 9.2.6.7.1 Italy Talc Market Breakdown by Type
- 9.2.6.7.2 Italy Talc Market Breakdown by Application
- 9.2.6.8 UK Talc Market Revenue and Forecasts to 2030 (US$ Million)
- 9.2.6.9 UK Talc Market Volume and Forecasts to 2030 (Kilo Tons)
- 9.2.6.9.1 UK Talc Market Breakdown by Type
- 9.2.6.9.2 UK Talc Market Breakdown by Application
- 9.2.6.10 Russia Talc Market Revenue and Forecasts to 2030 (US$ Million)
- 9.2.6.11 Russia Talc Market Volume and Forecasts to 2030 (Kilo Tons)
- 9.2.6.11.1 Russia Talc Market Breakdown by Type
- 9.2.6.11.2 Russia Talc Market Breakdown by Application
- 9.2.6.12 Rest of Europe Talc Market Revenue and Forecasts to 2030 (US$ Million)
- 9.2.6.13 Rest of Europe Talc Market Volume and Forecasts to 2030 (Kilo Tons)
- 9.2.6.13.1 Rest of Europe Talc Market Breakdown by Type
- 9.2.6.13.2 Rest of Europe Talc Market Breakdown by Application
- 9.3 Asia Pacific Talc Market
- 9.3.1 Overview
- 9.3.2 Asia Pacific Talc Market Revenue and Forecasts To 2030 (US$ Million)
- 9.3.3 Asia Pacific Talc Market Volume and Forecasts To 2030 (Kilo Tons)
- 9.3.4 Asia Pacific Talc Market Breakdown by Type
- 9.3.4.1 Asia Pacific Talc Market Revenue and Forecasts and Analysis - By Type
- 9.3.4.2 Asia Pacific Talc Market Volume and Forecasts and Analysis - By Type
- 9.3.5 Asia Pacific Talc Market Breakdown by Application
- 9.3.5.1 Asia Pacific Talc Market Revenue and Forecasts and Analysis - By Application
- 9.3.6 Asia Pacific Talc Market Breakdown by Country
- 9.3.6.1 Asia Pacific Talc Market Breakdown by Country
- 9.3.6.2 Australia Talc Market Revenue and Forecasts to 2030 (US$ Million)
- 9.3.6.3 Australia Talc Market Volume and Forecasts to 2030 (Kilo Tons)
- 9.3.6.3.1 Australia Talc Market Breakdown by Type
- 9.3.6.3.2 Australia Talc Market Breakdown by Application
- 9.3.6.4 China Talc Market Revenue and Forecasts to 2030 (US$ Million)
- 9.3.6.5 China Talc Market Volume and Forecasts to 2030 (Kilo Tons)
- 9.3.6.5.1 China Talc Market Breakdown by Type
- 9.3.6.5.2 China Talc Market Breakdown by Application
- 9.3.6.6 India Talc Market Revenue and Forecasts to 2030 (US$ Million)
- 9.3.6.7 India Talc Market Volume and Forecasts to 2030 (Kilo Tons)
- 9.3.6.7.1 India Talc Market Breakdown by Type
- 9.3.6.7.2 India Talc Market Breakdown by Application
- 9.3.6.8 Japan Talc Market Revenue and Forecasts to 2030 (US$ Million)
- 9.3.6.9 Japan Talc Market Volume and Forecasts to 2030 (Kilo Tons)
- 9.3.6.9.1 Japan Talc Market Breakdown by Type
- 9.3.6.9.2 Japan Talc Market Breakdown by Application
- 9.3.6.10 South Korea Talc Market Revenue and Forecasts to 2030 (US$ Million)
- 9.3.6.11 South Korea Talc Market Volume and Forecasts to 2030 (Kilo Tons)
- 9.3.6.11.1 South Korea Talc Market Breakdown by Type
- 9.3.6.11.2 South Korea Talc Market Breakdown by Application
- 9.3.6.12 Rest of Asia Pacific Talc Market Revenue and Forecasts to 2030 (US$ Million)
- 9.3.6.13 Rest of Asia Pacific Talc Market Volume and Forecasts to 2030 (Kilo Tons)
- 9.3.6.13.1 Rest of Asia Pacific Talc Market Breakdown by Type
- 9.3.6.13.2 Rest of Asia Pacific Talc Market Breakdown by Application
- 9.4 Middle East and Africa
- 9.4.1 Middle East and Africa Talc Market Overview
- 9.4.2 Middle East and Africa Talc Market Revenue and Forecasts to 2030 (US$ Million)
- 9.4.3 Middle East and Africa Talc Market Volume and Forecasts to 2030 (Kilo Tons)
- 9.4.4 Middle East and Africa Talc Market Breakdown by Type
- 9.4.4.1 Middle East and Africa Talc Market Revenue and Forecasts and Analysis - By Type
- 9.4.4.2 Middle East and Africa Talc Market Volume and Forecasts and Analysis - By Type
- 9.4.5 Middle East and Africa Talc Market Breakdown by Application
- 9.4.5.1 Middle East and Africa Talc Market Revenue and Forecasts and Analysis - By Application
- 9.4.6 Middle East and Africa Talc Market Revenue and Forecasts and Analysis - By Countries
- 9.4.6.1 Middle East and Africa Talc Market Breakdown by Country
- 9.4.6.2 South Africa Talc Market Revenue and Forecasts to 2030 (US$ Million)
- 9.4.6.3 South Africa Talc Market Volume and Forecasts to 2030 (Kilo Tons)
- 9.4.6.3.1 South Africa Talc Market Breakdown by Type
- 9.4.6.3.2 South Africa Talc Market Breakdown by Application
- 9.4.6.4 Saudi Arabia Talc Market Revenue and Forecasts to 2030 (US$ Million)
- 9.4.6.5 Saudi Arabia Talc Market Volume and Forecasts to 2030 (Kilo Tons)
- 9.4.6.5.1 Saudi Arabia Talc Market Breakdown by Type
- 9.4.6.5.2 Saudi Arabia Talc Market Breakdown by Application
- 9.4.6.6 UAE Talc Market Revenue and Forecasts to 2030 (US$ Million)
- 9.4.6.7 UAE Talc Market Volume and Forecasts to 2030 (Kilo Tons)
- 9.4.6.7.1 UAE Talc Market Breakdown by Type
- 9.4.6.7.2 UAE Talc Market Breakdown by Application
- 9.4.6.8 Rest of MEA Talc Market Revenue and Forecasts to 2030 (US$ Million)
- 9.4.6.9 Rest of MEA Talc Market Volume and Forecasts to 2030 (Kilo Tons)
- 9.4.6.9.1 Rest of MEA Talc Market Breakdown by Type
- 9.4.6.9.2 Rest of MEA Talc Market Breakdown by Application
- 9.5 South and Central America
- 9.5.1 South and Central America Talc Market Overview
- 9.5.2 South and Central America Talc Market Revenue and Forecasts to 2030 (US$ Million)
- 9.5.3 South and Central America Talc Market Volume and Forecasts to 2030 (Kilo Tons)
- 9.5.4 South and Central America Talc Market Breakdown by Type
- 9.5.4.1 South and Central America Talc Market Revenue and Forecasts and Analysis - By Type
- 9.5.4.2 South and Central America Talc Market Volume and Forecasts and Analysis - By Type
- 9.5.5 South and Central America Talc Market Breakdown by Application
- 9.5.5.1 South and Central America Talc Market Revenue and Forecasts and Analysis - By Application
- 9.5.6 South and Central America Talc Market Revenue and Forecasts and Analysis - By Countries
- 9.5.6.1 South and Central America Talc Market Breakdown by Country
- 9.5.6.2 Brazil Talc Market Revenue and Forecasts to 2030 (US$ Million)
- 9.5.6.3 Brazil Talc Market Volume and Forecasts to 2030 (Kilo Tons)
- 9.5.6.3.1 Brazil Talc Market Breakdown by Type
- 9.5.6.3.2 Brazil Talc Market Breakdown by Application
- 9.5.6.4 Argentina Talc Market Revenue and Forecasts to 2030 (US$ Million)
- 9.5.6.5 Argentina Talc Market Volume and Forecasts to 2030 (Kilo Tons)
- 9.5.6.5.1 Argentina Talc Market Breakdown by Type
- 9.5.6.5.2 Argentina Talc Market Breakdown by Application
- 9.5.6.6 Rest of SAM Talc Market Revenue and Forecasts to 2030 (US$ Million)
- 9.5.6.7 Rest of SAM Talc Market Volume and Forecasts to 2030 (Kilo Tons)
- 9.5.6.7.1 Rest of SAM Talc Market Breakdown by Type
- 9.5.6.7.2 Rest of SAM Talc Market Breakdown by Application
10. Impact of COVID-19 Pandemic on Global Talc Market
- 10.1 Pre & Post Covid-19 Impact
11. Competitive Landscape
- 11.1 Heat Map Analysis by Key Players
- 11.2 Company Positioning & Concentration
12. Industry Landscape
- 12.1 Overview
- 12.2 Merger and Acquisition
- 12.3 Other Business Strategies
13. Company Profiles
- 13.1 Elementis Plc
- 13.1.1 Key Facts
- 13.1.2 Business Description
- 13.1.3 Products and Services
- 13.1.4 Financial Overview
- 13.1.5 SWOT Analysis
- 13.1.6 Key Developments
- 13.2 Golcha Minerals Pvt Ltd
- 13.2.1 Key Facts
- 13.2.2 Business Description
- 13.2.3 Products and Services
- 13.2.4 Financial Overview
- 13.2.5 SWOT Analysis
- 13.2.6 Key Developments
- 13.3 Imerys SA
- 13.3.1 Key Facts
- 13.3.2 Business Description
- 13.3.3 Products and Services
- 13.3.4 Financial Overview
- 13.3.5 SWOT Analysis
- 13.3.6 Key Developments
- 13.4 IMI Fabi SpA
- 13.4.1 Key Facts
- 13.4.2 Business Description
- 13.4.3 Products and Services
- 13.4.4 Financial Overview
- 13.4.5 SWOT Analysis
- 13.4.6 Key Developments
- 13.5 Liaoning Aihai Talc Co Ltd
- 13.5.1 Key Facts
- 13.5.2 Business Description
- 13.5.3 Products and Services
- 13.5.4 Financial Overview
- 13.5.5 SWOT Analysis
- 13.5.6 Key Developments
- 13.6 Minerals Technologies Inc
- 13.6.1 Key Facts
- 13.6.2 Business Description
- 13.6.3 Products and Services
- 13.6.4 Financial Overview
- 13.6.5 SWOT Analysis
- 13.6.6 Key Developments
- 13.7 Nippon Talc Co Ltd
- 13.7.1 Key Facts
- 13.7.2 Business Description
- 13.7.3 Products and Services
- 13.7.4 Financial Overview
- 13.7.5 SWOT Analysis
- 13.7.6 Key Developments
- 13.8 SCR-Sibelco NV
- 13.8.1 Key Facts
- 13.8.2 Business Description
- 13.8.3 Products and Services
- 13.8.4 Financial Overview
- 13.8.5 SWOT Analysis
- 13.8.6 Key Developments
- 13.9 Sun Minerals Pvt Ltd
- 13.9.1 Key Facts
- 13.9.2 Business Description
- 13.9.3 Products and Services
- 13.9.4 Financial Overview
- 13.9.5 SWOT Analysis
- 13.9.6 Key Developments
- 13.10 Xilolite SA
- 13.10.1 Key Facts
- 13.10.2 Business Description
- 13.10.3 Products and Services
- 13.10.4 Financial Overview
- 13.10.5 SWOT Analysis
- 13.10.6 Key Developments