|
|
市場調査レポート
商品コード
1510773
アジア太平洋地域のタルク市場:2030年予測と地域別分析-沈殿物タイプ別、最終用途産業別Asia Pacific Talc Market Forecast to 2030 - Regional Analysis - by Deposit Type (Talc Chlorite and Talc Carbonate) and End-Use Industry (Plastics, Pulp & Paper, Ceramics, Paints & Coatings, Rubber, Pharmaceuticals, Food, and Others) |
||||||
|
|||||||
|
|||||||

| アジア太平洋地域のタルク市場:2030年予測と地域別分析-沈殿物タイプ別、最終用途産業別 |
|
出版日: 2024年05月07日
発行: The Insight Partners
ページ情報: 英文 86 Pages
納期: 即納可能
|

全表示
- 概要
- 図表
- 目次
アジア太平洋地域のタルク市場は、2022年の9億4,038万米ドルから2030年には14億7,084万米ドルに成長すると予想されています。2022年から2030年までのCAGRは5.8%と推定されます。
様々な最終用途産業からの需要増加がアジア太平洋地域のタルク市場を後押し
タルクは塗料・コーティング、プラスチック、農業、食品など様々な最終用途産業で使用されています。塗料業界では、タルクの使用は塗料製造における主顔料の使用を減らし、製造コストを削減します。タルクは塗膜を強化し、塗料の耐久性と防汚性を向上させます。また、防錆・耐食性があるため、仕上がりが長持ちします。また、エクステンダーとしてのタルクは塗料の粘度を高めます。建設、自動車、工業分野の力強い成長は、塗料とコーティング剤の需要を促進しています。プラスチック業界では、タルクの使用は、品質、アスペクト比、粒度分布、白色度などのプラスチックの特性を向上させます。自動車、建設、消費財、電気・電子、その他の産業におけるプラスチックの高い需要は、タルクの必要性を高めています。農業分野では、タルクは効果的な固結防止剤であり、農薬や肥料の分散剤でもあります。また、農薬では、タルクは理想的な不活性キャリアとして考えられています。様々な地域における農業生産の増加による肥料需要の増加は、タルクの必要性を高めています。さらに、食品用タルクは疎水性です。そのため、他の物質をコーティングして撥水化することで、固結防止剤として機能します。また、ダマの形成も防ぐ。この特性により、タルクはでんぷん、チョコレート、チューインガム、焼き菓子、ドライフルーツ、チーズ、調味料、食卓塩などに使用される理想的な原料となっています。これらすべての製品に対する需要の高まりが、食品業界におけるタルクの使用を後押ししています。したがって、最終用途産業からのタルク需要の高まりは、タルク市場の成長を推進しています。
アジア太平洋地域のタルク市場概要
オーストラリア、中国、インド、日本、韓国はアジア太平洋地域のタルク市場の主要貢献国です。アジア太平洋地域は世界最大のタルク産地です。この地域には、自動車部品用の軽量プラスチックを生産する主要メーカーがあります。急速な工業化と新興国の中間層の可処分所得の急増が、アジア太平洋地域のタルク需要を牽引すると予想されています。国際自動車工業会(OICA)によると、アジア・オセアニア地域の自動車生産台数は2020年の4,420万台から2021年には4,670万台に増加します。電気自動車生産台数の増加に伴う同地域の自動車部品・コンポーネントの市場開拓は、タルク市場に有利な機会を生み出すと思われます。大手自動車メーカーによる広範な技術革新と試作品が市場成長の原動力となっています。地域の建設活動の増加、工業と自動車セクターの成長は、市場の成長をさらに加速させる。同地域の低コスト生産は、アジア太平洋、特に中国とインドの世界企業に絶好の機会を提供しています。持続可能な開発目標2030」の下、アジア開発銀行はアジア太平洋地域における強靭なインフラの構築、包括的で持続可能な工業化の促進、イノベーションの促進を計画しています。さらに、中国、インド、韓国などの国々では、オンフリート車の台数が増加しており、セラミックや塗料・コーティングなどの建築材料の需要を促進しています。これら全ての要因がアジア太平洋におけるタルク市場の成長を促進しています。
アジア太平洋地域のタルク市場の収益と2030年までの予測
アジア太平洋地域のタルク市場セグメンテーション
アジア太平洋地域のタルク市場は、タイプ、用途、国に区分されます。
タイプ別では、アジア太平洋地域のタルク市場はタルククロライトとタルクカーボネートに二分されます。2022年のアジア太平洋地域のタルク市場では、炭酸タルクセグメントが大きなシェアを占めています。
用途別では、アジア太平洋地域のタルク市場はプラスチック、パルプ・製紙、セラミック、塗料・コーティング、ゴム、医薬品、食品、その他に区分されます。2022年のアジア太平洋地域のタルク市場では、パルプ・製紙分野が最大のシェアを占めています。
国別では、アジア太平洋地域のタルク市場はオーストラリア、中国、インド、日本、韓国、その他アジア太平洋地域に区分されます。2022年のアジア太平洋地域のタルク市場は中国が独占。
Elementis Plc、Golcha Minerals Pvt Ltd、Imerys SA、IMI Fabi SpA、Liaoning Aihai Talc Co Ltd、Minerals Technologies Inc、Nippon Talc Co Ltd、SCR-Sibelco NV、Sun Minerals Pvt Ltdは、アジア太平洋地域のタルク市場で事業を展開している大手企業です。
目次
第1章 イントロダクション
第2章 エグゼクティブサマリー
- 主要洞察
- 市場の魅力
第3章 調査手法
- 調査範囲
- 2次調査
- 1次調査
第4章 アジア太平洋地域のタルク市場情勢
- ポーターのファイブフォース分析
- 新規参入業者の脅威
- 供給企業の交渉力
- 買い手の交渉力:新規参入の脅威
- 競争企業間の敵対関係
- 代替品の脅威
- エコシステム分析
- 採掘
- 加工と粉砕
- 製品の流通または供給
- 最終用途産業
第5章 アジア太平洋地域のタルク市場:主要市場力学
- 市場促進要因
- 紙・パルプ産業におけるタルク使用の増加
- 様々な最終用途産業からの需要増加
- 市場抑制要因
- タルクの使用に関する健康上の懸念
- 市場機会
- セラミックス産業の成長
- 今後の動向
- 自動車産業におけるプラスチックの需要拡大
- 影響分析
第6章 タルク市場-アジア太平洋市場分析
- アジア太平洋地域のタルク市場収益
- アジア太平洋地域のタルク市場数量
- アジア太平洋地域のタルク市場予測・分析
第7章 アジア太平洋地域のタルク市場:種類別
- タルククロライト
- タルククロライト市場の収益と2030年までの予測
- 炭酸タルク
- 炭酸タルク市場の収益と2030年までの予測
第8章 アジア太平洋地域のタルク市場:用途別
- プラスチック
- プラスチック市場の収益と2030年までの予測
- パルプと紙
- 紙とパルプ市場の収益と2030年までの予測
- セラミックス
- セラミックス市場の収益と2030年までの予測
- 塗料
- 塗料市場の収益と2030年までの予測
- ゴム
- ゴム市場の収益と2030年までの予測
- 医薬品
- 医薬品市場の収益と2030年までの予測
- 食品
- 食品市場の収益と2030年までの予測
- その他
- その他市場の収益と2030年までの予測
第9章 アジア太平洋地域のタルク市場:国別分析
- オーストラリア
- 中国
- インド
- 日本
- 韓国
- その他アジア太平洋地域
第10章 業界情勢
- 合併と買収
- その他の事業戦略
第11章 企業プロファイル
- Elementis Plc
- Golcha Minerals Pvt Ltd
- Imerys SA
- IMI Fabi SpA
- Liaoning Aihai Talc Co Ltd
- Minerals Technologies Inc
- Nippon Talc Co Ltd
- SCR-Sibelco NV
- Sun Minerals Pvt Ltd
第12章 付録
List Of Tables
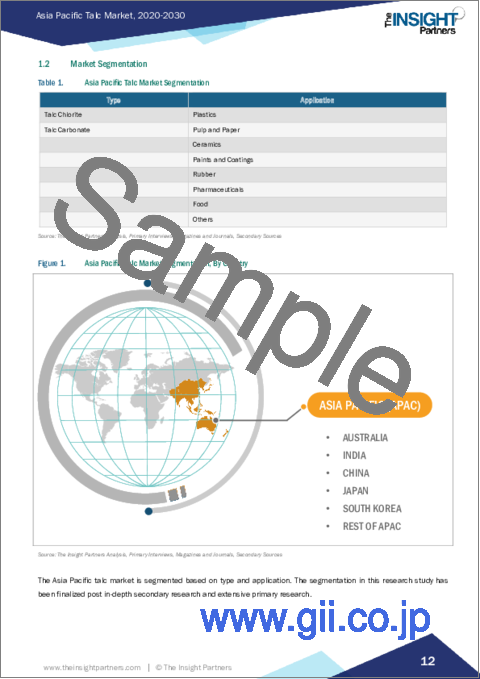
- Table 1. Asia Pacific Talc Market Segmentation
- Table 2. Asia Pacific Talc Market Revenue and Forecasts to 2030 (US$ Million)
- Table 3. Asia Pacific Talc Market Volume and Forecasts to 2030 (Kilo tons)
- Table 4. Asia Pacific Talc Market Revenue and Forecasts to 2030 (US$ Million) - Type
- Table 5. Asia Pacific Talc Market Volume and Forecasts to 2030 (Kilo tons) - Type
- Table 6. Asia Pacific Talc Market Revenue and Forecasts to 2030 (US$ Million) - Application
- Table 7. Australia Talc Market Revenue and Forecasts to 2030 (US$ Million) - By Type
- Table 8. Australia Talc Market Volume and Forecasts to 2030 (Kilo tons) - By Type
- Table 9. Australia Talc Market Revenue and Forecasts to 2030 (US$ Million) - By Application
- Table 10. China Talc Market Revenue and Forecasts to 2030 (US$ Million) - By Type
- Table 11. China Talc Market Volume and Forecasts to 2030 (Kilo tons) - By Type
- Table 12. China Talc Market Revenue and Forecasts to 2030 (US$ Million) - By Application
- Table 13. India Talc Market Revenue and Forecasts to 2030 (US$ Million) - By Type
- Table 14. India Talc Market Volume and Forecasts to 2030 (Kilo tons) - By Type
- Table 15. India Talc Market Revenue and Forecasts to 2030 (US$ Million) - By Application
- Table 16. Japan Talc Market Revenue and Forecasts to 2030 (US$ Million) - By Type
- Table 17. Japan Talc Market Volume and Forecasts to 2030 (Kilo tons) - By Type
- Table 18. Japan Talc Market Revenue and Forecasts to 2030 (US$ Million) - By Application
- Table 19. South Korea Talc Market Revenue and Forecasts to 2030 (US$ Million) - By Type
- Table 20. South Korea Talc Market Volume and Forecasts to 2030 (Kilo tons) - By Type
- Table 21. South Korea Talc Market Revenue and Forecasts to 2030 (US$ Million) - By Application
- Table 22. Rest of Asia Pacific Talc Market Revenue and Forecasts to 2030 (US$ Million) - By Type
- Table 23. Rest of Asia Pacific Talc Market Volume and Forecasts to 2030 (Kilo tons) - By Type
- Table 24. Rest of Asia Pacific Talc Market Revenue and Forecasts to 2030 (US$ Million) - By Application
List Of Figures
- Figure 1. Asia Pacific Talc Market Segmentation, By Country
- Figure 2. Talc Market - Porter's Five Forces Analysis
- Figure 3. Ecosystem: Asia Pacific Talc Market
- Figure 4. Market Dynamics: Asia Pacific Talc Market
- Figure 5. Asia Pacific Talc Market Impact Analysis of Drivers and Restraints
- Figure 6. Asia Pacific Talc Market Revenue (US$ Million), 2020 - 2030
- Figure 7. Asia Pacific Talc Market Volume (Kilo tons), 2020 - 2030
- Figure 8. Asia Pacific Talc Market Share (%) - Type, 2022 and 2030
- Figure 9. Talc Chlorite Market Revenue and Forecasts to 2030 (US$ Million)
- Figure 10. Talc Chlorite Market Volume and Forecasts to 2030 (Kilo tons)
- Figure 11. Talc Carbonate Market Revenue and Forecasts to 2030 (US$ Million)
- Figure 12. Talc Carbonate Market Volume and Forecasts to 2030 (Kilo tons)
- Figure 13. Asia Pacific Talc Market Share (%) - Application, 2022 and 2030
- Figure 14. Plastics Market Revenue and Forecasts to 2030 (US$ Million)
- Figure 15. Pulp and Paper Market Revenue and Forecasts to 2030 (US$ Million)
- Figure 16. Ceramics Market Revenue and Forecasts to 2030 (US$ Million)
- Figure 17. Paints and Coatings Market Revenue and Forecasts to 2030 (US$ Million)
- Figure 18. Rubber Market Revenue and Forecasts to 2030 (US$ Million)
- Figure 19. Pharmaceuticals Market Revenue and Forecasts to 2030 (US$ Million)
- Figure 20. Food Market Revenue and Forecasts to 2030 (US$ Million)
- Figure 21. Others Market Revenue and Forecasts to 2030 (US$ Million)
- Figure 22. Asia Pacific Talc Market, By Key Country - Revenue 2022 (US$ Million)
- Figure 23. Asia Pacific Talc Market Breakdown by Key Countries, 2022 and 2030 (%)
- Figure 24. Australia Talc Market Revenue and Forecasts to 2030 (US$ Million)
- Figure 25. Australia Talc Market Volume and Forecasts to 2030 (Kilo tons)
- Figure 26. China Talc Market Revenue and Forecasts to 2030 (US$ Million)
- Figure 27. China Talc Market Volume and Forecasts to 2030 (Kilo tons)
- Figure 28. India Talc Market Revenue and Forecasts to 2030 (US$ Million)
- Figure 29. India Talc Market Volume and Forecasts to 2030 (Kilo tons)
- Figure 30. Japan Talc Market Revenue and Forecasts to 2030 (US$ Million)
- Figure 31. Japan Talc Market Volume and Forecasts to 2030 (Kilo tons)
- Figure 32. South Korea Talc Market Revenue and Forecasts to 2030 (US$ Million)
- Figure 33. South Korea Talc Market Volume and Forecasts to 2030 (Kilo tons)
- Figure 34. Rest of Asia Pacific Talc Market Revenue and Forecasts to 2030 (US$ Million)
- Figure 35. Rest of Asia Pacific Talc Market Volume and Forecasts to 2030 (Kilo tons)
The Asia Pacific talc market is expected to grow from US$ 940.38 million in 2022 to US$ 1,470.84 million by 2030. It is estimated to grow at a CAGR of 5.8% from 2022 to 2030.
Increasing Demand from Various End-Use Industries Fuels Asia Pacific Talc Market
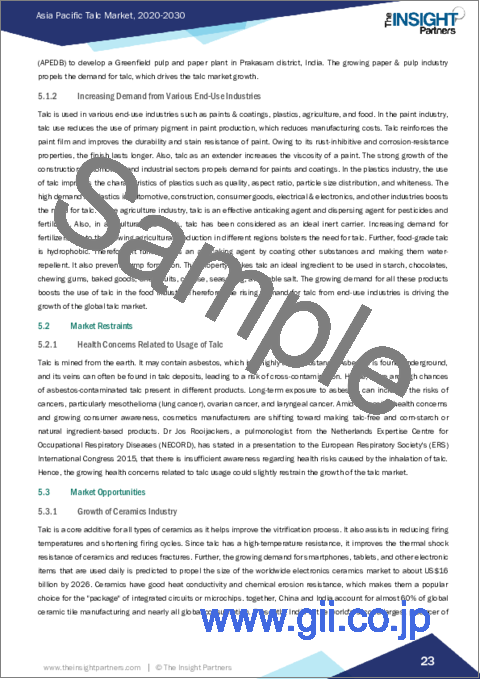
Talc is used in various end-use industries such as paints & coatings, plastics, agriculture, and food. In the paint industry, talc use reduces the use of primary pigment in paint production, which reduces manufacturing costs. Talc reinforces the paint film and improves the durability and stain resistance of paint. Owing to its rust-inhibitive and corrosion-resistance properties, the finish lasts longer. Also, talc as an extender increases the viscosity of a paint. The strong growth of the construction, automotive, and industrial sectors propels demand for paints and coatings. In the plastics industry, the use of talc improves the characteristics of plastics such as quality, aspect ratio, particle size distribution, and whiteness. The high demand for plastics in automotive, construction, consumer goods, electrical & electronics, and other industries boosts the need for talc. In the agriculture industry, talc is an effective anticaking agent and dispersing agent for pesticides and fertilizers. Also, in agricultural chemicals, talc has been considered as an ideal inert carrier. Increasing demand for fertilizers due to the growing agricultural production in different regions bolsters the need for talc. Further, food-grade talc is hydrophobic. Therefore, it functions as an anticaking agent by coating other substances and making them water-repellent. It also prevents lump formation. This property makes talc an ideal ingredient to be used in starch, chocolates, chewing gums, baked goods, dried fruits, cheese, seasoning, and table salt. The growing demand for all these products boosts the use of talc in the food industry. Therefore, the rising demand for talc from end-use industries is driving the growth of the talc market.
Asia Pacific Talc Market Overview
Australia, China, India, Japan, and South Korea are the key contributors to the talc market in Asia Pacific. Asia Pacific is one of the largest crudes and processed talc-producing regions globally. The region is home to major manufacturers producing lightweight plastics for automotive components. Rapid industrialization and a surge in disposable income of the middle-class population of emerging economies are expected to drive the demand for talc in Asia Pacific. According to the International Organization of Motor Vehicle Manufacturers (OICA), the Asia-Oceania region's vehicle production increased from 44.2 million in 2020 to 46.7 million vehicles in 2021. The development of automotive parts and components in the region with the rise of electric vehicle production will create lucrative opportunities for the talc market. Extensive innovation and prototyping from major automakers are driving the market growth. Rise in regional construction activities and growth of industrial and automotive sectors further accelerate the market growth. Low-cost production in the region provides an excellent opportunity for the global players in Asia Pacific, especially China and India. Under the Sustainable Development Goals 2030, the Asian Development Bank has planned to build resilient infrastructure, promote inclusive and sustainable industrialization, and foster innovation in Asia Pacific. Moreover, the rise in the number of on-fleet vehicles in countries such as China, India, and South Korea is fueling the demand for building materials such as ceramics and paints & coatings. All these factors are propelling the growth of the talc market in Asia Pacific.
Asia Pacific Talc Market Revenue and Forecast to 2030 (US$ Million)
Asia Pacific Talc Market Segmentation
The Asia Pacific talc market is segmented into type, application, and country.
Based on type, the Asia Pacific talc market is bifurcated into talc chlorite and talc carbonate. The talc carbonate segment held a larger share of the Asia Pacific talc market in 2022.
In terms of application, the Asia Pacific talc market is segmented into plastics, pulp and paper, ceramics, paints and coatings, rubber, pharmaceuticals, food, and others. The pulp and paper segment held the largest share of the Asia Pacific talc market in 2022.
By country, the Asia Pacific talc market is segmented into Australia, China, India, Japan, South Korea, and the Rest of Asia Pacific. China dominated the Asia Pacific talc market in 2022.
Elementis Plc, Golcha Minerals Pvt Ltd, Imerys SA, IMI Fabi SpA, Liaoning Aihai Talc Co Ltd, Minerals Technologies Inc, Nippon Talc Co Ltd, SCR-Sibelco NV, and Sun Minerals Pvt Ltd are some of the leading companies operating in the Asia Pacific talc market.
Table Of Contents
1. Introduction
- 1.1 The Insight Partners Research Report Guidance
- 1.2 Market Segmentation
2. Executive Summary
- 2.1 Key Insights
- 2.2 Market Attractiveness
3. Research Methodology
- 3.1 Coverage
- 3.2 Secondary Research
- 3.3 Primary Research
4. Asia Pacific Talc Market Landscape
- 4.1 Overview
- 4.2 Porter's Five Forces Analysis
- 4.2.1 Threat of New Entrants:
- 4.2.2 Bargaining Power of Suppliers:
- 4.2.3 Bargaining Power of Buyers:
- 4.2.4 Competitive Rivalry:
- 4.2.5 Threat of Substitutes:
- 4.3 Ecosystem Analysis
- 4.3.1 Overview:
- 4.3.2 Mining:
- 4.3.3 Processing and Grinding
- 4.3.4 Product Distribution or Supply
- 4.3.5 End-Use Industries
5. Asia Pacific Talc Market - Key Market Dynamics
- 5.1 Market Drivers
- 5.1.1 Growing Use of Talc in Paper & Pulp Industry
- 5.1.2 Increasing Demand from Various End-Use Industries
- 5.2 Market Restraints
- 5.2.1 Health Concerns Related to Usage of Talc
- 5.3 Market Opportunities
- 5.3.1 Growth of Ceramics Industry
- 5.4 Future Trends
- 5.4.1 Growing Demand for Plastics in Automotive Industry
- 5.5 Impact Analysis
6. Talc Market - Asia Pacific Market Analysis
- 6.1 Asia Pacific Talc Market Revenue (US$ Million)
- 6.2 Asia Pacific Talc Market Volume (Kilo tons)
- 6.3 Asia Pacific Talc Market Forecast and Analysis
7. Asia Pacific Talc Market Analysis - Type
- 7.1 Talc Chlorite
- 7.1.1 Overview
- 7.1.2 Talc Chlorite Market Revenue and Forecast to 2030 (US$ Million)
- 7.1.3 Talc Chlorite Market Volume and Forecast to 2030 (Kilo tons)
- 7.2 Talc Carbonate
- 7.2.1 Overview
- 7.2.2 Talc Carbonate Market Revenue and Forecast to 2030 (US$ Million)
- 7.2.3 Talc Carbonate Market Volume and Forecast to 2030 (Kilo tons)
8. Asia Pacific Talc Market Analysis - Application
- 8.1 Plastics
- 8.1.1 Overview
- 8.1.2 Plastics Market Revenue and Forecast to 2030 (US$ Million)
- 8.2 Pulp and Paper
- 8.2.1 Overview
- 8.2.2 Pulp and Paper Market Revenue and Forecast to 2030 (US$ Million)
- 8.3 Ceramics
- 8.3.1 Overview
- 8.3.2 Ceramics Market Revenue and Forecast to 2030 (US$ Million)
- 8.4 Paints and Coatings
- 8.4.1 Overview
- 8.4.2 Paints and Coatings Market Revenue and Forecast to 2030 (US$ Million)
- 8.5 Rubber
- 8.5.1 Overview
- 8.5.2 Rubber Market Revenue and Forecast to 2030 (US$ Million)
- 8.6 Pharmaceuticals
- 8.6.1 Overview
- 8.5.2 Pharmaceuticals Market Revenue and Forecast to 2030 (US$ Million)
- 8.6 Food
- 8.6.1 Overview
- 8.6.2 Food Market Revenue and Forecast to 2030 (US$ Million)
- 8.6 Others
- 8.6.1 Overview
- 8.6.2 Others Market Revenue and Forecast to 2030 (US$ Million)
9. Asia Pacific Talc Market - Country Analysis
- 9.1 Asia Pacific Talc Market
- 9.1.1 Overview
- 9.1.2 Asia Pacific Talc Market, By Key Country - Revenue 2022 (US$ Million)
- 9.1.3 Asia Pacific Talc Market Breakdown by Country
- 9.1.3.1 Asia Pacific Talc Market Breakdown by Country
- 9.1.3.2 Australia Talc Market Revenue and Forecasts to 2030 (US$ Million)
- 9.1.3.3 Australia Talc Market Volume and Forecasts to 2030 (Kilo tons)
- 9.1.3.3.1 Australia Talc Market Breakdown by Type
- 9.1.3.3.2 Australia Talc Market Breakdown by Application
- 9.1.3.4 China Talc Market Revenue and Forecasts to 2030 (US$ Million)
- 9.1.3.5 China Talc Market Volume and Forecasts to 2030 (Kilo tons)
- 9.1.3.5.1 China Talc Market Breakdown by Type
- 9.1.3.5.2 China Talc Market Breakdown by Application
- 9.1.3.6 India Talc Market Revenue and Forecasts to 2030 (US$ Million)
- 9.1.3.7 India Talc Market Volume and Forecasts to 2030 (Kilo tons)
- 9.1.3.7.1 India Talc Market Breakdown by Type
- 9.1.3.7.2 India Talc Market Breakdown by Application
- 9.1.3.8 Japan Talc Market Revenue and Forecasts to 2030 (US$ Million)
- 9.1.3.9 Japan Talc Market Volume and Forecasts to 2030 (Kilo tons)
- 9.1.3.9.1 Japan Talc Market Breakdown by Type
- 9.1.3.9.2 Japan Talc Market Breakdown by Application
- 9.1.3.10 South Korea Talc Market Revenue and Forecasts to 2030 (US$ Million)
- 9.1.3.11 South Korea Talc Market Volume and Forecasts to 2030 (Kilo tons)
- 9.1.3.11.1 South Korea Talc Market Breakdown by Type
- 9.1.3.11.2 South Korea Talc Market Breakdown by Application
- 9.1.3.12 Rest of Asia Pacific Talc Market Revenue and Forecasts to 2030 (US$ Million)
- 9.1.3.13 Rest of Asia Pacific Talc Market Volume and Forecasts to 2030 (Kilo tons)
- 9.1.3.13.1 Rest of Asia Pacific Talc Market Breakdown by Type
- 9.1.3.13.2 Rest of Asia Pacific Talc Market Breakdown by Application
10. Industry Landscape
- 10.1 Overview
- 10.2 Merger and Acquisition
- 10.3 Other Business Strategies
11. Company Profiles
- 11.1 Elementis Plc
- 11.1.1 Key Facts
- 11.1.2 Business Description
- 11.1.3 Products and Services
- 11.1.4 Financial Overview
- 11.1.5 SWOT Analysis
- 11.1.6 Key Developments
- 11.2 Golcha Minerals Pvt Ltd
- 11.2.1 Key Facts
- 11.2.2 Business Description
- 11.2.3 Products and Services
- 11.2.4 Financial Overview
- 11.2.5 SWOT Analysis
- 11.2.6 Key Developments
- 11.3 Imerys SA
- 11.3.1 Key Facts
- 11.3.2 Business Description
- 11.3.3 Products and Services
- 11.3.4 Financial Overview
- 11.3.5 SWOT Analysis
- 11.3.6 Key Developments
- 11.4 IMI Fabi SpA
- 11.4.1 Key Facts
- 11.4.2 Business Description
- 11.4.3 Products and Services
- 11.4.4 Financial Overview
- 11.4.5 SWOT Analysis
- 11.4.6 Key Developments
- 11.5 Liaoning Aihai Talc Co Ltd
- 11.5.1 Key Facts
- 11.5.2 Business Description
- 11.5.3 Products and Services
- 11.5.4 Financial Overview
- 11.5.5 SWOT Analysis
- 11.5.6 Key Developments
- 11.6 Minerals Technologies Inc
- 11.6.1 Key Facts
- 11.6.2 Business Description
- 11.6.3 Products and Services
- 11.6.4 Financial Overview
- 11.6.5 SWOT Analysis
- 11.6.6 Key Developments
- 11.7 Nippon Talc Co Ltd
- 11.7.1 Key Facts
- 11.7.2 Business Description
- 11.7.3 Products and Services
- 11.7.4 Financial Overview
- 11.7.5 SWOT Analysis
- 11.7.6 Key Developments
- 11.8 SCR-Sibelco NV
- 11.8.1 Key Facts
- 11.8.2 Business Description
- 11.8.3 Products and Services
- 11.8.4 Financial Overview
- 11.8.5 SWOT Analysis
- 11.8.6 Key Developments
- 11.9 Sun Minerals Pvt Ltd
- 11.9.1 Key Facts
- 11.9.2 Business Description
- 11.9.3 Products and Services
- 11.9.4 Financial Overview
- 11.9.5 SWOT Analysis
- 11.9.6 Key Developments

