|
|
市場調査レポート
商品コード
1375102
アジア太平洋の直接還元鉄(DRI)市場の2030年までの予測-地域別分析-形状、生産プロセス、用途別Asia Pacific Direct Reduced Iron (DRI) Market Forecast to 2030- COVID-19 Impact and Regional Analysis- by Form (Lumps, Pellets, and Fine), Production Process (Coal Based, and Gas Based), Application (Steel Making, and Construction) |
||||||
|
|
|||||||


| アジア太平洋の直接還元鉄(DRI)市場の2030年までの予測-地域別分析-形状、生産プロセス、用途別 |
|
出版日: 2023年08月22日
発行: The Insight Partners
ページ情報: 英文 117 Pages
納期: 即納可能
|
- 全表示
- 概要
- 図表
- 目次
アジア太平洋の直接還元鉄(DRI)市場は、2023年の160億1,113万米ドルから2030年には277億6,591万米ドルに成長すると予測されます。2023年から2030年までのCAGRは8.2%と推定されます。
鉄鋼生産と使用産業の増加がアジア太平洋直接還元鉄(DRI)市場を後押し
炭素排出に関する意識と持続可能な目標を達成するための一歩先を行く行動は、製造業にとって最大の関心事です。製造業からの炭素排出は、世界中で発生する温室効果ガスに大きく寄与しています。世界鉄鋼協会によると、鉄鋼業は2021年に30億トンのCO2を排出しました。鉄鋼業が排出するCO2だけでも、温室効果ガス全体の7~9%を占めており、気候に大きな影響を与えています。持続可能な未来を実現するため、さまざまな政府機関が二酸化炭素排出量削減の取り組みを行っています。水素ベースの製鉄技術は、従来の高炉ベースの製鉄におけるコークスと化石燃料を置き換えることで、炭素排出を無効化するそのようなプロセスのひとつです。
アジア太平洋直接還元鉄(DRI)市場概要
アジア太平洋地域は、中国、インド、日本、マレーシア、韓国、その他アジア太平洋地域などで構成されています。中国やインドなどのアジア太平洋諸国の多くは、世界で最も急速に経済成長している国のひとつです。工業化の進展に伴い、鉄鋼と建設産業はアジア太平洋地域で高い需要があります。アジアは世界の鉄鋼生産の大きな割合を占めています。中国、インド、日本、韓国は、世界の鉄鋼生産量のトップ10に入っています。アジア太平洋地域では、都市化の進展により建設業が拡大しています。
アジア太平洋直接還元鉄(DRI)市場の収益と2030年までの予測(金額)
アジア太平洋地域の直接還元鉄(DRI)市場セグメンテーション
アジア太平洋の直接還元鉄(DRI)市場は、形態、生産プロセス、用途、国別に区分されます。
形態別では、アジア太平洋の直接還元鉄(DRI)市場は、塊状、ペレット、ファインに区分されます。2023年のアジア太平洋直接還元鉄(DRI)市場では、ペレットセグメントが大きなシェアを占めています。
生産プロセスに基づいて、アジア太平洋直接還元鉄(DRI)市場は石炭ベースとガスベースにセグメント化されます。石炭ベースのセグメントが2023年のアジア太平洋直接還元鉄(DRI)市場で最大のシェアを占めています。
用途別では、アジア太平洋直接還元鉄(DRI)市場は製鉄と建設に区分されます。2023年のアジア太平洋直接還元鉄(DRI)市場では、建設が最大のシェアを占めています。
国別に見ると、アジア太平洋直接還元鉄(DRI)市場は中国、インド、日本、マレーシア、韓国、その他アジア太平洋地域に区分されます。2023年のアジア太平洋直接還元鉄(DRI)市場では、インドが圧倒的なシェアを占めています。
アジア太平洋直接還元鉄(DRI)で事業を展開している主要企業には、神戸製鋼所、SMSグループGmbH、ヴォスタルピネAG、JSWスチールLtd、テノバSpA、リバティ・スチール・グループ・ホールディングスUK Ltd、バーラト・エンジニアリング・ワークスPvt Ltdなどがあります。
目次
第1章 イントロダクション
第2章 キーポイント
第3章 調査手法
- 調査範囲
- 調査手法
- データ収集
- 一次インタビュー
- 仮説の策定
- マクロ経済要因分析
- 基礎数値の作成
- データの三角測量
- 国レベルのデータ
第4章 アジア太平洋地域の直接還元鉄(DRI)市場情勢
- 市場概要
- ポーターのファイブフォース分析
- 新規参入業者の脅威
- 供給企業の交渉力
- 買い手の交渉力:新規参入の脅威
- 競争企業間の敵対関係
- 代替品の脅威
- エコシステム分析
- 原材料サプライヤー
- メーカー
- ディストリビューター/サプライヤー
- 最終用途産業
- 専門家の見解
第5章 アジア太平洋地域の直接還元鉄(DRI)市場:主要市場力学
- 市場促進要因
- 鉄鋼生産量と使用量の増加
- 直接還元鉄プラントの拡大
- 市場抑制要因
- 高品質原料の不足
- 市場機会
- グリーン・スチール生産への嗜好の高まり
- 今後の動向
- 二酸化炭素排出量削減のための様々な政府機関による取り組み
- 影響分析
第6章 直接還元鉄(DRI)-アジア太平洋市場分析
- アジア太平洋地域の直接還元鉄(DRI)市場概要
- アジア太平洋地域の直接還元鉄(DRI)市場-2030年までの数量と予測(キロトン)
第7章 アジア太平洋の直接還元鉄(DRI)市場分析-形態別
- アジア太平洋の直接還元鉄(DRI)市場:形態別(2022年、2030年)
- 塊状
- ペレット
- ファイン
第8章 アジア太平洋地域の直接還元鉄(DRI)市場分析:製造プロセス別
- アジア太平洋の直接還元鉄(DRI)市場:製造プロセス別(2022年、2030年)
- 石炭ベース
- ガスベース
第9章 アジア太平洋地域の直接還元鉄(DRI)市場分析-用途別
- アジア太平洋の直接還元鉄(DRI)市場:用途別(2022年・2030年)
- 製鉄
- 建設
第10章 アジア太平洋地域の直接還元鉄市場:国別分析
- アジア太平洋地域直接還元鉄市場:2030年までの数量予測(キロトン)
- アジア太平洋地域の直接還元鉄市場直接還元鉄市場:主要国別
- マレーシア直接還元鉄の市場:2030年までの数量予測(キロトン)
- 中国:直接還元鉄市場直接還元鉄の市場:2030年までの数量予測(キロトン)
- インド:直接還元鉄市場直接還元鉄市場の2030年までの数量予測(キロトン)
- 日本直接還元鉄市場の2030年までの数量予測(キロトン)
- 韓国:直接還元鉄市場直接還元鉄市場:2030年までの数量予測(キロトン)
- その他アジア太平洋地域:直接還元鉄市場:2030年までの数量予測(キロトン)
第11章 業界情勢
- 合併と買収
第12章 企業プロファイル
- Kobe Steel Ltd
- SMS Group GmbH
- Voestalpine AG
- JSW Steel Ltd
- Tenova SpA
- Liberty Steel Group Holdings UK Ltd
- Bharat Engineering Works Pvt Ltd
第13章 企業概要付録
List Of Tables
- Table 1. Asia Pacific Direct Reduced Iron (DRI) Market -Volume and Forecast to 2030 (Kilo Tons)
- Table 2. Asia Pacific Direct Reduced Iron (DRI) Market -Revenue and Forecast to 2030 (US$ Million)
- Table 3. Malaysia Direct Reduced Iron Market, by Form- Volume and Forecast to 2030 (Kilo Tons)
- Table 4. Malaysia Direct Reduced Iron Market, by Form- Revenue and Forecast to 2030 (US$ Million)
- Table 5. Malaysia Direct Reduced Iron Market, by Production Process - Revenue and Forecast to 2030 (US$ Million)
- Table 6. Malaysia Direct Reduced Iron Market, by Application - Revenue and Forecast to 2030 (US$ Million)
- Table 7. China Direct Reduced Iron Market, by Form - Volume and Forecast to 2030 (Kilo Tons)
- Table 8. China Direct Reduced Iron Market, by Form - Revenue and Forecast to 2030 (US$ Million)
- Table 9. China Direct Reduced Iron Market, by Production Process - Revenue and Forecast to 2030 (US$ Million)
- Table 10. China Direct Reduced Iron Market, by Application - Revenue and Forecast to 2030 (US$ Million)
- Table 11. India Direct Reduced Iron Market, by Form - Volume and Forecast to 2030 (Kilo Tons)
- Table 12. India Direct Reduced Iron Market, by Form - Revenue and Forecast to 2030 (US$ Million)
- Table 13. India Direct Reduced Iron Market, by Production Process - Revenue and Forecast to 2030 (US$ Million)
- Table 14. India Direct Reduced Iron Market, by Application - Revenue and Forecast to 2030 (US$ Million)
- Table 15. Japan Direct Reduced Iron Market, by Form - Volume and Forecast to 2030 (Kilo Tons)
- Table 16. Japan Direct Reduced Iron Market, by Form - Revenue and Forecast to 2030 (US$ Million)
- Table 17. Japan Direct Reduced Iron Market, by Production Process - Revenue and Forecast to 2030 (US$ Million)
- Table 18. Japan Direct Reduced Iron Market, by Application - Revenue and Forecast to 2030 (US$ Million)
- Table 19. South Korea Direct Reduced Iron Market, by Form - Volume and Forecast to 2030 (Kilo Tons)
- Table 20. South Korea Direct Reduced Iron Market, by Form - Revenue and Forecast to 2030 (US$ Million)
- Table 21. South Korea Direct Reduced Iron Market, by Production Process - Revenue and Forecast to 2030 (US$ Million)
- Table 22. South Korea Direct Reduced Iron Market, by Application - Revenue and Forecast to 2030 (US$ Million)
- Table 23. Rest of Asia Pacific Direct Reduced Iron Market, by Form - Volume and Forecast to 2030 (Kilo Tons)
- Table 24. Rest of Asia Pacific Direct Reduced Iron Market, by Form - Revenue and Forecast to 2030 (US$ Million)
- Table 25. Rest of Asia Pacific Direct Reduced Iron Market, by Production Process - Revenue and Forecast to 2030 (US$ Million)
- Table 26. Rest of Asia Pacific Direct Reduced Iron Market, by Application - Revenue and Forecast to 2030 (US$ Million)
- Table 27. Glossary of Terms, Asia Pacific Direct Reduced Iron (DRI) Market
List Of Figures
- Figure 1. Asia Pacific Direct Reduced Iron (DRI) Market Segmentation
- Figure 2. Asia Pacific Direct Reduced Iron (DRI) Market Segmentation - By Country
- Figure 3. Asia Pacific Direct Reduced Iron (DRI) Market Overview
- Figure 4. Asia Pacific Direct Reduced Iron (DRI) Market, By Form
- Figure 5. Asia Pacific Direct Reduced Iron (DRI) Market, by Country
- Figure 6. Porter's Five Forces Analysis of Asia Pacific Direct Reduced Iron (DRI) Market
- Figure 7. Asia Pacific Direct Reduced Iron (DRI) Market, Ecosystem
- Figure 8. Expert Opinion
- Figure 9. Asia Pacific Direct Reduced Iron (DRI) Market Impact Analysis of Drivers and Restraints
- Figure 10. Asia Pacific Direct Reduced Iron (DRI) Market - Volume and Forecast to 2030 (Kilo Tons)
- Figure 11. Asia Pacific Direct Reduced Iron (DRI) Market - Revenue and Forecast to 2030 (US$ Million)
- Figure 12. Asia Pacific Direct Reduced Iron (DRI) Market Revenue Share, By Form (2022 and 2030)
- Figure 13. Lumps: Asia Pacific Direct Reduced Iron (DRI) Market - Volume and Forecast To 2030 (Kilo Tons)
- Figure 14. Lumps: Asia Pacific Direct Reduced Iron (DRI) Market - Revenue and Forecast To 2030 (US$ Million)
- Figure 15. Pellets: Asia Pacific Direct Reduced Iron (DRI) Market - Volume and Forecast To 2030 (Kilo Tons)
- Figure 16. Pellets: Asia Pacific Direct Reduced Iron (DRI) Market - Revenue and Forecast To 2030 (US$ Million)
- Figure 17. Fine: Asia Pacific Direct Reduced Iron (DRI) Market - Volume and Forecast To 2030 (Kilo Tons)
- Figure 18. Fine: Asia Pacific Direct Reduced Iron (DRI) Market - Revenue and Forecast To 2030 (US$ Million)
- Figure 19. Asia Pacific Direct Reduced Iron (DRI) Market Revenue Share, By Production Process (2022 and 2030)
- Figure 20. Coal Based: Asia Pacific Direct Reduced Iron (DRI) Market - Revenue and Forecast To 2030 (US$ Million)
- Figure 21. Gas Based: Asia Pacific Direct Reduced Iron (DRI) Market - Revenue and Forecast To 2030 (US$ Million)
- Figure 22. Asia Pacific Direct Reduced Iron (DRI) Market Revenue Share, By Application (2022 and 2030)
- Figure 23. Steel Making: Asia Pacific Direct Reduced Iron (DRI) Market - Revenue and Forecast To 2030 (US$ Million)
- Figure 24. Construction: Asia Pacific Direct Reduced Iron (DRI) Market - Revenue and Forecast To 2030 (US$ Million)
- Figure 25. Asia Pacific: Direct Reduced Iron Market, By Key Country - Revenue (2022) (US$ Million)
- Figure 26. Asia Pacific: Direct Reduced Iron Market - Volume and Forecast to 2030 (Kilo Tons)
- Figure 27. Asia Pacific: Direct Reduced Iron Market - Revenue and Forecast to 2030 (US$ Million)
- Figure 28. Asia Pacific: Direct Reduced Iron Market Revenue Share, by Key Country (2022 and 2030)
- Figure 29. Malaysia: Direct Reduced Iron Market - Volume and Forecast to 2030 (Kilo Tons)
- Figure 30. Malaysia: Direct Reduced Iron Market -Revenue and Forecast to 2030 (US$ Million)
- Figure 31. China: Direct Reduced Iron Market - Volume and Forecast to 2030 (Kilo Tons)
- Figure 32. China: Direct Reduced Iron Market -Revenue and Forecast to 2030 (US$ Million)
- Figure 33. India: Direct Reduced Iron Market - Volume and Forecast to 2030 (Kilo Tons)
- Figure 34. India: Direct Reduced Iron Market -Revenue and Forecast to 2030 (US$ Million)
- Figure 35. Japan: Direct Reduced Iron Market - Volume and Forecast to 2030 (Kilo Tons)
- Figure 36. Japan: Direct Reduced Iron Market -Revenue and Forecast to 2030 (US$ Million)
- Figure 37. South Korea: Direct Reduced Iron Market - Volume and Forecast to 2030 (Kilo Tons)
- Figure 38. South Korea: Direct Reduced Iron Market -Revenue and Forecast to 2030 (US$ Million)
- Figure 39. Rest of Asia Pacific: Direct Reduced Iron Market - Volume and Forecast to 2030 (Kilo Tons)
- Figure 40. Rest of Asia Pacific: Direct Reduced Iron Market -Revenue and Forecast to 2030 (US$ Million)
The Asia Pacific Direct Reduced Iron (DRI) Market is expected to grow from US$ 16,011.13 million in 2023 to US$ 27,765.91 million by 2030. It is estimated to grow at a CAGR of 8.2% from 2023 to 2030.
Rise in Steel Production and Use Industry Fuel Asia Pacific Direct Reduced Iron (DRI) Market
Awareness regarding carbon emissions and taking a step ahead in achieving sustainable goals is the primary concern for manufacturing industries. Carbon emissions from manufacturing industries prominently contribute to the greenhouse gas generated throughout the world. According to the World Steel Association, the steel industry generated 3 billion tons of CO2 in 2021. CO2 emissions from the steel industry alone contribute to ~7-9% of overall greenhouse gas emissions, leading to a huge impact on the climate. Various government bodies are taking initiatives to reduce carbon emission levels to achieve a sustainable future. The hydrogen-based technology for ironmaking is one such process for nullifying carbon emissions by replacing coke and fossil fuel in traditional blast furnace-based steelmaking.
Asia Pacific Direct Reduced Iron (DRI) Market Overview
Asia Pacific comprises economies such as China, India, Japan, Malaysia, South Korea, and the Rest of Asia Pacific. Many of the Asia Pacific countries, such as China and India, are among the world's fastest growing economy. With a growing industrialization, steel and construction industry are in high demand in Asia Pacific. Asia contributes to large percentage of the world's production of steel. China, India, Japan, and South Korea made the top 10 list of steel producers globally. The construction industry is expanding in the Asia Pacific region due to its increasing urbanization.
Asia Pacific Direct Reduced Iron (DRI) Market Revenue and Forecast to 2030 (US$ Million)
Asia Pacific Direct Reduced Iron (DRI) Market Segmentation
The Asia Pacific Direct Reduced Iron (DRI) Market is segmented into form, production process, application, and Country.
Based on from, the Asia Pacific Direct Reduced Iron (DRI) Market is segmented into lumps, pellets, and fine. The pellets segment held a larger share of the Asia Pacific Direct Reduced Iron (DRI) Market in 2023.
Based on production process, the Asia Pacific Direct Reduced Iron (DRI) Market is segmented into coal based, and gas based. The coal-based segment held the largest share of the Asia Pacific Direct Reduced Iron (DRI) Market in 2023.
Based on application, the Asia Pacific Direct Reduced Iron (DRI) Market is segmented into steel making, and construction. The construction held the largest share of the Asia Pacific Direct Reduced Iron (DRI) Market in 2023.
Based on country, the Asia Pacific Direct Reduced Iron (DRI) Market is segmented into the China, India, Japan, Malaysia, South Korea, and the Rest of Asia Pacific. The India dominated the share of the Asia Pacific Direct Reduced Iron (DRI) Market in 2023.
Some of the key companies operating in the Asia Pacific Direct Reduxed Iron (DRI) are Kobe Steel Ltd; SMS Group GmbH; Voestalpine AG; JSW Steel Ltd; Tenova SpA; Liberty Steel Group Holdings UK Ltd; and Bharat Engineering Works Pvt Ltd.
Reasons to Buy:
- Save and reduce time carrying out entry-level research by identifying the growth, size, leading players, and segments in the Asia Pacific direct reduced iron (DRI) market.
- Highlights key business priorities to assist companies to realign their business strategies.
- The key findings and recommendations highlight crucial progressive industry trends in Asia Pacific direct reduced iron (DRI) market, thereby allowing players across the value chain to develop effective long-term strategies.
- Develop/modify business expansion plans by using substantial growth offering developed and emerging markets.
- Scrutinize in-depth Asia Pacific market trends and outlook coupled with the factors driving the market, as well as those hindering it.
- Enhance the decision-making process by understanding the strategies that underpin security interest with respect to client products, segmentation, pricing and distribution.
Table Of Contents
1. Introduction
- 1.1 Study Scope
- 1.2 The Insight Partners Research Report Guidance
- 1.3 Market Segmentation
- 1.3.1 Asia Pacific Direct Reduced Iron (DRI) Market, by Form
- 1.3.2 Asia Pacific Direct Reduced Iron (DRI) Market, by Production Process
- 1.3.3 Asia Pacific Direct Reduced Iron (DRI) Market, by Application
- 1.3.4 Asia Pacific Direct Reduced Iron (DRI) Market, by Country
2. Key Takeaways
3. Research Methodology
- 3.1 Scope of the Study
- 3.2 Research Methodology
- 3.2.1 Data Collection:
- 3.2.2 Primary Interviews:
- 3.2.3 Hypothesis formulation:
- 3.2.4 Macro-economic factor analysis:
- 3.2.5 Developing base number:
- 3.2.6 Data Triangulation:
- 3.2.7 Country level data:
4. Asia Pacific Direct Reduced Iron (DRI) Market Landscape
- 4.1 Market Overview
- 4.2 Porter's Five Forces Analysis
- 4.2.1 Threat of New Entrants:
- 4.2.2 Bargaining Power of Suppliers:
- 4.2.3 Bargaining Power of Buyers:
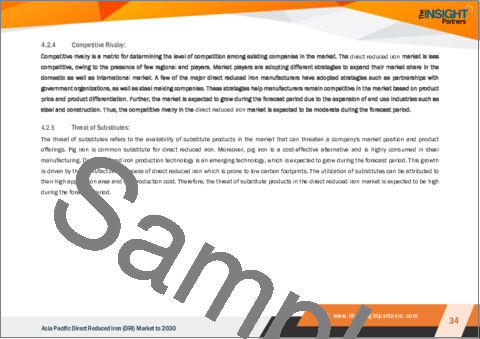
- 4.2.4 Competitive Rivalry:
- 4.2.5 Threat of Substitutes:
- 4.3 Ecosystem Analysis
- 4.3.1 Overview:
- 4.3.2 Raw Material Suppliers:
- 4.3.3 Manufacturers
- 4.3.4 Distributors/Suppliers
- 4.3.5 End-Use Industries
- 4.4 Expert Opinion
5. Asia Pacific Direct Reduced Iron (DRI) Market - Key Market Dynamics
- 5.1 Market Drivers
- 5.1.1 Rise in Steel Production and Use
- 5.1.2 Expansion of Direct Reduced Iron Plants
- 5.2 Market Restraints
- 5.2.1 Shortage of High-Quality Raw Materials
- 5.3 Market Opportunities
- 5.3.1 Rising Preference for Green Steel Production
- 5.4 Future Trends
- 5.4.1 Initiatives by Various Government Bodies to Lower Carbon Footprint
- 5.5 Impact Analysis
6. Direct Reduced Iron (DRI) -Asia Pacific Market Analysis
- 6.1 Asia Pacific Direct Reduced Iron (DRI) Market Overview
- 6.2 Asia Pacific Direct Reduced Iron (DRI) Market -Volume and Forecast to 2030 (Kilo Tons)
- 6.3 Asia Pacific Direct Reduced Iron (DRI) Market -Revenue and Forecast to 2030 (US$ Million)
7. Asia Pacific Direct Reduced Iron (DRI) Market Analysis - By Form
- 7.1 Overview
- 7.2 Asia Pacific Direct Reduced Iron (DRI) Market, By Form (2022 and 2030)
- 7.3 Lumps
- 7.3.1 Overview
- 7.3.2 Lumps: Asia Pacific Direct Reduced Iron (DRI) Market - Volume and Forecast to 2030 (Kilo Tons)
- 7.3.3 Lumps: Asia Pacific Direct Reduced Iron (DRI) Market - Revenue and Forecast to 2030 (US$ Million)
- 7.4 Pellets
- 7.4.1 Overview
- 7.4.2 Pellets: Asia Pacific Direct Reduced Iron (DRI) Market - Volume and Forecast to 2030 (Kilo Tons)
- 7.4.3 Pellets: Asia Pacific Direct Reduced Iron (DRI) Market - Revenue and Forecast to 2030 (US$ Million)
- 7.5 Fine
- 7.5.1 Overview
- 7.5.2 Fine: Asia Pacific Direct Reduced Iron (DRI) Market - Volume and Forecast to 2030 (Kilo Tons)
- 7.5.3 Fine: Asia Pacific Direct Reduced Iron (DRI) Market - Revenue and Forecast to 2030 (US$ Million)
8. Asia Pacific Direct Reduced Iron (DRI) Market Analysis - By Production Process
- 8.1 Overview
- 8.2 Asia Pacific Direct Reduced Iron (DRI) Market, By Production Process (2022 and 2030)
- 8.3 Coal Based
- 8.3.1 Overview
- 8.3.2 Coal Based: Asia Pacific Direct Reduced Iron (DRI) Market - Revenue and Forecast to 2030 (US$ Million)
- 8.4 Gas Based
- 8.4.1 Overview
- 8.4.2 Gas Based: Asia Pacific Direct Reduced Iron (DRI) Market - Revenue and Forecast to 2030 (US$ Million)
9. Asia Pacific Direct Reduced Iron (DRI) Market Analysis - By Application
- 9.1 Overview
- 9.2 Asia Pacific Direct Reduced Iron (DRI) Market, By Application (2022 and 2030)
- 9.3 Steel Making
- 9.3.1 Overview
- 9.3.2 Steel Making: Asia Pacific Direct Reduced Iron (DRI) Market - Revenue and Forecast to 2030 (US$ Million)
- 9.4 Construction
- 9.4.1 Overview
- 9.4.2 Construction: Asia Pacific Direct Reduced Iron (DRI) Market - Revenue and Forecast to 2030 (US$ Million)
10. Asia Pacific Direct Reduced Iron Market -Country Analysis
- 10.1 Overview
- 10.1.1 Asia Pacific: Direct Reduced Iron Market -Volume and Forecast to 2030 (Kilo Tons)
- 10.1.2 Asia Pacific: Direct Reduced Iron Market -Revenue and Forecast to 2030 (US$ Million)
- 10.1.3 Asia Pacific: Direct Reduced Iron Market, by Key Country
- 10.1.3.1 Malaysia: Direct Reduced Iron Market - Volume and Forecast to 2030 (Kilo Tons)
- 10.1.3.2 Malaysia: Direct Reduced Iron Market -Revenue and Forecast to 2030 (US$ Million)
- 10.1.3.2.1 Malaysia: Direct Reduced Iron Market, by Form
- 10.1.3.2.2 Malaysia: Direct Reduced Iron Market, by Form
- 10.1.3.2.3 Malaysia: Direct Reduced Iron Market, by Production Process
- 10.1.3.2.4 Malaysia: Direct Reduced Iron Market, by Application
- 10.1.3.3 China: Direct Reduced Iron Market - Volume and Forecast to 2030 (Kilo Tons)
- 10.1.3.4 China: Direct Reduced Iron Market -Revenue and Forecast to 2030 (US$ Million)
- 10.1.3.4.1 China: Direct Reduced Iron Market, by Form
- 10.1.3.4.2 China: Direct Reduced Iron Market, by Form
- 10.1.3.4.3 China: Direct Reduced Iron Market, by Production Process
- 10.1.3.4.4 China: Direct Reduced Iron Market, by Application
- 10.1.3.5 India: Direct Reduced Iron Market - Volume and Forecast to 2030 (Kilo Tons)
- 10.1.3.6 India: Direct Reduced Iron Market -Revenue and Forecast to 2030 (US$ Million)
- 10.1.3.6.1 India: Direct Reduced Iron Market, by Form
- 10.1.3.6.2 India: Direct Reduced Iron Market, by Form
- 10.1.3.6.3 India: Direct Reduced Iron Market, by Production Process
- 10.1.3.6.4 India: Direct Reduced Iron Market, by Application
- 10.1.3.7 Japan: Direct Reduced Iron Market - Volume and Forecast to 2030 (Kilo Tons)
- 10.1.3.8 Japan: Direct Reduced Iron Market -Revenue and Forecast to 2030 (US$ Million)
- 10.1.3.8.1 Japan: Direct Reduced Iron Market, by Form
- 10.1.3.8.2 Japan: Direct Reduced Iron Market, by Form
- 10.1.3.8.3 Japan: Direct Reduced Iron Market, by Production Process
- 10.1.3.8.4 Japan: Direct Reduced Iron Market, by Application
- 10.1.3.9 South Korea: Direct Reduced Iron Market - Volume and Forecast to 2030 (Kilo Tons)
- 10.1.3.10 South Korea: Direct Reduced Iron Market -Revenue and Forecast to 2030 (US$ Million)
- 10.1.3.10.1 South Korea: Direct Reduced Iron Market, by Form
- 10.1.3.10.2 South Korea: Direct Reduced Iron Market, by Form
- 10.1.3.10.3 South Korea: Direct Reduced Iron Market, by Production Process
- 10.1.3.10.4 South Korea: Direct Reduced Iron Market, by Application
- 10.1.3.11 Rest of Asia Pacific: Direct Reduced Iron Market - Volume and Forecast to 2030 (Kilo Tons)
- 10.1.3.12 Rest of Asia Pacific: Direct Reduced Iron Market -Revenue and Forecast to 2030 (US$ Million)
- 10.1.3.12.1 Rest of Asia Pacific: Direct Reduced Iron Market, by Form
- 10.1.3.12.2 Rest of Asia Pacific: Direct Reduced Iron Market, by Form
- 10.1.3.12.3 Rest of Asia Pacific: Direct Reduced Iron Market, by Production Process
- 10.1.3.12.4 Rest of Asia Pacific: Direct Reduced Iron Market, by Application
11. Industry Landscape
- 11.1 Overview
- 11.2 Merger and Acquisition
12. Company Profiles
- 12.1 Kobe Steel Ltd
- 12.1.1 Key Facts
- 12.1.2 Business Description
- 12.1.3 Products and Services
- 12.1.4 Financial Overview
- 12.1.5 SWOT Analysis
- 12.1.6 Key Developments
- 12.2 SMS Group GmbH
- 12.2.1 Key Facts
- 12.2.2 Business Description
- 12.2.3 Products and Services
- 12.2.4 Financial Overview
- 12.2.5 SWOT Analysis
- 12.2.6 Key Developments
- 12.3 Voestalpine AG
- 12.3.1 Key Facts
- 12.3.2 Business Description
- 12.3.3 Products and Services
- 12.3.4 Financial Overview
- 12.3.5 SWOT Analysis
- 12.3.6 Key Developments
- 12.5 JSW Steel Ltd
- 12.5.1 Key Facts
- 12.5.2 Business Description
- 12.5.3 Products and Services
- 12.5.4 Financial Overview
- 12.5.5 SWOT Analysis
- 12.5.6 Key Developments
- 12.6 Tenova SpA
- 12.6.1 Key Facts
- 12.6.2 Business Description
- 12.6.3 Products and Services
- 12.6.4 Financial Overview
- 12.6.5 SWOT Analysis
- 12.6.6 Key Developments
- 12.7 Liberty Steel Group Holdings UK Ltd
- 12.7.1 Key Facts
- 12.7.2 Business Description
- 12.7.3 Products and Services
- 12.7.4 Financial Overview
- 12.7.5 SWOT Analysis
- 12.7.6 Key Developments
- 12.8 Bharat Engineering Works Pvt Ltd
- 12.8.1 Key Facts
- 12.8.2 Business Description
- 12.8.3 Products and Services
- 12.8.4 Financial Overview
- 12.8.5 SWOT Analysis
- 12.8.6 Key Developments
13. Appendix
- 13.1 About The Insight Partners
- 13.2 Glossary of Terms