|
|
市場調査レポート
商品コード
1716539
直接還元鉄市場の機会、成長促進要因、産業動向分析、2025年~2034年の予測Direct Reduced Iron Market Opportunity, Growth Drivers, Industry Trend Analysis, and Forecast 2025 - 2034 |
||||||
|
|||||||
カスタマイズ可能
|
|||||||

| 直接還元鉄市場の機会、成長促進要因、産業動向分析、2025年~2034年の予測 |
|
出版日: 2025年03月04日
発行: Global Market Insights Inc.
ページ情報: 英文 360 Pages
納期: 2~3営業日
|

全表示
- 概要
- 目次
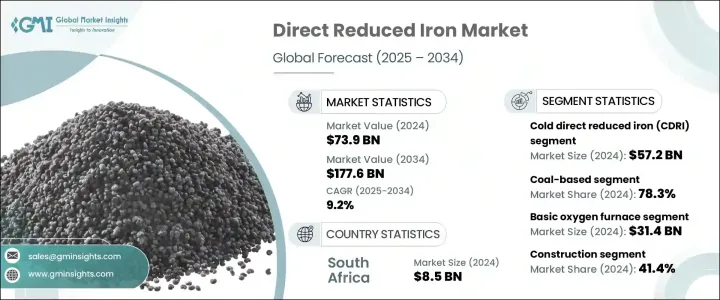
世界の直接還元鉄(DRI)市場は2024年に739億米ドルと評価され、2025年から2034年にかけてCAGR 9.2%で堅調に拡大すると予測されています。
建設、自動車、製造などの産業が持続可能な生産方法への注力を強める中、DRIの需要は引き続き勢いを増しています。鉄鉱石に由来するこの高品質の金属製品は、従来の鉄鉱石ベースの生産に代わる、よりクリーンでエネルギー効率の高い選択肢を提供することで、鉄鋼業界に革命をもたらしています。環境に配慮した製鉄へのシフトが進む中、DRIは従来の製鉄プロセスの重要な代替品となりつつあり、炭素排出量の削減とエネルギー消費の最適化を実現しています。
DRI業界は、技術の進歩や世界の持続可能性重視の高まりに牽引され、急速な変貌を遂げつつあります。主な成長触媒のひとつは、水素ベースや天然ガスベースの還元プロセスの採用で、石炭ベースの方法と比べてCO2排出量を大幅に削減できます。鉄鋼メーカーは、鉄スクラップへの依存度を減らし、製品の一貫性を高めるため、電気アーク炉(EAF)にDRIを組み込む傾向を強めています。さらに、よりコンパクトで輸送に適したDRIである熱間ブリケット鉄(HBI)の採用により、物流が合理化され、市場範囲が拡大しています。世界の規制枠組みが炭素排出規制を強化する中、鉄鋼メーカーはよりクリーンな代替品への移行を加速させており、DRIは持続可能な鉄鋼製造の将来において不可欠な要素となっています。
| 市場範囲 | |
|---|---|
| 開始年 | 2024 |
| 予測年 | 2025-2034 |
| 開始金額 | 739億米ドル |
| 予測金額 | 1,776億米ドル |
| CAGR | 9.2% |
冷間直接還元鉄(CDRI)市場は、2024年に572億米ドルを創出しました。CDRIは高品質の鉄鋼生産、特に製鋼プロセスとシームレスに統合する電気アーク炉での生産に適しています。CDRIは純度が高く不純物が少ないため、インフラ、重機、自動車用途に使用される高級鋼の原料として理想的です。厳しい環境規制が産業界を低排出ソリューションに向かわせる中、CDRIは従来の製鉄に代わる環境に優しい選択肢として支持を集め続けています。
生産技術の面では、石炭ベースのセグメントが2024年に78.3%の圧倒的シェアを占めました。よりクリーンな代替技術が重視されるようになっているにもかかわらず、石炭ベースのDRI生産は依然として最もコスト効率が高く、特に石炭資源が豊富な地域では広く採用されている技術です。このプロセスは比較的低い操業コストで大規模生産を可能にするため、急速に工業化が進む経済圏では魅力的な選択肢となっています。鉄鋼メーカーは、経済性とのバランスを取りながら増加する需要に対応するため、引き続きこの製法に依存しており、この分野の市場支配力が続いています。
南アフリカの直接還元鉄市場は2024年に85億米ドルを創出しました。世界の産業界が二酸化炭素排出量削減への取り組みを強化する中、南アフリカのような地域ではDRIの採用が急増しています。エネルギー効率の改善とカーボンニュートラルの推進を目指す政府の政策が、鉄鋼メーカーに持続可能な技術への投資を促しています。グリーン製造に重点を置くこの地域は、環境に優しい鉄鋼生産への移行における重要なプレーヤーとしての地位を確立しつつあります。
目次
第1章 調査手法と調査範囲
第2章 エグゼクティブサマリー
第3章 業界洞察
- エコシステム分析
- バリューチェーンに影響を与える要因
- 利益率分析
- ディスラプション
- 将来の展望
- メーカー
- 流通業者
- サプライヤーの状況
- 利益率分析
- 主要ニュース
- 規制状況
- 影響要因
- 促進要因
- 持続可能でエネルギー効率の高い鉄鋼生産方法の採用
- DRI製造プロセスの技術的進歩
- 新興経済諸国における鉄鋼需要の増加
- 業界の潜在的リスク&課題
- 鉄鉱石や天然ガスなどの原料価格の変動
- DRI生産設備への高額の設備投資
- 促進要因
- 成長可能性分析
- ポーター分析
- PESTEL分析
第4章 競争情勢
- イントロダクション
- 企業シェア分析
- 競合のポジショニング・マトリックス
- 戦略展望マトリックス
第5章 市場推計・予測:製品タイプ別、2021年~2034年
- 主要動向
- 熱間ブリケット鉄
- 冷間直接還元鉄
第6章 市場推計・予測:技術別、2021年~2034年
- 主要動向
- ガスベース
- 石炭ベース
第7章 市場推計・予測:用途別、2021年~2034年
- 主要動向
- 電気アーク炉
- 塩基性酸素炉
- 鋳造
- その他
第8章 市場推計・予測:最終用途別、2021年~2034年
- 主要動向
- 建設
- 自動車
- 航空宇宙
- 機械・設備
- 電気・電子
- 再生可能エネルギー
- その他
第9章 市場推計・予測:地域別、2021年~2034年
- 主要動向
- 北米
- 米国
- カナダ
- 欧州
- ドイツ
- 英国
- フランス
- スペイン
- イタリア
- オランダ
- アジア太平洋
- 中国
- インド
- 日本
- オーストラリア
- 韓国
- ラテンアメリカ
- ブラジル
- メキシコ
- アルゼンチン
- 中東・アフリカ
- サウジアラビア
- 南アフリカ
- アラブ首長国連邦
第10章 企業プロファイル
- ArcelorMittal
- Essar
- JFE Steel
- JSW Steel
- Kobe Steel
- Metinvest Holding
- MIDREX Technologies
- Mobarakeh steel
- NLMK Group
- NUCOR Corporation
- Qatar Steel Company
- Sinosteel Corporation
- Tata Steel
- Tenova
- Ternium
The Global Direct Reduced Iron Market was valued at USD 73.9 billion in 2024 and is projected to expand at a robust CAGR of 9.2% from 2025 to 2034. As industries such as construction, automotive, and manufacturing intensify their focus on sustainable production methods, the demand for DRI continues to gain momentum. This high-quality metallic product, derived from iron ore, is revolutionizing the iron and steel industry by offering a cleaner, more energy-efficient alternative to traditional iron ore-based production. With a growing shift toward environmentally responsible steelmaking, DRI is becoming a key substitute for conventional ironmaking processes, reducing carbon emissions and optimizing energy consumption.
The DRI industry is undergoing rapid transformation, driven by technological advancements and increasing global emphasis on sustainability. One of the primary growth catalysts is the adoption of hydrogen-based and natural gas-based reduction processes, which significantly cut down CO2 emissions compared to coal-based methods. Steel manufacturers are increasingly integrating DRI into electric arc furnaces (EAFs) to reduce reliance on scrap steel and enhance product consistency. Furthermore, the adoption of hot briquetted iron (HBI), a more compact and transport-friendly version of DRI, is streamlining logistics and expanding market reach. As global regulatory frameworks tighten carbon emission norms, steel producers are accelerating their transition toward cleaner alternatives, positioning DRI as a vital component in the future of sustainable steel manufacturing.
| Market Scope | |
|---|---|
| Start Year | 2024 |
| Forecast Year | 2025-2034 |
| Start Value | $73.9 Billion |
| Forecast Value | $177.6 Billion |
| CAGR | 9.2% |
The cold direct reduced iron (CDRI) market generated USD 57.2 billion in 2024. CDRI is a preferred choice for high-quality steel production, particularly in electric arc furnaces, where it seamlessly integrates with steelmaking processes. Its superior purity and reduced impurities make it an ideal raw material for premium steel grades used in infrastructure, heavy machinery, and automotive applications. With stringent environmental regulations pushing industries toward lower-emission solutions, CDRI continues to gain traction as an eco-friendly alternative to traditional ironmaking.
In terms of production technology, the coal-based segment accounted for a dominant 78.3% share in 2024. Despite the growing emphasis on cleaner alternatives, coal-based DRI production remains the most cost-efficient and widely adopted technique, especially in regions abundant in coal resources. The process enables large-scale production at relatively low operational costs, making it an attractive option in rapidly industrializing economies. Steel manufacturers continue to rely on this method to meet increasing demand while balancing economic feasibility, ensuring the segment's continued market dominance.
The South Africa direct reduced iron market generated USD 8.5 billion in 2024. As global industries intensify their commitment to reducing carbon footprints, regions such as South Africa are witnessing a surge in DRI adoption. Government policies aimed at improving energy efficiency and promoting carbon neutrality are driving steel producers to invest in sustainable technologies. With a strong focus on green manufacturing, the region is positioning itself as a key player in the transition toward eco-friendly steel production.
Table of Contents
Chapter 1 Methodology & Scope
- 1.1 Market scope & definition
- 1.2 Base estimates & calculations
- 1.3 Forecast calculation
- 1.4 Data sources
- 1.4.1 Primary
- 1.4.2 Secondary
- 1.4.2.1 Paid sources
- 1.4.2.2 Public sources
Chapter 2 Executive Summary
- 2.1 Industry synopsis, 2021-2034
Chapter 3 Industry Insights
- 3.1 Industry ecosystem analysis
- 3.1.1 Factor affecting the value chain
- 3.1.2 Profit margin analysis
- 3.1.3 Disruptions
- 3.1.4 Future outlook
- 3.1.5 Manufacturers
- 3.1.6 Distributors
- 3.2 Supplier landscape
- 3.3 Profit margin analysis
- 3.4 Key news & initiatives
- 3.5 Regulatory landscape
- 3.6 Impact forces
- 3.6.1 Growth drivers
- 3.6.1.1 Adoption of sustainable and energy-efficient steel production methods
- 3.6.1.2 Technological advancements in DRI production processes
- 3.6.1.3 Rising steel demand in developing economies
- 3.6.2 Industry pitfalls & challenges
- 3.6.2.1 Volatile prices of raw materials like iron ore and natural gas
- 3.6.2.2 High capital investment for DRI production facilities
- 3.6.1 Growth drivers
- 3.7 Growth potential analysis
- 3.8 Porter's analysis
- 3.9 PESTEL analysis
Chapter 4 Competitive Landscape, 2024
- 4.1 Introduction
- 4.2 Company market share analysis
- 4.3 Competitive positioning matrix
- 4.4 Strategic outlook matrix
Chapter 5 Market Estimates and Forecast, By Product Type, 2021 – 2034 (USD Billion) (Kilo Tons)
- 5.1 Key trends
- 5.2 Hot briquetted iron
- 5.3 Cold direct reduced iron
Chapter 6 Market Estimates and Forecast, By Technology, 2021 – 2034 (USD Billion) (Kilo Tons)
- 6.1 Key trends
- 6.2 Gas-based
- 6.3 Coal-based
Chapter 7 Market Estimates and Forecast, By Application, 2021 – 2034 (USD Billion) (Kilo Tons)
- 7.1 Key trends
- 7.2 Electric arc furnace
- 7.3 Basic oxygen furnace
- 7.4 Foundries
- 7.5 Others
Chapter 8 Market Estimates and Forecast, By End Use, 2021 – 2034 (USD Billion) (Kilo Tons)
- 8.1 Key trends
- 8.2 Construction
- 8.3 Automotive
- 8.4 Aerospace
- 8.5 Machinery & equipment
- 8.6 Electrical & electronic
- 8.7 Renewable energy
- 8.8 Others
Chapter 9 Market Estimates and Forecast, By Region, 2021 – 2034 (USD Billion) (Kilo Tons)
- 9.1 Key trends
- 9.2 North America
- 9.2.1 U.S.
- 9.2.2 Canada
- 9.3 Europe
- 9.3.1 Germany
- 9.3.2 UK
- 9.3.3 France
- 9.3.4 Spain
- 9.3.5 Italy
- 9.3.6 Netherlands
- 9.4 Asia Pacific
- 9.4.1 China
- 9.4.2 India
- 9.4.3 Japan
- 9.4.4 Australia
- 9.4.5 South Korea
- 9.5 Latin America
- 9.5.1 Brazil
- 9.5.2 Mexico
- 9.5.3 Argentina
- 9.6 Middle East and Africa
- 9.6.1 Saudi Arabia
- 9.6.2 South Africa
- 9.6.3 UAE
Chapter 10 Company Profiles
- 10.1 ArcelorMittal
- 10.2 Essar
- 10.3 JFE Steel
- 10.4 JSW Steel
- 10.5 Kobe Steel
- 10.6 Metinvest Holding
- 10.7 MIDREX Technologies
- 10.8 Mobarakeh steel
- 10.9 NLMK Group
- 10.10 NUCOR Corporation
- 10.11 Qatar Steel Company
- 10.12 Sinosteel Corporation
- 10.13 Tata Steel
- 10.14 Tenova
- 10.15 Ternium

