|
|
市場調査レポート
商品コード
1372491
e-Bike市場規模・予測、世界・地域シェア、動向、成長機会分析レポート対象:バッテリータイプ別、モータータイプ別、クラス別、モード別E-Bike Market Size and Forecasts, Global and Regional Share, Trends, and Growth Opportunity Analysis Report Coverage: By Battery Type ; Motor Type ; Class ; Mode |
||||||
|
|
|||||||
|
|||||||


| e-Bike市場規模・予測、世界・地域シェア、動向、成長機会分析レポート対象:バッテリータイプ別、モータータイプ別、クラス別、モード別 |
|
出版日: 2023年10月04日
発行: The Insight Partners
ページ情報: 英文 218 Pages
納期: 即納可能
|

- 全表示
- 概要
- 図表
- 目次
e-Bike市場は、2022年の396億6,010万米ドルから2030年には1,086億460万米ドルに成長すると予測されています。e-Bike市場は2022年から2030年にかけて13.4%のCAGRを記録すると推定されます。
都市化の開拓、サイクリングコース開発への投資の増加、環境に優しい交通手段に対する消費者の意識の高まりが、e-Bike市場の成長を促進しています。いくつかの国の政府は、e-Bike導入のために潤沢な投資と補助金を発表しています。また、都市化が進み、サイクリング・トラックやe-Bike接続インフラに対する政府支出が増加していることも、今後数年間、世界のe-Bike市場にチャンスを提供すると思われます。国連機関によると、世界の人口の約55.0%が都市部に住んでおり、2050年までに68%に達するまで急ピッチで増加しています。交通システムは、混雑や公害の増加といった将来の需要に対応できるようには構築されていないです。このような問題に対処するため、主要参入企業は、支払いや施錠のためのスキャナーを内蔵したコネクテッドe-Bikeを発売しています。いくつかの企業体や主要参入企業は、交通渋滞を避けるために短距離移動用のコネクテッドe-Bikeを提供するために、提携や協力などの複数の戦略を採用しています。
2021年4月現在、EU諸国の国家環境基金は、政府資金によるe-Bike購入に対して375~540米ドルの補助金を提供しています。EU諸国政府の支援と資金援助イニシアティブにより、これらの国々におけるe-Bikeの販売台数は2019年の370万台から2022年には550万台へと48.6%増加しました。
欧州のe-Bike市場は、環境に優しい交通手段に対する消費者の意識の高まりにより、2番目に大きく成長しています。ドイツには多くの自動車製造工場があり、常に電気自動車の開発に注力しています。さらに、スペイン、英国、オランダ、ドイツ、イタリアなどの欧州主要国では、e-Bikeの普及が著しい成長を遂げています。欧州自転車産業連盟(CONEBI)によると、同地域のe-Bike需要は年々増加しており、2019年の需要は前年比で~35%増加しました。e-Bike/電気自動車の増加に伴い、欧州諸国の政府はEV充電インフラの大幅な整備を進めている;これはまた、各国におけるサードパーティサービスプロバイダーの急増につながっています。
燃料価格の上昇と環境に優しい交通手段の採用増加
2023年の世界のガソリン平均価格は1ガロン当たり3.32米ドルで、2025年には3.79米ドル、2030年にはレギュラーガソリンで5米ドルに達すると予測されています。燃料価格の高騰と手ごろな価格の交通手段への需要の高まりが、e-Bikeの需要に拍車をかけています。さらに、大気汚染は急速に拡大しつつある主要な環境問題です。大気汚染にかかる世界のコストは、2020年には2兆9,000億米ドルに達し、世界GDPの約3.3%に相当します。また、インドでは大気汚染に少なくとも年間950億米ドルのコストがかかっており、自転車やe-Bikeを導入することでこれを削減することができます。e-Bikeを使ったサイクリングは短距離の移動に使われます。e-Bikeを採用し、サイクリングを利用することで、年間2ギガトンのCO2排出量を削減できます。世界レベルでは、サイクリングとe-Bikeの利用は、年間8,360億米ドルの追加コストを削減できます。そのため、持続可能で環境に優しい交通手段への需要が、この汚染コストを削減するために高まり、市場成長を牽引しています。その結果、いくつかの国の政府は、大気汚染を軽減するために、クリーンで環境に優しい交通機関への補助金支給を計画しています。2021年の国連機関報告書によると、持続可能な輸送への年間投資額は1.4~2兆1,000億米ドルと評価されています。この投資には、電気自動車の製造、充電ステーション、e-Bikeの生産が含まれます。
アジア太平洋は、中国と日本に複数の現地メーカーが存在するため、2022年には世界のe-Bike市場を独占すると予想されます。中国のe-Bike生産台数は最大で、2021年には約4,550万台に達します。これは、原材料供給業者の存在、人件費の安さ、e-Bikeの普及を促進する政府の有利な制度によるものです。また、中国の消費者は環境に優しい交通手段の利点を認識しており、短距離の移動や都市部の交通渋滞を避けるためにe-Bikeに投資しています。中国自転車機構によると、中国は世界最大の電動自転車の消費国であり輸出国です。国内では3億台以上の電動自転車が使用されています。2020年、中国は約4,130万台の電動アシスト自転車を生産し、世界に200万台以上を輸出しました。中国国内では、5,000万人以上の人々が、その低価格、利便性、比較的エネルギー効率の高い交通手段であるe-Bikeを利用しています。中国は、移動手段としてe-Bikeを利用する圧倒的な国です。
日本とインドのe-Bike市場は、e-Bikeモビリティの普及を促進するための政府制度や資金調達の増加により急成長しています。2020年3月、インドの財務相は、e-サイクルに補助金を支給するPLI制度を開始しました。同国政府は、国内製造施設の設立に米国から2億4,000万米ドルを投資すると発表しました。この制度は、現地の需要を満たすためにEバイクとEVの生産を促進するために導入されました。
中国のE-bike市場は、成長の大きな可能性を秘めた有望な市場と考えられています。中国における急速な都市化と交通渋滞問題の高まりは、E-BIKEに対する大規模な需要を生み出しました。2021年には、先進国および新興諸国からの需要の高まりにより、中国は世界および国内で4,500万台以上のE-bikeを販売しました。中国は、原材料の存在、労働コストの低さ、複数の現地メーカーの存在により、2022年には世界のe-Bike市場で最大のシェアを占めると予想されます。2022年現在、中国には300台以上のe-Bikeが走っており、その数は急速に増加しています。中国とインドの政府は、二酸化炭素排出量を削減するため、電気自動車の販売を促進する補助金制度を設けています。中国の財政商務部は、農村部におけるe-Bikeに1台あたり最大36米ドルの補助金を提供しており、補助金の80%は中央政府予算から、20%は地方予算から拠出されます。
中国、インド、日本、オーストラリアなどの国々は、e-モビリティ製造の成長を支援しています。各国は、アジア太平洋諸国全体でクリーン交通の導入にインセンティブと資金を提供しています。中国政府はクリーンな輸送を促進するため、E-バイク購入に35~80米ドルの補助金を提供しています。中国には2021年時点で約3億台の電動バイクがあり、人気の高まりと政府の政策的取り組みにより、その数は急速に増加しています。
北米のe-Bike市場は、予測期間中に最も高いCAGRで成長すると予測されているが、これはアウトドアレクリエーション活動へのe-Bikeの採用が増加しているためです。米国とカナダでは、トレッキング、サイクリング、マウンテンバイクなどのアウトドア・アクティビティも人気を集めています。また、政府は環境に優しい交通手段を選ぶことを支持しています。米国民主党は、社会の安全のために「Build Back Better Act」として約1兆7,500億米ドルの資金を投入する法案を可決しました。
市場イニシアチブは、世界中に足跡を広げ、顧客の高まる需要に応えるために企業が採用する戦略です。e-Bike市場の参入企業は、主に先進技術の導入による製品の強化に注力しています。パートナーシップ、契約、合弁事業の契約締結、資金調達、世界各地での新拠点の設立により、企業は世界のブランド名を維持することができます。
世界中で事業を展開するe-Bikeの主な参入企業は、都市部での短距離移動用の軽量車両の開発に注力しています。先進的なモーターシステムとスマート・アプリ機能を内蔵したe-Bikeの市場開拓の高まりが、今後数年間のe-Bike市場の成長を牽引すると思われます。
2023年6月、電動自転車のモーターと駆動システムのメーカーであるRobert Bosch GmbHは、先進的なe-Bikeシステムとe-Bikeを発売しました。同社が発売した最初の製品には、Performance Line SXと名付けられたe-Bike用モーターがあり、軽量のe-MTBやe-gravelバイクの製造用に設計されています。また、同社はe-Bike用のスマートシステムソフトウェアアプリケーションも発表しました。このシステムは、e-シティバイクやe-トレッキングバイクのドライブユニットと連動しています。ライダーは、互換性のあるe-shiftオートマチックトランスミッションを搭載したSmartの恩恵をすべて受けることができます。e-Bike、e-MTB、e-Gravel、e-Urban向けのその他のイノベーションには、Compact Tube 400バッテリーとPower 250レンジエクステンダー、Sprintライディングモード(SPRNT)、e-Gravel向けのMini Remoteドロップバーバリエーションなどがあります。
2023年4月、インドを拠点とするe-Bike新興企業udChaloは、インドの軍隊および個人ユーザー向けにVir e-Bikeと名付けた電動自転車を発売しました。Vir Bikeはインドの厳しい天候や道路状況に耐えることができます。
2023年1月、自転車メーカーのFIREFOX BIKESが、アーバンエコ初のアプリケーション制御電動自転車をインドで発売しました。この電動バイクはドイツの技術で作られており、Firefox Fitアプリケーションを使ってすべての新機能を制御できます。
2022年9月、ヤマハ発動機は最上位ドライブユニットPW-Xを搭載したマウンテンバイクe-BikeモデルYDX-TORCを発売しました。YDX-MORO」「YDX-MORO Pro」などのオールマウンテンe-MTBを展開。
2020年11月、インドのe-Bikeメーカーであるアルファベクターは、わずか375米ドルで、インドで乗るための免許が不要なe-bicycle「Meraki Ninety-One」を発売しました。
2020年6月には、ライドヘイリング会社のボルトがフランスのパリでe-Bikeシェアリングサービスを開始しました。同社はさらに、より多くの欧州諸国への拡大を計画していました。このサービスは、同社のエコプランに貢献することを目的としていました。このe-Bikeの採用は、欧州の交通部門におけるCO2排出量の相殺に貢献します。
Haibike、Aventon Bikes、Giant Manufacturing Co Ltd、Merida Industry Co., Ltd.、Pedego Electric Bikes、Robert Bosch GmbH、Specialized Bicycle Components, Inc.その他、いくつかの主要e-Bike市場参入企業を調査・分析し、市場とそのエコシステムを展望しました。e-Bike市場レポートは詳細な市場洞察を提供し、主要参入企業の成長戦略を支援します。
目次
第1章 イントロダクション
第2章 エグゼクティブサマリー
- 主要洞察
- 市場の魅力
第3章 調査手法
- 調査範囲
- 2次調査
- 1次調査
第4章 e-Bike市場情勢
- 概観
- PEST分析
- エコシステム分析
- e-Bikeサプライヤー一覧
第5章 e-Bike市場-主要産業力学
- e-Bike市場- 主要産業力学
- 市場促進要因
- アウトドアスポーツと冒険活動の成長
- 低炭素交通への政府支援
- 燃料価格の上昇と環境に優しい交通手段の採用増加
- 市場抑制要因
- e-Bikeの高コストと製造に必要な巨額の設備投資
- 市場機会
- 企業および政府部門におけるコネクテッドe-Bikeの採用増加
- 今後の動向
- 軽量素材と高度なスマートシステムを用いたe-Bikeの開発
- 促進要因と抑制要因の影響
第6章 e-Bike市場:世界市場分析
- e-Bike市場の売上高、2022年~2030年
- e-Bike市場の予測と分析
第7章 e-Bike市場分析:バッテリータイプ
- リチウムイオン
- リチウムイオンポリマー
- 鉛酸
- ニッケル水素
第8章 e-Bike市場分析:モータータイプ
- ミッドモーター
- ミッドモーターの収益と2030年までの予測
- ハブモーター
- ハブモーター市場の収益と2030年までの予測
第9章 e-Bike市場分析:クラス別
- クラスI
- クラスI概要
- クラスI市場の収益と2030年までの予測
- クラスII
- クラスII概要
- クラスIIの収益と2030年までの予測
- クラスIII
- クラスIII市場の収益と2030年までの予測
第10章 e-Bike市場分析:モード
- ペダルアシストモード
- ペダルアシストモード市場の収益と2030年までの予測
- スロットルモード
- スロットルモード市場の収益と2030年までの予測
第11章 e-Bike市場:地域別分析
- 北米
- メキシコ
- 欧州
- その他の欧州
- アジア太平洋
- その他のアジア太平洋
- 中東・アフリカ
- その他の中東・アフリカ
- 南米
- その他の南米
第12章 e-Bike市場:COVID-19パンデミックの影響
- COVID-19前後の影響
第13章 競合情勢
- 主要参入企業によるヒートマップ分析
- 企業のポジショニングと集中度
第14章 業界情勢
- イントロダクション
- 市場イニシアティブ
- 新製品開発
- 合併と買収
第15章 企業プロファイル
- Haibike
- Aventon Bikes
- Giant Manufacturing Co Ltd
- Merida Industry Co., Ltd.
- Pedego Electric Bikes
- Robert Bosch GmbH
- Specialized Bicycle Components, Inc.
- Shimano Inc
- Trek Bicycle Corp
- Yamaha Motor Co Ltd
第16章 付録
List Of Tables
- Table 1. E-Bike Market Segmentation
- Table 2. List of Vendors in the Value Chain
- Table 3. E-Bike Market Revenue and Forecasts To 2030 (US$ Million)
- Table 4. E-Bike Market Revenue and Forecasts To 2030 (US$ Million) - Battery Type
- Table 5. E-Bike Market Revenue and Forecasts To 2030 (US$ Million) - Motor Type
- Table 6. E-Bike Market Revenue and Forecasts To 2030 (US$ Million) - Class
- Table 7. E-Bike Market Revenue and Forecasts To 2030 (US$ Million) - Mode
- Table 8. North America E-Bike Market Revenue and Forecasts To 2030 (US$ Mn) - By Battery Type
- Table 9. North America E-Bike Market Revenue and Forecasts To 2030 (US$ Mn) - By Motor Type
- Table 10. North America E-Bike Market Revenue and Forecasts To 2030 (US$ Mn) - By Class
- Table 11. North America E-Bike Market Revenue and Forecasts To 2030 (US$ Mn) - By Mode
- Table 12. North America E-Bike Market Revenue and Forecasts To 2030 (US$ Mn) - By Country
- Table 13. US E-Bike Market Revenue and Forecasts To 2030 (US$ Mn) - By Battery Type
- Table 14. US E-Bike Market Revenue and Forecasts To 2030 (US$ Mn) - By Motor Type
- Table 15. US E-Bike Market Revenue and Forecasts To 2030 (US$ Mn) - By Class
- Table 16. US E-Bike Market Revenue and Forecasts To 2030 (US$ Mn) - By Mode
- Table 17. Canada E-Bike Market Revenue and Forecasts To 2030 (US$ Mn) - By Battery Type
- Table 18. Canada E-Bike Market Revenue and Forecasts To 2030 (US$ Mn) - By Motor Type
- Table 19. Canada E-Bike Market Revenue and Forecasts To 2030 (US$ Mn) - By Class
- Table 20. Canada E-Bike Market Revenue and Forecasts To 2030 (US$ Mn) - By Mode
- Table 21. Mexico E-Bike Market Revenue and Forecasts To 2030 (US$ Mn) - By Battery Type
- Table 22. Mexico E-Bike Market Revenue and Forecasts To 2030 (US$ Mn) - By Motor Type
- Table 23. Mexico E-Bike Market Revenue and Forecasts To 2030 (US$ Mn) - By Class
- Table 24. Mexico E-Bike Market Revenue and Forecasts To 2030 (US$ Mn) - By Mode
- Table 25. Europe E-Bike Market Revenue and Forecasts To 2030 (US$ Mn) - By Battery Type
- Table 26. Europe E-Bike Market Revenue and Forecasts To 2030 (US$ Mn) - By Motor Type
- Table 27. Europe E-Bike Market Revenue and Forecasts To 2030 (US$ Mn) - By Class
- Table 28. Europe E-Bike Market Revenue and Forecasts To 2030 (US$ Mn) - By Mode
- Table 29. Europe E-Bike Market Revenue and Forecasts To 2030 (US$ Mn) - By Country
- Table 30. Germany E-Bike Market Revenue and Forecasts To 2030 (US$ Mn) - By Battery Type
- Table 31. Germany E-Bike Market Revenue and Forecasts To 2030 (US$ Mn) - By Motor Type
- Table 32. Germany E-Bike Market Revenue and Forecasts To 2030 (US$ Mn) - By Class
- Table 33. Germany E-Bike Market Revenue and Forecasts To 2030 (US$ Mn) - By Mode
- Table 34. France E-Bike Market Revenue and Forecasts To 2030 (US$ Mn) - By Battery Type
- Table 35. France E-Bike Market Revenue and Forecasts To 2030 (US$ Mn) - By Motor Type
- Table 36. France E-Bike Market Revenue and Forecasts To 2030 (US$ Mn) - By Class
- Table 37. France E-Bike Market Revenue and Forecasts To 2030 (US$ Mn) - By Mode
- Table 38. Italy E-Bike Market Revenue and Forecasts To 2030 (US$ Mn) - By Battery Type
- Table 39. Italy E-Bike Market Revenue and Forecasts To 2030 (US$ Mn) - By Motor Type
- Table 40. Italy E-Bike Market Revenue and Forecasts To 2030 (US$ Mn) - By Class
- Table 41. Italy E-Bike Market Revenue and Forecasts To 2030 (US$ Mn) - By Mode
- Table 42. UK E-Bike Market Revenue and Forecasts To 2030 (US$ Mn) - By Battery Type
- Table 43. UK E-Bike Market Revenue and Forecasts To 2030 (US$ Mn) - By Motor Type
- Table 44. UK E-Bike Market Revenue and Forecasts To 2030 (US$ Mn) - By Class
- Table 45. UK E-Bike Market Revenue and Forecasts To 2030 (US$ Mn) - By Mode
- Table 46. Netherland E-Bike Market Revenue and Forecasts To 2030 (US$ Mn) - By Battery Type
- Table 47. Netherland E-Bike Market Revenue and Forecasts To 2030 (US$ Mn) - By Motor Type
- Table 48. Netherland E-Bike Market Revenue and Forecasts To 2030 (US$ Mn) - By Class
- Table 49. Netherland E-Bike Market Revenue and Forecasts To 2030 (US$ Mn) - By Mode
- Table 50. Rest of Europe E-Bike Market Revenue and Forecasts To 2030 (US$ Mn) - By Battery Type
- Table 51. Rest of Europe E-Bike Market Revenue and Forecasts To 2030 (US$ Mn) - By Motor Type
- Table 52. Rest of Europe E-Bike Market Revenue and Forecasts To 2030 (US$ Mn) - By Class
- Table 53. Rest of Europe E-Bike Market Revenue and Forecasts To 2030 (US$ Mn) - By Mode
- Table 54. Asia Pacific E-Bike Market Revenue and Forecasts To 2030 (US$ Mn) - By Battery Type
- Table 55. Asia Pacific E-Bike Market Revenue and Forecasts To 2030 (US$ Mn) - By Motor Type
- Table 56. Asia Pacific E-Bike Market Revenue and Forecasts To 2030 (US$ Mn) - By Class
- Table 57. Asia Pacific E-Bike Market Revenue and Forecasts To 2030 (US$ Mn) - By Mode
- Table 58. Asia Pacific E-Bike Market Revenue and Forecasts To 2030 (US$ Mn) - By Country
- Table 59. Australia E-Bike Market Revenue and Forecasts To 2030 (US$ Mn) - By Battery Type
- Table 60. Australia E-Bike Market Revenue and Forecasts To 2030 (US$ Mn) - By Motor Type
- Table 61. Australia E-Bike Market Revenue and Forecasts To 2030 (US$ Mn) - By Class
- Table 62. Australia E-Bike Market Revenue and Forecasts To 2030 (US$ Mn) - By Mode
- Table 63. China E-Bike Market Revenue and Forecasts To 2030 (US$ Mn) - By Battery Type
- Table 64. China E-Bike Market Revenue and Forecasts To 2030 (US$ Mn) - By Motor Type
- Table 65. China E-Bike Market Revenue and Forecasts To 2030 (US$ Mn) - By Class
- Table 66. China E-Bike Market Revenue and Forecasts To 2030 (US$ Mn) - By Mode
- Table 67. India E-Bike Market Revenue and Forecasts To 2030 (US$ Mn) - By Battery Type
- Table 68. India E-Bike Market Revenue and Forecasts To 2030 (US$ Mn) - By Motor Type
- Table 69. India E-Bike Market Revenue and Forecasts To 2030 (US$ Mn) - By Class
- Table 70. India E-Bike Market Revenue and Forecasts To 2030 (US$ Mn) - By Mode
- Table 71. Japan E-Bike Market Revenue and Forecasts To 2030 (US$ Mn) - By Battery Type
- Table 72. Japan E-Bike Market Revenue and Forecasts To 2030 (US$ Mn) - By Motor Type
- Table 73. Japan E-Bike Market Revenue and Forecasts To 2030 (US$ Mn) - By Class
- Table 74. Japan E-Bike Market Revenue and Forecasts To 2030 (US$ Mn) - By Mode
- Table 75. South Korea E-Bike Market Revenue and Forecasts To 2030 (US$ Mn) - By Battery Type
- Table 76. South Korea E-Bike Market Revenue and Forecasts To 2030 (US$ Mn) - By Motor Type
- Table 77. South Korea E-Bike Market Revenue and Forecasts To 2030 (US$ Mn) - By Class
- Table 78. South Korea E-Bike Market Revenue and Forecasts To 2030 (US$ Mn) - By Mode
- Table 79. Rest of Asia Pacific E-Bike Market Revenue and Forecasts To 2030 (US$ Mn) - By Battery Type
- Table 80. Rest of Asia Pacific E-Bike Market Revenue and Forecasts To 2030 (US$ Mn) - By Motor Type
- Table 81. Rest of Asia Pacific E-Bike Market Revenue and Forecasts To 2030 (US$ Mn) - By Class
- Table 82. Rest of Asia Pacific E-Bike Market Revenue and Forecasts To 2030 (US$ Mn) - By Mode
- Table 83. Middle East & Africa E-Bike Market Revenue and Forecasts To 2030 (US$ Mn) - By Battery Type
- Table 84. Middle East & Africa E-Bike Market Revenue and Forecasts To 2030 (US$ Mn) - By Motor Type
- Table 85. Middle East & Africa E-Bike Market Revenue and Forecasts To 2030 (US$ Mn) - By Class
- Table 86. Middle East & Africa E-Bike Market Revenue and Forecasts To 2030 (US$ Mn) - By Mode
- Table 87. Middle East & Africa E-Bike Market Revenue and Forecasts To 2030 (US$ Mn) - By Country
- Table 88. UAE E-Bike Market Revenue and Forecasts To 2030 (US$ Mn) - By Battery Type
- Table 89. UAE E-Bike Market Revenue and Forecasts To 2030 (US$ Mn) - By Motor Type
- Table 90. UAE E-Bike Market Revenue and Forecasts To 2030 (US$ Mn) - By Class
- Table 91. UAE E-Bike Market Revenue and Forecasts To 2030 (US$ Mn) - By Mode
- Table 92. Saudi Arabia E-Bike Market Revenue and Forecasts To 2030 (US$ Mn) - By Battery Type
- Table 93. Saudi Arabia E-Bike Market Revenue and Forecasts To 2030 (US$ Mn) - By Motor Type
- Table 94. Saudi Arabia E-Bike Market Revenue and Forecasts To 2030 (US$ Mn) - By Class
- Table 95. Saudi Arabia E-Bike Market Revenue and Forecasts To 2030 (US$ Mn) - By Mode
- Table 96. South Africa E-Bike Market Revenue and Forecasts To 2030 (US$ Mn) - By Battery Type
- Table 97. South Africa E-Bike Market Revenue and Forecasts To 2030 (US$ Mn) - By Motor Type
- Table 98. South Africa E-Bike Market Revenue and Forecasts To 2030 (US$ Mn) - By Class
- Table 99. South Africa E-Bike Market Revenue and Forecasts To 2030 (US$ Mn) - By Mode
- Table 100. Rest of MEA E-Bike Market Revenue and Forecasts To 2030 (US$ Mn) - By Battery Type
- Table 101. Rest of MEA E-Bike Market Revenue and Forecasts To 2030 (US$ Mn) - By Motor Type
- Table 102. Rest of MEA E-Bike Market Revenue and Forecasts To 2030 (US$ Mn) - By Class
- Table 103. Rest of MEA E-Bike Market Revenue and Forecasts To 2030 (US$ Mn) - By Mode
- Table 104. South America E-Bike Market Revenue and Forecasts To 2030 (US$ Mn) - By Battery Type
- Table 105. South America E-Bike Market Revenue and Forecasts To 2030 (US$ Mn) - By Motor Type
- Table 106. South America E-Bike Market Revenue and Forecasts To 2030 (US$ Mn) - By Class
- Table 107. South America E-Bike Market Revenue and Forecasts To 2030 (US$ Mn) - By Mode
- Table 108. South America E-Bike Market Revenue and Forecasts To 2030 (US$ Mn) - By Country
- Table 109. Brazil E-Bike Market Revenue and Forecasts To 2030 (US$ Mn) - By Battery Type
- Table 110. Brazil E-Bike Market Revenue and Forecasts To 2030 (US$ Mn) - By Motor Type
- Table 111. Brazil E-Bike Market Revenue and Forecasts To 2030 (US$ Mn) - By Class
- Table 112. Brazil E-Bike Market Revenue and Forecasts To 2030 (US$ Mn) - By Mode
- Table 113. Argentina E-Bike Market Revenue and Forecasts To 2030 (US$ Mn) - By Battery Type
- Table 114. Argentina E-Bike Market Revenue and Forecasts To 2030 (US$ Mn) - By Motor Type
- Table 115. Argentina E-Bike Market Revenue and Forecasts To 2030 (US$ Mn) - By Class
- Table 116. Argentina E-Bike Market Revenue and Forecasts To 2030 (US$ Mn) - By Mode
- Table 117. Rest of SAM E-Bike Market Revenue and Forecasts To 2030 (US$ Mn) - By Battery Type
- Table 118. Rest of SAM E-Bike Market Revenue and Forecasts To 2030 (US$ Mn) - By Motor Type
- Table 119. Rest of SAM E-Bike Market Revenue and Forecasts To 2030 (US$ Mn) - By Class
- Table 120. Rest of SAM E-Bike Market Revenue and Forecasts To 2030 (US$ Mn) - By Mode
- Table 121. Heat Map Analysis by Key Players
- Table 122. List of Abbreviation
List Of Figures
- Figure 1. E-Bike Market Segmentation, By Geography
- Figure 2. PEST Analysis
- Figure 3. Ecosystem: E-Bike Market
- Figure 4. Impact Analysis of Drivers and Restraints
- Figure 5. E-Bike Market Breakdown by Geography, 2022 and 2030 (%)
- Figure 6. E-Bike Market Revenue (US$ Million), 2022 - 2030
- Figure 7. E-Bike Market Share (%) - Battery Type, 2022 and 2030
- Figure 8. Lithium-Ion Market Revenue and Forecasts To 2030 (US$ Million)
- Figure 9. Lithium-Ion Polymer Market Revenue and Forecasts To 2030 (US$ Million)
- Figure 10. Lithium-Ion Polymer Market Revenue and Forecasts To 2030 (US$ Million)
- Figure 11. Nickel Market Revenue and Forecasts To 2030 (US$ Million)
- Figure 12. E-Bike Market Share (%) - Motor Type, 2022 and 2030
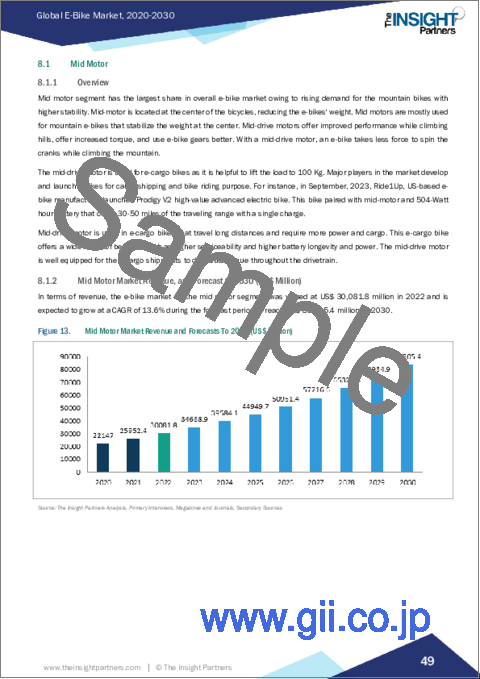
- Figure 13. Mid Motor Market Revenue and Forecasts To 2030 (US$ Million)
- Figure 14. Hub Motor Market Revenue and Forecasts To 2030 (US$ Million)
- Figure 15. E-Bike Market Share (%) - Class, 2022 and 2030
- Figure 16. Class I Market Revenue and Forecasts To 2030 (US$ Million)
- Figure 17. Class II Market Revenue and Forecasts To 2030 (US$ Million)
- Figure 18. Class III Market Revenue and Forecasts To 2030 (US$ Million)
- Figure 19. E-Bike Market Share (%) - Mode, 2022 and 2030
- Figure 20. Pedal Assisted Mode Market Revenue and Forecasts To 2030 (US$ Million)
- Figure 21. Throttle Mode Market Revenue and Forecasts To 2030 (US$ Million)
- Figure 22. E-Bike Market Breakdown by Region, 2022 and 2030 (%)
- Figure 23. North America E-Bike Market Revenue and Forecasts To 2030 (US$ Mn)
- Figure 24. North America E-Bike Market Breakdown by Technology (2022 and 2030)
- Figure 25. North America E-Bike Market Breakdown by Motor Type (2022 and 2030)
- Figure 26. North America E-Bike Market Breakdown by Class (2022 and 2030)
- Figure 27. North America E-Bike Market Breakdown by Mode (2022 and 2030)
- Figure 28. North America E-Bike Market Breakdown by Key Countries, 2022 and 2030 (%)
- Figure 29. US E-Bike Market Revenue and Forecasts To 2030 (US$ Mn)
- Figure 30. Canada E-Bike Market Revenue and Forecasts To 2030 (US$ Mn)
- Figure 31. Mexico E-Bike Market Revenue and Forecasts To 2030 (US$ Mn)
- Figure 32. Europe E-Bike Market Revenue and Forecasts To 2030 (US$ Mn)
- Figure 33. Europe E-Bike Market Breakdown by Battery Type (2022 and 2030)
- Figure 34. Europe E-Bike Market Breakdown by Motor Type (2022 and 2030)
- Figure 35. Europe E-Bike Market Breakdown by Class (2022 and 2030)
- Figure 36. Europe E-Bike Market Breakdown by Mode (2022 and 2030)
- Figure 37. Europe E-Bike Market Breakdown by Key Countries, 2022 and 2030 (%)
- Figure 38. Germany E-Bike Market Revenue and Forecasts To 2030 (US$ Mn)
- Figure 39. France E-Bike Market Revenue and Forecasts To 2030 (US$ Mn)
- Figure 40. Italy E-Bike Market Revenue and Forecasts To 2030 (US$ Mn)
- Figure 41. UK E-Bike Market Revenue and Forecasts To 2030 (US$ Mn)
- Figure 42. Netherland E-Bike Market Revenue and Forecasts To 2030 (US$ Mn)
- Figure 43. Rest of Europe E-Bike Market Revenue and Forecasts To 2030 (US$ Mn)
- Figure 44. Asia Pacific E-Bike Market Revenue and Forecasts To 2030 (US$ Mn)
- Figure 45. Asia Pacific E-Bike Market Breakdown by Batter Type (2022 and 2030)
- Figure 46. Asia Pacific E-Bike Market Breakdown by Motor Type (2022 and 2030)
- Figure 47. Asia Pacific E-Bike Market Breakdown by Class (2022 and 2030)
- Figure 48. Asia Pacific E-Bike Market Breakdown by Mode (2022 and 2030)
- Figure 49. Asia Pacific E-Bike Market Breakdown by Key Countries, 2022 and 2030 (%)
- Figure 50. Australia E-Bike Market Revenue and Forecasts To 2030 (US$ Mn)
- Figure 51. China E-Bike Market Revenue and Forecasts To 2030 (US$ Mn)
- Figure 52. India E-Bike Market Revenue and Forecasts To 2030 (US$ Mn)
- Figure 53. Japan E-Bike Market Revenue and Forecasts To 2030 (US$ Mn)
- Figure 54. South Korea E-Bike Market Revenue and Forecasts To 2030 (US$ Mn)
- Figure 55. Rest of Asia Pacific E-Bike Market Revenue and Forecasts To 2030 (US$ Mn)
- Figure 56. Middle East & Africa E-Bike Market Revenue and Forecasts To 2030 (US$ Mn)
- Figure 57. Middle East & Africa E-Bike Market Breakdown by Battery Type (2022 and 2030)
- Figure 58. Middle East & Africa E-Bike Market Breakdown by Motor Type (2022 and 2030)
- Figure 59. Middle East & Africa E-Bike Market Breakdown by Class (2022 and 2030)
- Figure 60. Middle East & Africa E-Bike Market Breakdown by Mode (2022 and 2030)
- Figure 61. Middle East & Africa E-Bike Market Breakdown by Key Countries, 2022 and 2030 (%)
- Figure 62. UAE E-Bike Market Revenue and Forecasts To 2030 (US$ Mn)
- Figure 63. Saudi Arabia E-Bike Market Revenue and Forecasts To 2030 (US$ Mn)
- Figure 64. South Africa E-Bike Market Revenue and Forecasts To 2030 (US$ Mn)
- Figure 65. Rest of MEA E-Bike Market Revenue and Forecasts To 2030 (US$ Mn)
- Figure 66. South America E-Bike Market Revenue and Forecasts To 2030 (US$ Mn)
- Figure 67. South America E-Bike Market Breakdown by Battery Type (2022 and 2030)
- Figure 68. South America E-Bike Market Breakdown by Motor Type (2022 and 2030)
- Figure 69. South America E-Bike Market Breakdown by Class (2022 and 2030)
- Figure 70. South America E-Bike Market Breakdown by Mode (2022 and 2030)
- Figure 71. South America E-Bike Market Breakdown by Key Countries, 2022 and 2030 (%)
- Figure 72. Brazil E-Bike Market Revenue and Forecasts To 2030 (US$ Mn)
- Figure 73. Argentina E-Bike Market Revenue and Forecasts To 2030 (US$ Mn)
- Figure 74. Rest of SAM E-Bike Market Revenue and Forecasts To 2030 (US$ Mn)
- Figure 75. Company Positioning & Concentration
The e-bike market is expected to grow from US$ 39,660.1 Million in 2022 to US$ 1,08,604.6 Million by 2030. The E-Bike market is estimated to register a CAGR of 13.4% from 2022 to 2030.
Growing urbanization, rising investments in cycling track development, and increasing consumer awareness regarding environmentally friendly transportation drive the e-bike market growth. Governments of several countries announce ample investments and subsidies for the adoption of e-bikes. Also, rising urbanization and increasing government spending on cycling tracks and e-bike connection infrastructure would offer opportunities for the global e-bike market in the coming years. According to the UN Organizations, around 55.0% of people around the globe live in urban areas, and it is growing at a rapid pace to reach 68% by 2050. Transportation systems are not built to cope with the future demand of rising congestion and pollution. To tackle such problems, the key players are launching connected e-bikes with built-in scanners to pay and lock. Several business entities and key players are adopting multiple strategies, such as partnerships and collaborations, to provide connected e-bikes for traveling short distances to avoid traffic congestion.
As of April 2021, the EU countries' National Environmental Fund offers subsidies ranging from US$ 375 to 540 for e-bike purchases funded by the government. Due to support and funding initiatives of the EU countries' governments, e-bike sales in these countries increased from 3.7 million in 2019 to 5.5 million in 2022, a rise of 48.6%.
The European e-bike market is the second largest growing owing to rising consumer awareness toward eco-friendly transportation. Germany is home to many automobile manufacturing facilities, which constantly focus on the development of electric vehicles. Further, major European countries such as Spain, the UK, the Netherlands, Germany, and Italy are experiencing tremendous growth in e-bike adoption. As per the Confederation of the European Bicycle Industries (CONEBI), the demand for e-bikes in the region is boosting yearly; the demand grew by ~35% in 2019 compared to the last year. With the increasing count of e-bikes/electric vehicles, the governments of European countries are making significant developments in their EV charging infrastructure; this has also led to a surge in the number of third-party service providers across the countries.
Increasing Prices of Fuel and Rising Adoption of Environment-Friendly Transportation
The average price of gasoline across the world is US$ 3.32 per gallon in 2023 and is projected to reach US$ 3.79 per gallon by 2025 and US$ 5 per gallon by 2030 for regular gasoline. The high price of fuel and the rise in demand for affordable transportation fuel the demand for e-bikes. Further, air pollution is a rapidly growing major environmental concern. The global cost of air pollution reached US$ 2.9 trillion in 2020, representing around 3.3% of the global GDP. Also, air pollution costs at least US$ 95 billion per year in India, which can be reduced by adopting bicycles and e-bike trips. Cycling using e-bikes is used to travel short distances. Adopting e-bike and cycling usage can reduce 2 Giga tons of CO2 emissions annually. At the global level, cycling and e-bike usage can reduce an additional cost by US$ 836 billion annually. Thus, the demand for sustainable, environment-friendly transportation has increased to reduce the cost of this pollution, driving market growth. As a result, several countries' governments have planned to provide subsidies for clean and green transportation to reduce air pollution. According to the United Nations Organization Report in 2021, the annual investment in sustainable transportation was valued at US$ 1.4 to US$ 2.1 trillion. The spending involves electric vehicle manufacturing, charging stations, and e-bike production.
Asia Pacific is expected to dominate the global e-bike market in 2022 due to the presence of several local manufacturers in China and Japan. China's e-bike production is the largest, reaching around 45.5 million in 2021, owing to the presence of raw material providers, low costs of labor, and favorable government schemes to promote penetration of e-bikes. Also, Chinese consumers are aware of the benefits of environmentally friendly transportation and invest in e-bikes to travel short distances and avoid the traffic in their urban areas. According to the Chinese Bicycle Organization, China is the world's largest consumer and exporter of electric bicycles. In the country, more than 300 million electric bicycles are being used. In 2020, China produced around 41.3 million electric bicycles and exported more than 2.0 million across the world. In the country, more than 50 million people use e-bikes owing to their low cost, convenience, and relatively energy-efficient transportation. China is the dominant country that uses e-bikes as a travel mode.
The e-bike market in Japan and India is growing rapidly owing to rising government schemes and funding to promote e-bike mobility penetration. In March 2020, India's finance minister launched the PLI scheme that provides subsidies for the e-cycles. The government announced an investment of US$ 0.24 million in creating national manufacturing facilities. The scheme was introduced to promote the production of e-bikes and EVs to meet the local demand.
The E-bike market in China is considered to be a promising market with tremendous potential for growth. Rapid urbanization and rising traffic congestion problems in China created massive demand for e-bikes. In 2021, China sold more than 45 million e-bikes globally and domestically, owing to rising demand from developed and developing countries. China is expected to hold the largest share of the global e-bikes market in 2022 due to the presence of raw materials, low costs of labor, and the presence of several local manufacturers. As of 2022, China has more than 300 e-bikes on its roads, and the count is increasing rapidly. Governments of China and India establish subsidy schemes to promote electric vehicle sales to reduce carbon footprints. The Ministry of Finance and Commerce in China offers the maximum subsidy of up to US$ 36 per vehicle for e-bikes in rural areas, with 80% of subsidies from the central government's budget and 20% from the provincial budget.
China, India, Japan, Australia, and other countries support the growth of e-mobility manufacturing. The countries are offering incentives and funding for clean transportation adoption across the Asia Pacific countries. The Chinese government offers subsidies from US$ 35 to 80 on e-bike purchases to promote clean transport. There are around 300 million electric bikes in China as of 2021, and the number is increasing rapidly due to their rising popularity and government policy initiatives.
North America's e-bike market is projected to grow with the highest CAGR during the forecast period, owing to the rising adoption of e-bikes for outdoor recreational activities. Outdoor activities such as trekking, bicycle riding, and mountain biking are also gaining popularity in the US and Canada. Also, the government supports opting for environment-friendly transportation. The US Democrats passed the bill with around US$ 1.75 trillion in funding as the Build Back Better Act for society safety.
The market initiative is a strategy adopted by companies to expand their footprint across the world and meet the growing demands of their customers. Players in the e-bike market mainly focus on product enhancements by implementing advanced technologies. Signing partnerships, contracts, and joint venture deals; funding; and inaugurating new offices worldwide permit the company to maintain its brand name globally.
Key players of e-bikes operating across the world are focused on developing lightweight vehicles for short-distance traveling in urban areas. The rising development of e-bikes with advanced motor systems and in-built smart app facilities will drive the e-bikes market growth in the coming years.
In June 2023, Robert Bosch GmbH, an electric bike motor and drive systems manufacturer, launched an advanced e-bike system and e-bikes. The first product launched by the company includes an e-bike motor named Performance Line SX, designed for manufacturing lightweight e-MTB and e-gravel bikes. Also, the company further launched an e-bike Smart System Software Application for its e-bikes. This system is coupled with the drive units on e-city and e-trekking bikes. The riders benefit from all the Smart with compatible e-shift automatic transmission. Other innovations for E-bike, e-MTB, e-Gravel, and e-Urban include Compact Tube 400 battery and Power 250 range extender, Sprint riding mode (SPRNT), and Mini Remote Drop bar variant for e-Gravel.
In April 2023, udChalo, an India-based e-bike start-up, launched an electric bicycle named Vir E-Bike for armed forces and individual users in India. The Vir Bike can withstand harsh weather and road conditions in India.
In January 2023, FIREFOX BIKES, a cycle manufacturer, launched Urban Eco's first application-controlled electric bike in India. The e-bike is made using German technology, with all new features controlled using the Firefox Fit application.
In September 2022, Yamaha Motor launched the YDX-TORC mountain e-bike model, featuring the top-end PW-X drive unit. Yamaha offers several e-MTB models, including YDX-MORO and YDX-MORO Pro, all-mountain e-bikes.
In November 2020, AlphaVector, an e-bike manufacturer in India, launched an e-bicycle, Meraki Ninety-One, for just US$ 375, which does not require a license to ride in India.
In June 2020, Bolt, a ride-hailing firm, launched an e-bike-sharing service in Paris, France. The company further planned to expand to more European countries. The service aimed to contribute to the company's Green Plan. This adoption of e-bikes helps offset CO2 emissions in the European transportation sector.
Haibike; Aventon Bikes; Giant Manufacturing Co Ltd; Merida Industry Co., Ltd.; Pedego Electric Bikes; Robert Bosch GmbH; Specialized Bicycle Components, Inc.; Shimano Inc.; Trek Bicycle Corp.; and Yamaha Motor Co Ltd are among the key e-bike market players profiled in the report. Several other major e-bike market players were studied and analyzed to view the market and its ecosystem. The e-bike market report provides detailed market insights, which help the key players strategize their growth.
Reasons to Buy:
- Save and reduce time carrying out entry-level research by identifying the growth, size, leading players and segments in the market.
- Highlights key business priorities in order to assist companies to realign their business strategies
- The key findings and recommendations highlight crucial progressive industry trends in the global defense integrated antenna market, thereby allowing players across the value chain to develop effective long-term strategies
- Analysis based on each country’s sale of the e-bikes and their average pricing are being considered. The report is made with extensive primary and secondary research for every country mentioned in the scope. We have collected the sale and pricing information of every country to calculate the market size and share.
- Develop/modify business expansion plans by using substantial growth offering developed and emerging markets
- Scrutinize in-depth global market trends and outlook coupled with the factors driving the market, as well as those hindering it
- Enhance the decision-making process by understanding the strategies that underpin commercial interest with respect to client products, segmentation, pricing and distribution
Table Of Contents
1. Introduction
- 1.1 The Insight Partners Research Report Guidance
- 1.2 Market Segmentation
2. Executive Summary
- 2.1 Key Insights
- 2.2 Market Attractiveness
3. Research Methodology
- 3.1 Coverage
- 3.2 Secondary Research
- 3.3 Primary Research
4. E-Bike Market Landscape
- 4.1 Overview
- 4.2 PEST Analysis
- 4.3 Ecosystem Analysis
- 4.3.1 List of E-Bike Suppliers
5. E-Bike Market - Key Industry Dynamics
- 5.1 E-Bike Market - Key Industry Dynamics
- 5.2 Market Drivers
- 5.2.1 Growth of Outdoor Sports and Adventurous Activities
- 5.2.2 Government Support to Lower Carbon Emissions Transportation
- 5.2.3 Increasing Prices of Fuel and Rising Adoption of Environment-Friendly Transportation
- 5.3 Market Restraints
- 5.3.1 High Cost of E-Bikes and Requirement of Huge Capital Investments in Their Manufacturing
- 5.4 Market Opportunities
- 5.4.1 Rising Adoption of Connected E-Bikes Among Business and Government Sectors
- 5.5 Future Trends
- 5.5.1 Development of E-Bikes Using Lightweight Material and Advanced Smart Systems
- 5.6 Impact of Drivers and Restraints:
6. E-Bike Market - Global Market Analysis
- 6.1 E-Bike Market Revenue (US$ Million), 2022 - 2030
- 6.2 E-Bike Market Forecast and Analysis
7. E-Bike Market Analysis - Battery Type
- 7.1 Lithium-Ion
- 7.1.1 Overview
- 7.1.2 Lithium-Ion Market, Revenue and Forecast to 2030 (US$ Million)
- 7.2 Lithium-Ion Polymer
- 7.2.1 Overview
- 7.2.2 Lithium-Ion Polymer Market, Revenue and Forecast to 2030 (US$ Million)
- 7.3 Lead Acid
- 7.3.1 Overview
- 7.3.2 Lead Acid Market, Revenue and Forecast to 2030 (US$ Million)
- 7.4 Nickel Metal Hydride
- 7.4.1 Overview
- 7.4.2 Nickel Metal Hydride Market, Revenue and Forecast to 2030 (US$ Million)
8. E-Bike Market Analysis - Motor Type
- 8.1 Mid Motor
- 8.1.1 Overview
- 8.1.2 Mid Motor Market Revenue, and Forecast to 2030 (US$ Million)
- 8.2 Hub Motor
- 8.2.1 Overview
- 8.2.2 Hub Motor Market Revenue, and Forecast to 2030 (US$ Million)
9. E-Bike Market Analysis - Class
- 9.1 Class I
- 9.1.1 Overview
- 9.1.2 Class I Market Revenue, and Forecast to 2030 (US$ Million)
- 9.2 Class II
- 9.2.1 Overview
- 9.2.2 Class II Market Revenue, and Forecast to 2030 (US$ Million)
- 9.3 Class III
- 9.3.1 Overview
- 9.3.2 Class III Market Revenue, and Forecast to 2030 (US$ Million)
10. E-Bike Market Analysis - Mode
- 10.1 Pedal Assisted Mode
- 10.1.1 Overview
- 10.1.2 Pedal Assisted Mode Market Revenue, and Forecast to 2030 (US$ Million)
- 10.2 Throttle Mode
- 10.2.1 Overview
- 10.2.2 Throttle Mode Market Revenue, and Forecast to 2030 (US$ Million)
11. E-Bike Market - Geographical Analysis
- 11.1 Overview
- 11.2 North America
- 11.2.1 North America E-Bike Market Overview
- 11.2.2 North America E-Bike Market Revenue and Forecasts to 2030 (US$ Mn)
- 11.2.3 North America E-Bike Market Breakdown by Battery Type
- 11.2.3.1 North America E-Bike Market Revenue and Forecasts and Analysis - By Battery Type
- 11.2.4 North America E-Bike Market Breakdown by Motor Type
- 11.2.4.1 North America E-Bike Market Revenue and Forecasts and Analysis - By Motor Type
- 11.2.5 North America E-Bike Market Breakdown by Class
- 11.2.5.1 North America E-Bike Market Revenue and Forecasts and Analysis - By Class
- 11.2.6 North America E-Bike Market Breakdown by Mode
- 11.2.6.1 North America E-Bike Market Revenue and Forecasts and Analysis - By Mode
- 11.2.7 North America E-Bike Market Revenue and Forecasts and Analysis - By Country
- 11.2.7.1 North America E-Bike Market Revenue and Forecasts and Analysis - By Country
- 11.2.7.2 US E-Bike Market Revenue and Forecasts to 2030 (US$ Mn)
- 11.2.7.2.1 US E-Bike Market Breakdown by Battery Type
- 11.2.7.2.2 US E-Bike Market Breakdown by Motor Type
- 11.2.7.2.3 US E-Bike Market Breakdown by Class
- 11.2.7.2.4 US E-Bike Market Breakdown by Mode
- 11.2.7.3 Canada E-Bike Market Revenue and Forecasts to 2030 (US$ Mn)
- 11.2.7.3.1 Canada E-Bike Market Breakdown by Battery Type
- 11.2.7.3.2 Canada E-Bike Market Breakdown by Motor Type
- 11.2.7.3.3 Canada E-Bike Market Breakdown by Class
- 11.2.7.3.4 Canada E-Bike Market Breakdown by Mode
- 11.2.7.4 Mexico E-Bike Market Revenue and Forecasts to 2030 (US$ Mn)
- 11.2.7.4.1 Mexico E-Bike Market Breakdown by Battery Type
- 11.2.7.4.2 Mexico E-Bike Market Breakdown by Motor Type
- 11.2.7.4.3 Mexico E-Bike Market Breakdown by Class
- 11.2.7.4.4 Mexico E-Bike Market Breakdown by Mode
- 11.3 Europe
- 11.3.1 Europe E-Bike Market Overview
- 11.3.2 Europe E-Bike Market Revenue and Forecasts to 2030 (US$ Mn)
- 11.3.3 Europe E-Bike Market Breakdown by Battery Type
- 11.3.3.1 Europe E-Bike Market Revenue and Forecasts and Analysis - By Battery Type
- 11.3.4 Europe E-Bike Market Breakdown by Motor Type
- 11.3.4.1 Europe E-Bike Market Revenue and Forecasts and Analysis - By Motor Type
- 11.3.5 Europe E-Bike Market Breakdown by Class
- 11.3.5.1 Europe E-Bike Market Revenue and Forecasts and Analysis - By Class
- 11.3.6 Europe E-Bike Market Breakdown by Mode
- 11.3.6.1 Europe E-Bike Market Revenue and Forecasts and Analysis - By Mode
- 11.3.7 Europe E-Bike Market Revenue and Forecasts and Analysis - By Country
- 11.3.7.1 Europe E-Bike Market Revenue and Forecasts and Analysis - By Country
- 11.3.7.2 Germany E-Bike Market Revenue and Forecasts to 2030 (US$ Mn)
- 11.3.7.2.1 Germany E-Bike Market Breakdown by Battery Type
- 11.3.7.2.2 Germany E-Bike Market Breakdown by Motor Type
- 11.3.7.2.3 Germany E-Bike Market Breakdown by Class
- 11.3.7.2.4 Germany E-Bike Market Breakdown by Mode
- 11.3.7.3 France E-Bike Market Revenue and Forecasts to 2030 (US$ Mn)
- 11.3.7.3.1 France E-Bike Market Breakdown by Battery Type
- 11.3.7.3.2 France E-Bike Market Breakdown by Motor Type
- 11.3.7.3.3 France E-Bike Market Breakdown by Class
- 11.3.7.3.4 France E-Bike Market Breakdown by Mode
- 11.3.7.4 Italy E-Bike Market Revenue and Forecasts to 2030 (US$ Mn)
- 11.3.7.4.1 Italy E-Bike Market Breakdown by Battery Type
- 11.3.7.4.2 Italy E-Bike Market Breakdown by Motor Type
- 11.3.7.4.3 Italy E-Bike Market Breakdown by Class
- 11.3.7.4.4 Italy E-Bike Market Breakdown by Mode
- 11.3.7.5 UK E-Bike Market Revenue and Forecasts to 2030 (US$ Mn)
- 11.3.7.5.1 UK E-Bike Market Breakdown by Battery Type
- 11.3.7.5.2 UK E-Bike Market Breakdown by Motor Type
- 11.3.7.5.3 UK E-Bike Market Breakdown by Class
- 11.3.7.5.4 UK E-Bike Market Breakdown by Mode
- 11.3.7.6 Netherland E-Bike Market Revenue and Forecasts to 2030 (US$ Mn)
- 11.3.7.6.1 Netherland E-Bike Market Breakdown by Battery Type
- 11.3.7.6.2 Netherland E-Bike Market Breakdown by Motor Type
- 11.3.7.6.3 Netherland E-Bike Market Breakdown by Class
- 11.3.7.6.4 Netherland E-Bike Market Breakdown by Mode
- 11.3.7.7 Rest of Europe E-Bike Market Revenue and Forecasts to 2030 (US$ Mn)
- 11.3.7.7.1 Rest of Europe E-Bike Market Breakdown by Battery Type
- 11.3.7.7.2 Rest of Europe E-Bike Market Breakdown by Motor Type
- 11.3.7.7.3 Rest of Europe E-Bike Market Breakdown by Class
- 11.3.7.7.4 Rest of Europe E-Bike Market Breakdown by Mode
- 11.4 Asia Pacific E-Bike Market
- 11.4.1 Overview
- 11.4.2 Asia Pacific E-Bike Market Revenue and Forecasts to 2030 (US$ Mn)
- 11.4.3 Asia Pacific E-Bike Market Breakdown by Battery Type
- 11.4.3.1 Asia Pacific E-Bike Market Revenue and Forecasts and Analysis - By Battery Type
- 11.4.4 Asia Pacific E-Bike Market Breakdown by Motor Type
- 11.4.4.1 Asia Pacific E-Bike Market Revenue and Forecasts and Analysis - By Motor Type
- 11.4.5 Asia Pacific E-Bike Market Breakdown by Class
- 11.4.5.1 Asia Pacific E-Bike Market Revenue and Forecasts and Analysis - By Class
- 11.4.6 Asia Pacific E-Bike Market Breakdown by Mode
- 11.4.6.1 Asia Pacific E-Bike Market Revenue and Forecasts and Analysis - By Mode
- 11.4.7 Asia Pacific E-Bike Market Revenue and Forecasts and Analysis - By Country
- 11.4.7.1 Asia Pacific E-Bike Market Revenue and Forecasts and Analysis - By Country
- 11.4.7.2 Australia E-Bike Market Revenue and Forecasts to 2030 (US$ Mn)
- 11.4.7.2.1 Australia E-Bike Market Breakdown by Battery Type
- 11.4.7.2.2 Australia E-Bike Market Breakdown by Motor Type
- 11.4.7.2.3 Australia E-Bike Market Breakdown by Class
- 11.4.7.2.4 Australia E-Bike Market Breakdown by Mode
- 11.4.7.3 China E-Bike Market Revenue and Forecasts to 2030 (US$ Mn)
- 11.4.7.3.1 China E-Bike Market Breakdown by Battery Type
- 11.4.7.3.2 China E-Bike Market Breakdown by Motor Type
- 11.4.7.3.3 China E-Bike Market Breakdown by Class
- 11.4.7.3.4 China E-Bike Market Breakdown by Mode
- 11.4.7.4 India E-Bike Market Revenue and Forecasts to 2030 (US$ Mn)
- 11.4.7.4.1 India E-Bike Market Breakdown by Battery Type
- 11.4.7.4.2 India E-Bike Market Breakdown by Motor Type
- 11.4.7.4.3 India E-Bike Market Breakdown by Class
- 11.4.7.4.4 India E-Bike Market Breakdown by Mode
- 11.4.7.5 Japan E-Bike Market Revenue and Forecasts to 2030 (US$ Mn)
- 11.4.7.5.1 Japan E-Bike Market Breakdown by Battery Type
- 11.4.7.5.2 Japan E-Bike Market Breakdown by Motor Type
- 11.4.7.5.3 Japan E-Bike Market Breakdown by Class
- 11.4.7.5.4 Japan E-Bike Market Breakdown by Mode
- 11.4.7.6 South Korea E-Bike Market Revenue and Forecasts to 2030 (US$ Mn)
- 11.4.7.6.1 South Korea E-Bike Market Breakdown by Battery Type
- 11.4.7.6.2 South Korea E-Bike Market Breakdown by Motor Type
- 11.4.7.6.3 South Korea E-Bike Market Breakdown by Class
- 11.4.7.6.4 South Korea E-Bike Market Breakdown by Mode
- 11.4.7.7 Rest of Asia Pacific E-Bike Market Revenue and Forecasts to 2030 (US$ Mn)
- 11.4.7.7.1 Rest of Asia Pacific E-Bike Market Breakdown by Battery Type
- 11.4.7.7.2 Rest of Asia Pacific E-Bike Market Breakdown by Motor Type
- 11.4.7.7.3 Rest of Asia Pacific E-Bike Market Breakdown by Class
- 11.4.7.7.4 Rest of Asia Pacific E-Bike Market Breakdown by Mode
- 11.5 Middle East & Africa
- 11.5.1 Middle East & Africa E-Bike Market Overview
- 11.5.2 Middle East & Africa E-Bike Market Revenue and Forecasts to 2030 (US$ Mn)
- 11.5.3 Middle East & Africa E-Bike Market Breakdown by Battery Type
- 11.5.3.1 Middle East & Africa E-Bike Market Revenue and Forecasts and Analysis - By Battery Type
- 11.5.4 Middle East & Africa E-Bike Market Breakdown by Motor Type
- 11.5.4.1 Middle East & Africa E-Bike Market Revenue and Forecasts and Analysis - By Motor Type
- 11.5.5 Middle East & Africa E-Bike Market Breakdown by Class
- 11.5.5.1 Middle East & Africa E-Bike Market Revenue and Forecasts and Analysis - By Class
- 11.5.5.2 Middle East & Africa E-Bike Market Revenue and Forecasts and Analysis - By Mode
- 11.5.6 Middle East & Africa E-Bike Market Revenue and Forecasts and Analysis - By Country
- 11.5.6.1 Middle East & Africa E-Bike Market Revenue and Forecasts and Analysis - By Country
- 11.5.6.2 UAE E-Bike Market Revenue and Forecasts to 2030 (US$ Mn)
- 11.5.6.2.1 UAE E-Bike Market Breakdown by Battery Type
- 11.5.6.2.2 UAE E-Bike Market Breakdown by Motor Type
- 11.5.6.2.3 UAE E-Bike Market Breakdown by Class
- 11.5.6.2.4 UAE E-Bike Market Breakdown by Mode
- 11.5.6.3 Saudi Arabia E-Bike Market Revenue and Forecasts to 2030 (US$ Mn)
- 11.5.6.3.1 Saudi Arabia E-Bike Market Breakdown by Battery Type
- 11.5.6.3.2 Saudi Arabia E-Bike Market Breakdown by Motor Type
- 11.5.6.3.3 Saudi Arabia E-Bike Market Breakdown by Class
- 11.5.6.3.4 Saudi Arabia E-Bike Market Breakdown by Mode
- 11.5.6.4 South Africa E-Bike Market Revenue and Forecasts to 2030 (US$ Mn)
- 11.5.6.4.1 South Africa E-Bike Market Breakdown by Battery Type
- 11.5.6.4.2 South Africa E-Bike Market Breakdown by Motor Type
- 11.5.6.4.3 South Africa E-Bike Market Breakdown by Class
- 11.5.6.4.4 South Africa E-Bike Market Breakdown by Mode
- 11.5.6.5 Rest of MEA E-Bike Market Revenue and Forecasts to 2030 (US$ Mn)
- 11.5.6.5.1 Rest of MEA E-Bike Market Breakdown by Battery Type
- 11.5.6.5.2 Rest of MEA E-Bike Market Breakdown by Motor Type
- 11.5.6.5.3 Rest of MEA E-Bike Market Breakdown by Class
- 11.5.6.5.4 Rest of MEA E-Bike Market Breakdown by Mode
- 11.6 South America
- 11.6.1 South America E-Bike Market Overview
- 11.6.2 South America E-Bike Market Revenue and Forecasts to 2030 (US$ Mn)
- 11.6.3 South America E-Bike Market Breakdown by Battery Type
- 11.6.3.1 South America E-Bike Market Revenue and Forecasts and Analysis - By Battery Type
- 11.6.4 South America E-Bike Market Breakdown by Motor Type
- 11.6.4.1 South America E-Bike Market Revenue and Forecasts and Analysis - By Motor Type
- 11.6.5 South America E-Bike Market Breakdown by Class
- 11.6.5.1 South America E-Bike Market Revenue and Forecasts and Analysis - By Class
- 11.6.6 South America E-Bike Market Breakdown by Mode
- 11.6.6.1 South America E-Bike Market Revenue and Forecasts and Analysis - By Mode
- 11.6.7 South America E-Bike Market Revenue and Forecasts and Analysis - By Countries
- 11.6.7.1 Brazil E-Bike Market Revenue and Forecasts to 2030 (US$ Mn)
- 11.6.7.1.1 Brazil E-Bike Market Breakdown by Battery Type
- 11.6.7.1.2 Brazil E-Bike Market Breakdown by Motor Type
- 11.6.7.1.3 Brazil E-Bike Market Breakdown by Class
- 11.6.7.1.4 Brazil E-Bike Market Breakdown by Mode
- 11.6.7.2 Argentina E-Bike Market Revenue and Forecasts to 2030 (US$ Mn)
- 11.6.7.2.1 Argentina E-Bike Market Breakdown by Battery Type
- 11.6.7.2.2 Argentina E-Bike Market Breakdown by Motor Type
- 11.6.7.2.3 Argentina E-Bike Market Breakdown by Class
- 11.6.7.2.4 Argentina E-Bike Market Breakdown by Mode
- 11.6.7.3 Rest of SAM E-Bike Market Revenue and Forecasts to 2030 (US$ Mn)
- 11.6.7.3.1 Rest of SAM E-Bike Market Breakdown by Battery Type
- 11.6.7.3.2 Rest of SAM E-Bike Market Breakdown by Motor Type
- 11.6.7.3.3 Rest of SAM E-Bike Market Breakdown by Class
- 11.6.7.3.4 Rest of SAM E-Bike Market Breakdown by Mode
- 11.6.7.1 Brazil E-Bike Market Revenue and Forecasts to 2030 (US$ Mn)
12. E-Bike Market - Impact of COVID-19 Pandemic
- 12.1 Pre & Post Covid-19 Impact
13. Competitive Landscape
- 13.1 Heat Map Analysis by Key Players
- 13.2 Company Positioning & Concentration
14. Industry Landscape
- 14.1 Overview
- 14.2 Market Initiative
- 14.3 New Product Development
- 14.4 Merger and Acquisition
15. Company Profiles
- 15.1 Haibike
- 15.1.1 Key Facts
- 15.1.2 Business Description
- 15.1.3 Products and Services
- 15.1.4 Financial Overview
- 15.1.5 SWOT Analysis
- 15.1.6 Key Developments
- 15.2 Aventon Bikes
- 15.2.1 Key Facts
- 15.2.2 Business Description
- 15.2.3 Products and Services
- 15.2.4 Financial Overview
- 15.2.5 SWOT Analysis
- 15.2.6 Key Developments
- 15.3 Giant Manufacturing Co Ltd
- 15.3.1 Key Facts
- 15.3.2 Business Description
- 15.3.3 Products and Services
- 15.3.4 Financial Overview
- 15.3.5 SWOT Analysis
- 15.3.6 Key Developments
- 15.4 Merida Industry Co., Ltd.
- 15.4.1 Key Facts
- 15.4.2 Business Description
- 15.4.3 Products and Services
- 15.4.4 Financial Overview
- 15.4.5 SWOT Analysis
- 15.4.6 Key Developments
- 15.5 Pedego Electric Bikes
- 15.5.1 Key Facts
- 15.5.2 Business Description
- 15.5.3 Products and Services
- 15.5.4 Financial Overview
- 15.5.5 SWOT Analysis
- 15.5.6 Key Developments
- 15.6 Robert Bosch GmbH
- 15.6.1 Key Facts
- 15.6.2 Business Description
- 15.6.3 Products and Services
- 15.6.4 Financial Overview
- 15.6.5 SWOT Analysis
- 15.6.6 Key Developments
- 15.7 Specialized Bicycle Components, Inc.
- 15.7.1 Key Facts
- 15.7.2 Business Description
- 15.7.3 Products and Services
- 15.7.4 Financial Overview
- 15.7.5 SWOT Analysis
- 15.7.6 Key Developments
- 15.8 Shimano Inc
- 15.8.1 Key Facts
- 15.8.2 Business Description
- 15.8.3 Products and Services
- 15.8.4 Financial Overview
- 15.8.5 SWOT Analysis
- 15.8.6 Key Developments
- 15.9 Trek Bicycle Corp
- 15.9.1 Key Facts
- 15.9.2 Business Description
- 15.9.3 Products and Services
- 15.9.4 Financial Overview
- 15.9.5 SWOT Analysis
- 15.9.6 Key Developments
- 15.10 Yamaha Motor Co Ltd
- 15.10.1 Key Facts
- 15.10.2 Business Description
- 15.10.3 Products and Services
- 15.10.4 Financial Overview
- 15.10.5 SWOT Analysis
- 15.10.6 Key Developments
16. Appendix
- 16.1 About The Insight Partners
- 16.2 Word Index
