|
|
市場調査レポート
商品コード
1360123
北米の殺ダニ剤市場の2028年までの予測-地域別分析:供給源、形態、作物タイプ別North America Miticides Market Forecast to 2028 -Regional Analysis - by Source (Bio-Based and Synthetic), Form (Dry and Liquid), and Crop Type (Fruits and Vegetables, Cereals and Grains, Oilseeds and Pulses, and Others) |
||||||
|
|
|||||||


| 北米の殺ダニ剤市場の2028年までの予測-地域別分析:供給源、形態、作物タイプ別 |
|
出版日: 2023年08月18日
発行: The Insight Partners
ページ情報: 英文 119 Pages
納期: 即納可能
|
- 全表示
- 概要
- 図表
- 目次
北米の殺ダニ剤市場は、2022年の1億3,502万米ドルから2028年には1億7,514万米ドルに成長すると予測されています。2022年から2028年までのCAGRは4.4%で成長すると推定されます。
果物・野菜需要の増加が北米の殺ダニ剤市場を牽引
食生活の乱れは、世界中で栄養不良や疾病の主な原因の一つとなっています。微量栄養素と食物繊維は健康に必要であり、果物や野菜にはそうした栄養素が豊富に含まれているため、健康的な食生活には欠かせないです。そのため、健康的な食生活に対する意識の高まりとともに、その需要は拡大しています。世界保健機関(WHO)と国連食糧農業機関(FAO)は、1人当たり1日400g以上の野菜と果物の摂取を推奨しています。この食生活は、心臓病、糖尿病、がん、肥満などの慢性疾患の予防に役立つと思われます。また、特に後進国の人々の微量栄養素の欠乏を予防・緩和することができます。野菜と果物の摂取不足は、世界の消化器がんによる死亡の14%、虚血性心疾患による死亡の11%、脳卒中による死亡の9%につながると推定されています。例えば2014年、FAOとWHOは「栄養に関するローマ宣言」と「行動枠組み」を発表しました。この行動計画は、安全で栄養価の高い果物や野菜、豆類、全粒穀物、魚などの動物性食品を年間を通じて入手できるようにする一方で、栄養と健康に悪影響を及ぼす加工食品の消費を制限することで、健康的な食事パターンを促進することに主眼を置いています。米国農務省によると、米国で消費可能な野菜の全体量は、2019年の国民一人当たり371.6ポンドから、2020年には382.5ポンドに増加します。また、世界の果物生産量は2000年から2019年にかけて54%(3億4,280万トン)増加し、2019年には9億7,330万トンに達します。このように、消費者の健康的な食生活へのシフトによる果物や野菜の消費の増加は、害虫から作物を保護するために適用される化学薬品の需要を強化しています。殺ダニ剤は果物や野菜をダニやダニから守る。したがって、作物保護化学物質に対する需要の高まりも殺ダニ剤の需要を後押ししています。
北米の殺ダニ剤市場の概要
北米の殺ダニ剤市場は、人口増加と政府補助金、好調な経済、強固な食品安全ネットにより成長しています。米国農務省(USDA)の報告によると、北米は食料の値ごろ感で最も高いランクにあります。米国の農業部門は、同国の経済に付加価値をもたらしています。2020年、米国の国内総生産(GDP)に対する農業の貢献度は0.6%を超えました。そのため、北米の農業セクターでは殺ダニ剤の需要が増加しています。
北米では、農業部門の成長と経済の他の部門とのバランスを取るために殺ダニ剤の使用を推進しています。この成長は主に、大規模生産を維持するために必要な化学肥料や農薬を使用して達成されます。国連食糧農業機関によると、米国はトウモロコシの最大生産国で、世界生産の32.9%を占めています。バンクスグラスマイト(BGM)やツメハダニ(TSSM)などのハダニ類は、主に北米のトウモロコシ生産に影響を及ぼしています。ダニによる傷害は、干ばつストレスと相まって、植物へのストレスを増大させ、光合成に悪影響を及ぼします。植物が早期に傷害を受けることで、収量ポテンシャルが失われ、穀物損失は6から48%、サイレージとして収穫されるトウモロコシでは40%もの収量損失となる可能性があります。捕食性昆虫を防除し、殺ダニ剤を使用しない場合、ダニの個体数は急速に増加する可能性があります。こうした要因から、北米では殺ダニ剤の使用が促進されています。北米の市場関係者は、油糧種子および豆類、穀物および穀類、果物および野菜などを生産するための農業用殺ダニ剤の製造に注力しています。企業は北米の潜在的動向に適応するため、中長期的な事業戦略を策定しています。
北米の殺ダニ剤市場の収益と2028年までの予測(金額)
北米の殺ダニ剤市場セグメンテーション
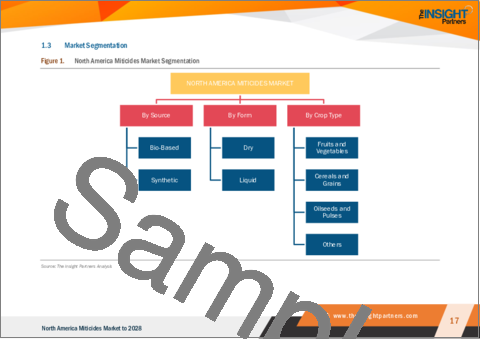
北米の殺ダニ剤市場は、発生源、形態、作物タイプ、国に区分されます。
供給源に基づき、北米の殺ダニ剤市場はバイオベースと合成に二分されます。2022年には、北米の殺ダニ剤市場では合成セグメントがより大きなシェアを記録しました。
北米の殺ダニ剤市場は形態に基づき、乾燥剤と液剤に区分されます。2022年には、北米の殺ダニ剤市場では液体セグメントが大きなシェアを占めています。
作物の種類に基づき、北米の殺ダニ剤市場は果物・野菜、穀物・穀類、油糧種子・豆類、その他に区分されます。2022年には、果物および野菜セグメントが北米の殺ダニ剤市場で最大のシェアを記録しました。
国別に見ると、北米の殺ダニ剤市場は米国、カナダ、メキシコに区分されます。2022年には、米国セグメントが北米の殺ダニ剤市場で最大のシェアを記録しました。
BASF SE、Bayer AG、Certis USA LLC、FMC Corp、Gowan Co、Kemin Industries Inc.Ltd.、Oro Agri International BV、Syngenta AG、UPL Ltd.が北米の殺ダニ剤市場の大手企業です。
目次
第1章 イントロダクション
第2章 キーポイント
第3章 調査手法
- 調査範囲
- 調査手法
- データ収集
- 一次インタビュー
- 仮説の策定
- マクロ経済要因分析
- 基礎数値の作成
- データの三角測量
- 国レベルのデータ
第4章 北米の殺ダニ剤市場情勢
- 市場概要
- ポーターのファイブフォース分析
- 新規参入業者の脅威
- 代替品の脅威
- 買い手の交渉力:市場参入の脅威
- 供給企業の交渉力
- 競争企業間の敵対関係
- エコシステム分析
- 原材料サプライヤー
- 製造業者
- 流通業者または供給業者
- 最終用途産業
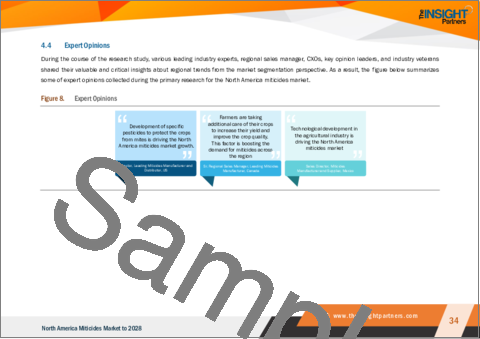
- 専門家の見解
第5章 北米の殺ダニ剤市場:主要市場力学
- 市場促進要因
- 作物保護と収量向上のための殺ダニ剤使用の増加
- 果物および野菜に対する需要の高まり
- 市場抑制要因
- 殺ダニ剤の有害作用に焦点を当てた規制
- 機会
- 作物保護慣行の継続的発展
- 今後の動向
- バイオベースの殺ダニ剤
- 影響分析
第6章 殺ダニ剤-北米市場分析
- 北米の殺ダニ剤市場~2028年までの数量と予測
第7章 殺ダニ剤-北米市場分析:供給源別
- 概要
- 北米の殺ダニ剤市場:供給源別(2021年および2028年)
- バイオベース
- 合成ベース
第8章 北米の殺ダニ剤市場分析:形態別
- 概要
- 北米の殺ダニ剤市場:形態別(2021年および2028年)
- 乾式
- 液体
第9章 北米の殺ダニ剤市場分析:作物タイプ別
- 概要
- 北米の殺ダニ剤市場:作物タイプ別(2021年および2028年)
- 果物および野菜
- 穀物および穀類
- 油糧種子および豆類
- その他
第10章 北米の殺ダニ剤市場:国別分析
- 北米
- 米国
- カナダ
- メキシコ
第11章 企業プロファイル
- Nihon Nohyaku Co. Ltd.
- Kemin Industries Inc.
- BASF SE
- Bayer AG
- FMC Corp
- Gowan Co
- Syngenta AG
- UPL Ltd
- Oro Agri International BV
- Certis USA LLC
第12章 付録
List Of Tables
- Table 1. North America Miticides Market -Volume and Forecast to 2028 (Tons)
- Table 2. North America Miticides Market -Revenue and Forecast to 2028 (US$ Million)
- Table 3. US Miticides Market, by Source - Volume and Forecast to 2028 (Tons)
- Table 4. US Miticides Market, by Source - Revenue and Forecast to 2028 (US$ Million)
- Table 5. US Miticides Market, by Form - Revenue and Forecast to 2028 (US$ Million)
- Table 6. US Miticides Market, by Crop Type - Revenue and Forecast to 2028 (US$ Million)
- Table 7. Canada: Miticides Market, by Source - Volume and Forecast to 2028 (Tons)
- Table 8. Canada: Miticides Market, by Source - Revenue and Forecast to 2028 (US$ Million)
- Table 9. Canada: Miticides Market, by Form - Revenue and Forecast to 2028 (US$ Million)
- Table 10. Canada: Miticides Market, by Crop Type - Revenue and Forecast to 2028 (US$ Million)
- Table 11. Mexico Miticides Market, by Source - Volume and Forecast to 2028 (Tons)
- Table 12. Mexico Miticides Market, by Source - Revenue and Forecast to 2028 (US$ Million)
- Table 13. Mexico Miticides Market, by Form - Revenue and Forecast to 2028 (US$ Million)
- Table 14. Mexico Miticides Market, by Crop Type - Revenue and Forecast to 2028 (US$ Million)
- Table 15. Glossary of Terms, North America Miticides Market
List Of Figures
- Figure 1. North America Miticides Market Segmentation
- Figure 2. North America Miticides Market Segmentation: By Country
- Figure 3. North America Miticides Market Overview
- Figure 4. North America Miticides Market, By Source
- Figure 5. North America Miticides Market, by Country
- Figure 6. Porter's Five Forces Analysis
- Figure 7. Ecosystem: North America Miticides Market
- Figure 8. Expert Opinions
- Figure 9. North America Miticides Market Impact Analysis of Drivers and Restraints
- Figure 10. North America Miticides Market - Volume and Forecast to 2028 (Tons)
- Figure 11. North America Miticides Market - Revenue and Forecast to 2028 (US$ Million)
- Figure 12. North America Miticides Market Revenue Share, By Source (2021 and 2028)
- Figure 13. Bio-Based: North America Miticides Market - Volume and Forecast To 2028 (Tons)
- Figure 14. Bio-Based: North America Miticides Market - Revenue and Forecast To 2028 (US$ Million)
- Figure 15. Synthetic: North America Miticides Market - Volume and Forecast To 2028 (Tons)
- Figure 16. Synthetic: North America Miticides Market - Revenue and Forecast To 2028 (US$ Million)
- Figure 17. North America Miticides Market Revenue Share, By Form (2021 and 2028)
- Figure 18. Dry: North America Miticides Market - Revenue and Forecast To 2028 (US$ Million)
- Figure 19. Liquid: North America Miticides Market - Revenue and Forecast To 2028 (US$ Million)
- Figure 20. North America Miticides Market Revenue Share, By Crop Type (2021 and 2028)
- Figure 21. Fruits and Vegetables: North America Miticides Market - Revenue and Forecast To 2028 (US$ Million)
- Figure 22. Cereals and Grains: North America Miticides Market - Revenue and Forecast To 2028 (US$ Million)
- Figure 23. Oilseeds and Pulses: North America Miticides Market - Revenue and Forecast To 2028 (US$ Million)
- Figure 24. Others: North America Miticides Market - Revenue and Forecast To 2028 (US$ Million)
- Figure 25. North America: Miticides Market, by Key Country - Revenue (2021) (US$ Million)
- Figure 26. North America: Miticides Market Revenue Share, by Key Country (2021 and 2028)
- Figure 27. US: Miticides Market -Volume and Forecast to 2028 (Tons)
- Figure 28. US: Miticides Market -Revenue and Forecast to 2028 (US$ Million)
- Figure 29. Canada: Miticides Market-Volume and Forecast to 2028 (Tons)
- Figure 30. Canada: Miticides Market-Revenue and Forecast to 2028 (US$ Million)
- Figure 31. Mexico: Miticides Market-Volume and Forecast to 2028 (Tons)
- Figure 32. Mexico: Miticides Market-Revenue and Forecast to 2028 (US$ Million)
The North America miticides market is expected to grow from US$ 135.02 million in 2022 to US$ 175.14 million by 2028. It is estimated to grow at a CAGR of 4.4% from 2022 to 2028.
Growing Demand for Fruits and Vegetables Drive North America Miticides Market
Poor diet is one of the major causes of malnutrition and diseases across the world. Micronutrients and dietary fibers are necessary for health, and fruits and vegetables are loaded with such nutrients, which makes them an essential part of a healthy diet. Thus, their demand is growing with the rising awareness about healthy diets. The World Health Organization (WHO) and the Food and Agriculture Organization (FAO) recommend a minimum consumption of 400 g of fruits and vegetables per person per day. This diet would help to prevent chronic diseases such as heart disease, diabetes, cancer, and obesity. It is also likely to prevent and alleviate several micronutrient deficiencies, especially in people from less developed countries. An insufficient intake of fruits and vegetables is estimated to lead to ~14% of deaths from gastrointestinal cancer worldwide, ~11% of those from ischemic heart disease, and ~9% of those caused by stroke. For instance, in 2014, FAO and WHO announced the Rome Declaration on Nutrition and the Framework for Action. This action plan mainly focused on promoting healthy dietary patterns by providing year-round access to safe and nutritious fruits and vegetables; pulses; whole grains; and animal-source foods such as fish, while limiting the consumption of processed foods that negatively affect nutrition and health. According to the US Department of Agriculture, the overall quantity of vegetables available for consumption in the US increased from 371.6 pounds per capita in 2019 to 382.5 pounds per capita in 2020. In addition, global fruit production went up by 54% (i.e., 342.8 million tons) from 2000 to 2019 to reach 973.3 million tons by 2019. Thus, the growing fruit and vegetable consumption due to consumers' shift toward healthy diets is bolstering demand for chemicals applied for the protection of crops from pests. Miticides protects fruits & vegetables form mites and ticks. Thus, the growing demand for crop protection chemicals is also bolstering the demand for miticides.
North America Miticides Market Overview
The North America miticides market is growing due to increased population and government subsidies, strong economies, and robust food safety nets. As per the reports of the US Department of Agriculture (USDA), North America ranks highest in food affordability. The agricultural sector in the US adds value to the economy of the country. In 2020, the contribution of agriculture to the US gross domestic product (GDP) was more than 0.6%. Hence, the demand for miticides is increasing in the sector in North America.
North America promotes the use of miticides to balance the growth of the agricultural sector with other sectors of the economy. The growth is mainly achieved using chemical fertilizers and pesticides required to sustain large-scale production. According to the Food and Agriculture Organization of the United Nations, the US is the largest producer of corn, accounting for ~32.9% of global production. Spider mites such as banks grass mites (BGM) and two-spotted spider mites (TSSM) mainly affect the production of corn in North America. The injury by the mites, in conjunction with drought stress, increases the stress on the plant and negatively impacts photosynthesis. Early plant injury can result in lost yield potential, which can have grain losses ranging from 6 to 48% and as high as 40% yield loss for corn harvested as silage. If predatory insects are controlled, and a miticide is not used, the mite population can increase rapidly. These factors are promoting the usage of miticides in North America. Market players in North America are focusing on manufacturing agricultural miticides to produce oilseeds and pulses, cereals and grains, and fruits and vegetables, among others. Companies are formulating mid and long-term business strategies to adapt to potential trends in North America.
North America Miticides Market Revenue and Forecast to 2028 (US$ Million)
North America Miticides Market Segmentation
The North America Miticides market is segmented into source, form, crop type, and country.
Based on source, the North America miticides market is bifurcated into bio-based and synthetic. In 2022, the synthetic segment registered a larger share in the North America miticides market.
Based on form, the North America miticides market is segmented into dry and liquid. In 2022, the liquid segment registered a larger share in the North America miticides market.
Based on crop type, the North America miticides market is segmented into fruits and vegetables, cereals and grains, oilseeds and pulses, and others. In 2022, the fruits and vegetables segment registered a largest share in the North America miticides market.
Based on country, the North America miticides market is segmented into the US, Canada, Mexico. In 2022, the US segment registered a largest share in the North America miticides market.
BASF SE; Bayer AG; Certis USA LLC; FMC Corp, Gowan Co; Kemin Industries Inc.; Nihon Nohyaku Co. Ltd.; Oro Agri International BV; Syngenta AG; and UPL Ltd are the leading companies operating in the North America miticides market.
Reasons to Buy:
- Save and reduce time carrying out entry-level research by identifying the growth, size, leading players, and segments in the North America miticides market.
- Highlights key business priorities in order to assist companies to realign their business strategies
- The key findings and recommendations highlight crucial progressive industry trends in the North America miticides market, thereby allowing players across the value chain to develop effective long-term strategies
- Develop/modify business expansion plans by using substantial growth offering developed and emerging markets
- Scrutinize in-depth North America market trends and outlook coupled with the factors driving the miticides market, as well as those hindering it
- Enhance the decision-making process by understanding the strategies that underpin commercial interest with respect to client products, segmentation, pricing, and distribution
Table Of Contents
1. Introduction
- 1.1 Study Scope
- 1.2 The Insight Partners Research Report Guidance
- 1.3 Market Segmentation
- 1.3.1 North America Miticides Market, by Source
- 1.3.2 North America Miticides Market, by Form
- 1.3.3 North America Miticides Market, by Crop Type
- 1.3.4 North America Miticides Market, by Country
2. Key Takeaways
3. Research Methodology
- 3.1 Scope of the Study
- 3.2 Research Methodology
- 3.2.1 Data Collection:
- 3.2.2 Primary Interviews:
- 3.2.3 Hypothesis formulation:
- 3.2.4 Macro-economic factor analysis:
- 3.2.5 Developing base number:
- 3.2.6 Data Triangulation:
- 3.2.7 Country level data:
4. North America Miticides Market Landscape
- 4.1 Market Overview
- 4.2 Porter's Five Forces Analysis
- 4.2.1 Threat of New Entrants:
- 4.2.2 Threat of Substitutes:
- 4.2.3 Bargaining Power of Buyers:
- 4.2.4 Bargaining Power of Suppliers:
- 4.2.5 Competitive Rivalry:
- 4.3 Ecosystem Analysis
- 4.3.1 Raw Material Suppliers:
- 4.3.2 Manufacturers:
- 4.3.3 Distributors or Suppliers:
- 4.3.4 End Use Industry:
- 4.4 Expert Opinions
5. North America Miticides Market - Key Market Dynamics
- 5.1 Market Drivers
- 5.1.1 Increasing Use of Miticides for Crop Protection and Yield Improvement
- 5.1.2 Growing Demand for Fruits and Vegetables
- 5.2 Market Restraints
- 5.2.1 Regulations Focused on Harmful Effects of Miticides
- 5.3 Opportunities
- 5.3.1 Ongoing Developments in Crop Protection Practices
- 5.4 Future Trends
- 5.4.1 Bio-Based Miticides
- 5.5 Impact Analysis
6. Miticides - North America Market Analysis
- 6.1 North America Miticides Market -Volume and Forecast to 2028 (Tons)
- 6.2 North America Miticides Market -Revenue and Forecast to 2028 (US$ Million)
7. North America Miticides Market Analysis - By Source
- 7.1 Overview
- 7.2 North America Miticides Market, By Source (2021 and 2028)
- 7.3 Bio-Based
- 7.3.1 Overview
- 7.3.2 Bio-Based: North America Miticides Market - Volume and Forecast to 2028 (Tons)
- 7.3.3 Bio-Based: North America Miticides Market - Revenue and Forecast to 2028 (US$ Million)
- 7.4 Synthetic
- 7.4.1 Overview
- 7.4.2 Synthetic: North America Miticides Market - Volume and Forecast to 2028 (Tons)
- 7.4.3 Synthetic: North America Miticides Market - Revenue and Forecast to 2028 (US$ Million)
8. North America Miticides Market Analysis - By Form
- 8.1 Overview
- 8.2 North America Miticides Market, By Form (2021 and 2028)
- 8.3 Dry
- 8.3.1 Overview
- 8.3.2 Dry: North America Miticides Market - Revenue and Forecast to 2028 (US$ Million)
- 8.4 Liquid
- 8.4.1 Overview
- 8.4.2 Liquid: North America Miticides Market - Revenue and Forecast to 2028 (US$ Million)
9. North America Miticides Market Analysis - By Crop Type
- 9.1 Overview
- 9.2 North America Miticides Market, By Crop Type (2021 and 2028)
- 9.3 Fruits and Vegetables
- 9.3.1 Overview
- 9.3.2 Fruits and Vegetables: North America Miticides Market - Revenue and Forecast to 2028 (US$ Million)
- 9.4 Cereals and Grains
- 9.4.1 Overview
- 9.4.2 Cereals and Grains: North America Miticides Market - Revenue and Forecast to 2028 (US$ Million)
- 9.5 Oilseeds and Pulses
- 9.5.1 Overview
- 9.5.2 Oilseeds and Pulses: North America Miticides Market - Revenue and Forecast to 2028 (US$ Million)
- 9.6 Others
- 9.6.1 Overview
- 9.6.2 Others: North America Miticides Market - Revenue and Forecast to 2028 (US$ Million)
10. North America Miticides Market - Country Analysis
- 10.1 Overview
- 10.1.1 North America: Miticides Market, by Key Country
- 10.1.1.1 US: Miticides Market -Volume and Forecast to 2028 (Tons)
- 10.1.1.2 US: Miticides Market -Revenue and Forecast to 2028 (US$ Million)
- 10.1.1.2.1 US: Miticides Market, by Source
- 10.1.1.2.2 US: Miticides Market, by Source
- 10.1.1.2.3 US: Miticides Market, by Form
- 10.1.1.2.4 US: Miticides Market, by Crop Type
- 10.1.1.3 Canada: Miticides Market-Volume and Forecast to 2028 (Tons)
- 10.1.1.4 Canada: Miticides Market-Revenue and Forecast to 2028 (US$ Million)
- 10.1.1.4.1 Canada: Miticides Market, by Source
- 10.1.1.4.2 Canada: Miticides Market, by Source
- 10.1.1.4.3 Canada: Miticides Market, by Form
- 10.1.1.4.4 Canada: Miticides Market, by Crop Type
- 10.1.1.5 Mexico: Miticides Market-Volume and Forecast to 2028 (Tons)
- 10.1.1.6 Mexico: Miticides Market-Revenue and Forecast to 2028 (US$ Million)
- 10.1.1.6.1 Mexico: Miticides Market, by Source
- 10.1.1.6.2 Mexico: Miticides Market, by Source
- 10.1.1.6.3 Mexico: Miticides Market, by Form
- 10.1.1.6.4 Mexico: Miticides Market, by Crop Type
- 10.1.1 North America: Miticides Market, by Key Country
11. Company Profiles
- 11.1 Nihon Nohyaku Co. Ltd.
- 11.1.1 Key Facts
- 11.1.2 Business Description
- 11.1.3 Products and Services
- 11.1.4 Financial Overview
- 11.1.5 SWOT Analysis
- 11.1.6 Key Developments
- 11.2 Kemin Industries Inc.
- 11.2.1 Key Facts
- 11.2.2 Business Description
- 11.2.3 Products and Services
- 11.2.4 Financial Overview
- 11.2.5 SWOT Analysis
- 11.2.6 Key Developments
- 11.3 BASF SE
- 11.3.1 Key Facts
- 11.3.2 Business Description
- 11.3.3 Products and Services
- 11.3.4 Financial Overview
- 11.3.5 SWOT Analysis
- 11.3.6 Key Developments
- 11.4 Bayer AG
- 11.4.1 Key Facts
- 11.4.2 Business Description
- 11.4.3 Products and Services
- 11.4.4 Financial Overview
- 11.4.5 SWOT Analysis
- 11.4.6 Key Developments
- 11.5 FMC Corp
- 11.5.1 Key Facts
- 11.5.2 Business Description
- 11.5.3 Products and Services
- 11.5.4 Financial Overview
- 11.5.5 SWOT Analysis
- 11.5.6 Key Developments
- 11.6 Gowan Co
- 11.6.1 Key Facts
- 11.6.2 Business Description
- 11.6.3 Products and Services
- 11.6.4 Financial Overview
- 11.6.5 SWOT Analysis
- 11.6.6 Key Developments
- 11.7 Syngenta AG
- 11.7.1 Key Facts
- 11.7.2 Business Description
- 11.7.3 Products and Services
- 11.7.4 Financial Overview
- 11.7.5 SWOT Analysis
- 11.7.6 Key Developments
- 11.8 UPL Ltd
- 11.8.1 Key Facts
- 11.8.2 Business Description
- 11.8.3 Products and Services
- 11.8.4 Financial Overview
- 11.8.5 SWOT Analysis
- 11.8.6 Key Developments
- 11.9 Oro Agri International BV
- 11.9.1 Key Facts
- 11.9.2 Business Description
- 11.9.3 Products and Services
- 11.9.4 Financial Overview
- 11.9.5 SWOT Analysis
- 11.9.6 Key Developments
- 11.10 Certis USA LLC
- 11.10.1 Key Facts
- 11.10.2 Business Description
- 11.10.3 Products and Services
- 11.10.4 Financial Overview
- 11.10.5 SWOT Analysis
- 11.10.6 Key Developments
12. Appendix
- 12.1 About The Insight Partners
- 12.2 Glossary of Terms