|
|
市場調査レポート
商品コード
1360102
アジア太平洋の殺ダニ剤市場の2028年までの予測-地域別分析:供給源、形態、作物タイプ別Asia Pacific Miticides Market Forecast to 2028 -Regional Analysis - by Source (Bio-Based and Synthetic), Form (Dry and Liquid), and Crop Type (Fruits and Vegetables, Cereals and Grains, Oilseeds and Pulses, and Others) |
||||||
|
|
|||||||


| アジア太平洋の殺ダニ剤市場の2028年までの予測-地域別分析:供給源、形態、作物タイプ別 |
|
出版日: 2023年08月17日
発行: The Insight Partners
ページ情報: 英文 136 Pages
納期: 即納可能
|
- 全表示
- 概要
- 図表
- 目次
アジア太平洋地域の殺ダニ剤市場は、2022年の5億4,310万米ドルから2028年には7億5,324万米ドルに成長すると予測されています。2022年から2028年までのCAGRは5.6%と推定されます。
バイオベースの殺ダニ剤がアジア太平洋殺ダニ剤市場を牽引
長年にわたり、殺虫剤は無差別に使用され、以前は無害であった種の天敵の多くを破壊し、多くの寄生虫に迅速に耐性を誘導してきました。長年にわたり、緑の革命は、政府が補助金を出して化学肥料や農薬を大量に使用することで成功しました。多くの国が農業生産を刺激し、食糧自給を達成するために生産支援プログラムを開始しました。政府の補助金は肥料の低価格化をもたらし、その結果、肥料の過剰使用を招き、国家財政に負担をかけるだけでなく、環境悪化の原因にもなっています。そのため、さまざまな国が環境悪化を抑制するために、合成殺ダニ剤に代わるバイオベースの殺ダニ剤を採用し始めました。マレーシアは、2019年に101トンの植物性および生物学的殺虫剤を農業慣行で使用したと報告しました。殺ダニ剤を含む植物由来または植物性の殺虫剤は、一般的に分解しやすく、化学的に製造された薬剤よりも環境への影響が低い可能性があります。作物を処理するためのこのような天然製品に対する需要の高まりにより、アジア太平洋の殺ダニ剤市場の企業はバイオベースの製品を導入するようになっています。このように、有機農産物の人気が高まり、バイオベースの農法を開発する政府の取り組みが活発化していることが、バイオベースの殺ダニ剤への需要を喚起しており、アジア太平洋の殺ダニ剤市場では今後数年間で重要な動向として浮上する可能性が高いです。
アジア太平洋の殺ダニ剤市場の概要
アジア太平洋地域の殺ダニ剤市場は、農家における作物保護化学物質に対する意識の高まり、政府の補助金、人口増加による食糧需要の増加によって顕著な存在感を示しています。予測期間中、優れた農産物に対する需要が急増し、有機農産物の高い生産性と収量に対するニーズが高まっていることから、アジア太平洋諸国、特に中国、日本、インドでは殺ダニ剤の使用が増加すると予想されます。農業部門が増加しているこれらのアジア諸国は、製品の消費率が高いと判断しています。アジア開発銀行によると、所得の増加と都市化が食糧消費に変化をもたらしています。農薬流通の規制と総合的有害生物管理(IPM)の推進に関して、多くの国際機関、多国間機関、二国間機関が導入した政策が、この地域の政府の努力を支えてきました。国連食糧農業機関(FAO)の「農薬の流通と使用に関する国際行動規範」の策定は、このプロセスを大いに助けた。さらに、果物・野菜産業の成長がアジア太平洋地域の殺ダニ剤需要を押し上げています。インド、中国、日本などのアジア太平洋諸国は、果物・野菜の生産量上位国のひとつです。農業・農民福祉省によると、2021年、インドは中国に次ぐ第2位の園芸生産国で、世界の果物・野菜生産の約12%を生産しています。このようにアジア太平洋地域では果物や野菜の生産が増加しており、今後数年間で殺ダニ剤の需要が高まると予想されます。
アジア太平洋地域の殺ダニ剤市場の収益と2028年までの予測(金額)
アジア太平洋地域の殺ダニ剤市場のセグメンテーション
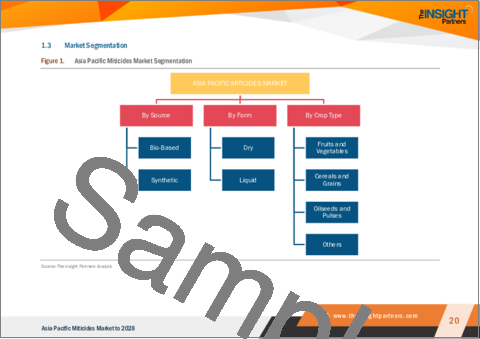
アジア太平洋の殺ダニ剤市場は、供給源、形態、作物タイプ、国に区分されます。
供給源に基づき、アジア太平洋の殺ダニ剤市場はバイオベースと合成に二分されます。2022年には、アジア太平洋の殺ダニ剤市場では合成セグメントがより大きなシェアを記録しました。
アジア太平洋の殺ダニ剤市場は形態に基づいて乾燥剤と液剤に区分されます。2022年には、アジア太平洋の殺ダニ剤市場では液体セグメントが大きなシェアを占めています。
作物の種類に基づき、アジア太平洋の殺ダニ剤市場は果物・野菜、穀物・穀類、油糧種子・豆類、その他に区分されます。2022年には、果物および野菜セグメントがアジア太平洋殺ダニ剤市場で最大のシェアを記録しました。
国別に見ると、アジア太平洋地域の殺ダニ剤市場はオーストラリア、中国、インド、日本、韓国、その他アジア太平洋地域に区分されます。2022年には、中国セグメントがアジア太平洋殺ダニ剤市場で最大のシェアを記録しました。
BASF SE;Bayer AG;Certis USA LLC;FMC Corp;Gowan Co;Kemin Industries Inc.Ltd.、Oro Agri International BV、Syngenta AG、およびUPL Ltd.がアジア太平洋殺ダニ剤市場の大手企業です。
目次
第1章 イントロダクション
第2章 キーポイント
第3章 調査手法
- 調査範囲
- 調査手法
- データ収集
- 一次インタビュー
- 仮説の策定
- マクロ経済要因分析
- 基礎数値の作成
- データの三角測量
- 国レベルのデータ
第4章 アジア太平洋地域の殺ダニ剤市場情勢
- 市場概要
- ポーターのファイブフォース分析
- 新規参入業者の脅威
- 代替品の脅威
- 買い手の交渉力:アジア太平洋地域の殺ダニ剤市場
- 供給企業の交渉力
- 競争企業間の敵対関係
- エコシステム分析
- 原材料サプライヤー
- 製造業者
- 流通業者または供給業者
- 最終用途産業
- 専門家の見解
第5章 アジア太平洋地域の殺ダニ剤市場:主要市場力学
- 市場促進要因
- 作物保護と収量向上のための殺ダニ剤使用の増加
- 果物および野菜の需要拡大
- 市場抑制要因
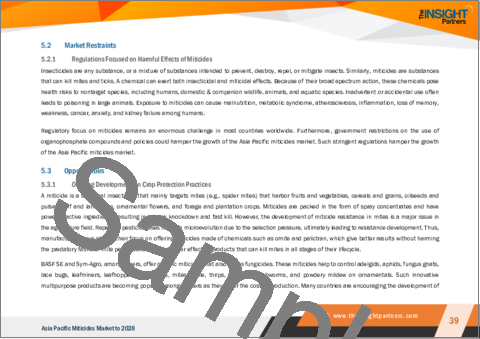
- 殺ダニ剤の有害作用に焦点を当てた規制
- 機会
- 作物保護慣行の継続的発展
- 今後の動向
- バイオベースの殺ダニ剤
- 影響分析
第6章 殺ダニ剤-アジア太平洋市場分析
- アジア太平洋の殺ダニ剤市場-2028年までの数量と予測
第7章 アジア太平洋殺ダニ剤市場分析-供給源別
- アジア太平洋の殺ダニ剤市場:供給源別(2021年および2028年)
- バイオベース
- 合成ベース
第8章 アジア太平洋地域の殺ダニ剤市場分析:形態別
- アジア太平洋の殺ダニ剤市場:形態別(2021年および2028年)
- 乾式
- 液体
第9章 アジア太平洋地域の殺ダニ剤市場分析-作物タイプ別
- アジア太平洋の殺ダニ剤市場:作物タイプ別(2021年および2028年)
- 果物および野菜
- 穀物および穀類
- 油糧種子および豆類
- その他
第10章 アジア太平洋地域の殺ダニ剤市場:国別分析
- アジア太平洋地域
- オーストラリア
- 中国
- インド
- 日本
- 韓国
- その他アジア太平洋地域
第11章 企業プロファイル
- Nihon Nohyaku Co. Ltd.
- Kemin Industries Inc.
- BASF SE
- Bayer AG
- FMC Corp
- Gowan Co
- Syngenta AG
- UPL Ltd
- Oro Agri International BV
- Certis USA LLC
第12章 付録
List Of Tables
- Table 1. Asia Pacific Miticides Market -Volume and Forecast to 2028 (Tons)
- Table 2. Asia Pacific Miticides Market -Revenue and Forecast to 2028 (US$ Million)
- Table 3. Australia Miticides Market, by Source- Volume and Forecast to 2028 (Tons)
- Table 4. Australia Miticides Market, by Source- Revenue and Forecast to 2028 (US$ Million)
- Table 5. Australia Miticides Market, by Form- Revenue and Forecast to 2028 (US$ Million)
- Table 6. Australia Miticides Market, by Crop Type - Revenue and Forecast to 2028 (US$ Million)
- Table 7. China Miticides Market, by Source - Volume and Forecast to 2028 (Tons)
- Table 8. China Miticides Market, by Source - Revenue and Forecast to 2028 (US$ Million)
- Table 9. China Miticides Market, by Form - Revenue and Forecast to 2028 (US$ Million)
- Table 10. China Miticides Market, by Crop Type - Revenue and Forecast to 2028 (US$ Million)
- Table 11. India Miticides Market, by Source - Volume and Forecast to 2028 (Tons)
- Table 12. India Miticides Market, by Source - Revenue and Forecast to 2028 (US$ Million)
- Table 13. India Miticides Market, by Form - Revenue and Forecast to 2028 (US$ Million)
- Table 14. India Miticides Market, by Crop Type - Revenue and Forecast to 2028 (US$ Million)
- Table 15. Japan Miticides Market, by Source - Volume and Forecast to 2028 (Tons)
- Table 16. Japan Miticides Market, by Source - Revenue and Forecast to 2028 (US$ Million)
- Table 17. Japan Miticides Market, by Form - Revenue and Forecast to 2028 (US$ Million)
- Table 18. Japan Miticides Market, by Crop Type - Revenue and Forecast to 2028 (US$ Million)
- Table 19. South Korea Miticides Market, by Source - Volume and Forecast to 2028 (Tons)
- Table 20. South Korea Miticides Market, by Source - Revenue and Forecast to 2028 (US$ Million)
- Table 21. South Korea Miticides Market, by Form - Revenue and Forecast to 2028 (US$ Million)
- Table 22. South Korea Miticides Market, by Crop Type - Revenue and Forecast to 2028 (US$ Million)
- Table 23. Rest of Asia Pacific Miticides Market, by Source - Volume and Forecast to 2028 (Tons)
- Table 24. Rest of Asia Pacific Miticides Market, by Source - Revenue and Forecast to 2028 (US$ Million)
- Table 25. Rest of Asia Pacific Miticides Market, by Form - Revenue and Forecast to 2028 (US$ Million)
- Table 26. Rest of Asia Pacific Miticides Market, by Crop Type - Revenue and Forecast to 2028 (US$ Million)
- Table 27. Glossary of Terms, Asia Pacific Miticides Market
List Of Figures
- Figure 1. Asia Pacific Miticides Market Segmentation
- Figure 2. Asia Pacific Miticides Market Segmentation: By Country
- Figure 3. Asia Pacific Miticides Market Overview
- Figure 4. Asia Pacific Miticides Market, By Source
- Figure 5. Asia Pacific Miticides Market, by Country
- Figure 6. Porter's Five Forces Analysis
- Figure 7. Ecosystem: Asia Pacific Miticides Market
- Figure 8. Expert Opinions
- Figure 9. Asia Pacific Miticides Market Impact Analysis of Drivers and Restraints
- Figure 10. Asia Pacific Miticides Market - Volume and Forecast to 2028 (Tons)
- Figure 11. Asia Pacific Miticides Market - Revenue and Forecast to 2028 (US$ Million)
- Figure 12. Asia Pacific Miticides Market Revenue Share, By Source (2021 and 2028)
- Figure 13. Bio-Based: Asia Pacific Miticides Market - Volume and Forecast To 2028 (Tons)
- Figure 14. Bio-Based: Asia Pacific Miticides Market - Revenue and Forecast To 2028 (US$ Million)
- Figure 15. Synthetic: Asia Pacific Miticides Market - Volume and Forecast To 2028 (Tons)
- Figure 16. Synthetic: Asia Pacific Miticides Market - Revenue and Forecast To 2028 (US$ Million)
- Figure 17. Asia Pacific Miticides Market Revenue Share, By Form (2021 and 2028)
- Figure 18. Dry: Asia Pacific Miticides Market - Revenue and Forecast To 2028 (US$ Million)
- Figure 19. Liquid: Asia Pacific Miticides Market - Revenue and Forecast To 2028 (US$ Million)
- Figure 20. Asia Pacific Miticides Market Revenue Share, By Crop Type (2021 and 2028)
- Figure 21. Fruits and Vegetables: Asia Pacific Miticides Market - Revenue and Forecast To 2028 (US$ Million)
- Figure 22. Cereals and Grains: Asia Pacific Miticides Market - Revenue and Forecast To 2028 (US$ Million)
- Figure 23. Oilseeds and Pulses: Asia Pacific Miticides Market - Revenue and Forecast To 2028 (US$ Million)
- Figure 24. Others: Asia Pacific Miticides Market - Revenue and Forecast To 2028 (US$ Million)
- Figure 25. Asia Pacific: Miticides Market Revenue, by Key Country (2021 and 2028)
- Figure 26. Asia Pacific: Miticides Market Revenue Share, by Key Country (2021 and 2028)
- Figure 27. Australia: Miticides Market - Volume and Forecast to 2028 (Tons)
- Figure 28. Australia: Miticides Market -Revenue and Forecast to 2028 (US$ Million)
- Figure 29. China: Miticides Market - Volume and Forecast to 2028 (Tons)
- Figure 30. China: Miticides Market -Revenue and Forecast to 2028 (US$ Million)
- Figure 31. India: Miticides Market - Volume and Forecast to 2028 (Tons)
- Figure 32. India: Miticides Market -Revenue and Forecast to 2028 (US$ Million)
- Figure 33. Japan: Miticides Market - Volume and Forecast to 2028 (Tons)
- Figure 34. Japan: Miticides Market -Revenue and Forecast to 2028 (US$ Million)
- Figure 35. South Korea: Miticides Market - Volume and Forecast to 2028 (Tons)
- Figure 36. South Korea: Miticides Market -Revenue and Forecast to 2028 (US$ Million)
- Figure 37. Rest of Asia Pacific: Miticides Market - Volume and Forecast to 2028 (Tons)
- Figure 38. Rest of Asia Pacific: Miticides Market -Revenue and Forecast to 2028 (US$ Million)
The Asia Pacific miticides market is expected to grow from US$ 543.10 million in 2022 to US$ 753.24 million by 2028. It is estimated to grow at a CAGR of 5.6% from 2022 to 2028.
Bio-Based Miticides Drive Asia Pacific Miticides Market
For years, pesticides have been in use in an indiscriminate manner, destroying many of the natural adversaries of formerly innocuous species, along with swiftly inducing resistance in many parasites. Over the years, the green revolution has succeeded in part through the heavy use of chemical fertilizers and pesticides subsidized by governments. Many countries launched production support programs to stimulate agricultural production and achieve food self-sufficiency. Government subsidies resulted in the lower prices of fertilizers, resulting in their overuse, which not only burdened national fiscal positions but also caused environmental degradation. Thus, various countries began adopting bio-based alternatives to synthetic miticides to control environmental degradation. Malaysia reported the use of 101 metric tons of botanical and biological insecticides in agricultural practices in 2019. Plant-derived or botanical pesticides, including miticides, are typically more easily degradable and may have a lower environmental impact than chemically manufactured medications. The growing demand for such natural products to treat crops has led companies in the Asia Pacific miticides market to introduce bio-based products. Thus, the increasing popularity of organic agricultural produce and growing government efforts to develop bio-based farming practices are triggering the demand for bio-based miticides, which is likely to emerge as a significant trend in the Asia Pacific miticides market in the coming years.
Asia Pacific Miticides Market Overview
The Asia Pacific miticides market is prominent due to growing awareness about crop protection chemicals among farmers, government subsidies, and rising food demand due to the increasing population. During the forecast period, surging demand for excellent agricultural products and organic produce's increasing need for high productivity and yield are expected to boost the use of miticides in Asia Pacific countries, especially China, Japan, and India. Increasing agriculture sector, these Asian countries determine a high product consumption rate. According to the Asian Development Bank, rising incomes and urbanization are transforming food consumption. Policies introduced by many international, multilateral, and bilateral organizations on regulating pesticide distribution and promoting integrated pest management (IPM) have supported the efforts of governments in the region. The development of the Food and Agriculture Organization's (FAO's) International Code of Conduct on the Distribution and Use of Pesticides has greatly helped with the process. Further, the growing fruits & vegetable industry has propelled the demand for miticides in Asia Pacific. Asia Pacific countries such as India, China, and Japan are among the top fruit and vegetable-producing countries. According to the Ministry of Agriculture & Farmers Welfare, in 2021, India was the second-largest horticulture producer behind China, producing about 12% of the global fruit and vegetable production. This increased production of fruits and vegetables in Asia Pacific is expected to boost the demand for miticides in the region in the coming years.
Asia Pacific Miticides Market Revenue and Forecast to 2028 (US$ Million)
Asia Pacific Miticides Market Segmentation
The Asia Pacific Miticides market is segmented into source, form, crop type, and country.
Based on source, the Asia Pacific miticides market is bifurcated into bio-based and synthetic. In 2022, the synthetic segment registered a larger share in the Asia Pacific miticides market.
Based on form, the Asia Pacific miticides market is segmented into dry and liquid. In 2022, the liquid segment registered a larger share in the Asia Pacific miticides market.
Based on crop type, the Asia Pacific miticides market is segmented into fruits and vegetables, cereals and grains, oilseeds and pulses, and others. In 2022, the fruits and vegetables segment registered a largest share in the Asia Pacific miticides market.
Based on country, the Asia Pacific miticides market is segmented into Australia, China, India, Japan, South Korea, and the Rest of Asia Pacific. In 2022, China segment registered a largest share in the Asia Pacific miticides market.
BASF SE; Bayer AG; Certis USA LLC; FMC Corp; Gowan Co; Kemin Industries Inc.; Nihon Nohyaku Co. Ltd.; Oro Agri International BV; Syngenta AG; and UPL Ltd are the leading companies operating in the Asia Pacific miticides market.
Reasons to Buy:
- Save and reduce time carrying out entry-level research by identifying the growth, size, leading players, and segments in the Asia Pacific miticides market.
- Highlights key business priorities in order to assist companies to realign their business strategies
- The key findings and recommendations highlight crucial progressive industry trends in the Asia Pacific miticides market, thereby allowing players across the value chain to develop effective long-term strategies
- Develop/modify business expansion plans by using substantial growth offering developed and emerging markets
- Scrutinize in-depth Asia Pacific market trends and outlook coupled with the factors driving the miticides market, as well as those hindering it
- Enhance the decision-making process by understanding the strategies that underpin commercial interest with respect to client products, segmentation, pricing, and distribution
Table Of Contents
1. Introduction
- 1.1 Study Scope
- 1.2 The Insight Partners Research Report Guidance
- 1.3 Market Segmentation
- 1.3.1 Asia Pacific Miticides Market, by Source
- 1.3.2 Asia Pacific Miticides Market, by Form
- 1.3.3 Asia Pacific Miticides Market, by Crop Type
- 1.3.4 Asia Pacific Miticides Market, by Country
2. Key Takeaways
3. Research Methodology
- 3.1 Scope of the Study
- 3.2 Research Methodology
- 3.2.1 Data Collection:
- 3.2.2 Primary Interviews:
- 3.2.3 Hypothesis formulation:
- 3.2.4 Macro-economic factor analysis:
- 3.2.5 Developing base number:
- 3.2.6 Data Triangulation:
- 3.2.7 Country level data:
4. Asia Pacific Miticides Market Landscape
- 4.1 Market Overview
- 4.2 Porter's Five Forces Analysis
- 4.2.1 Threat of New Entrants:
- 4.2.2 Threat of Substitutes:
- 4.2.3 Bargaining Power of Buyers:
- 4.2.4 Bargaining Power of Suppliers:
- 4.2.5 Competitive Rivalry:
- 4.3 Ecosystem Analysis
- 4.3.1 Raw Material Suppliers:
- 4.3.2 Manufacturers:
- 4.3.3 Distributors or Suppliers:
- 4.3.4 End Use Industry:
- 4.4 Expert Opinions
5. Asia Pacific Miticides Market - Key Market Dynamics
- 5.1 Market Drivers
- 5.1.1 Increasing Use of Miticides for Crop Protection and Yield Improvement
- 5.1.2 Growing Demand for Fruits and Vegetables
- 5.2 Market Restraints
- 5.2.1 Regulations Focused on Harmful Effects of Miticides
- 5.3 Opportunities
- 5.3.1 Ongoing Developments in Crop Protection Practices
- 5.4 Future Trends
- 5.4.1 Bio-Based Miticides
- 5.5 Impact Analysis
6. Miticides - Asia Pacific Market Analysis
- 6.1 Asia Pacific Miticides Market -Volume and Forecast to 2028 (Tons)
- 6.2 Asia Pacific Miticides Market -Revenue and Forecast to 2028 (US$ Million)
7. Asia Pacific Miticides Market Analysis - By Source
- 7.1 Overview
- 7.2 Asia Pacific Miticides Market, By Source (2021 and 2028)
- 7.3 Bio-Based
- 7.3.1 Overview
- 7.3.2 Bio-Based: Asia Pacific Miticides Market - Volume and Forecast to 2028 (Tons)
- 7.3.3 Bio-Based: Asia Pacific Miticides Market - Revenue and Forecast to 2028 (US$ Million)
- 7.4 Synthetic
- 7.4.1 Overview
- 7.4.2 Synthetic: Asia Pacific Miticides Market - Volume and Forecast to 2028 (Tons)
- 7.4.3 Synthetic: Asia Pacific Miticides Market - Revenue and Forecast to 2028 (US$ Million)
8. Asia Pacific Miticides Market Analysis - By Form
- 8.1 Overview
- 8.2 Asia Pacific Miticides Market, By Form (2021 and 2028)
- 8.3 Dry
- 8.3.1 Overview
- 8.3.2 Dry: Asia Pacific Miticides Market - Revenue and Forecast to 2028 (US$ Million)
- 8.4 Liquid
- 8.4.1 Overview
- 8.4.2 Liquid: Asia Pacific Miticides Market - Revenue and Forecast to 2028 (US$ Million)
9. Asia Pacific Miticides Market Analysis - By Crop Type
- 9.1 Overview
- 9.2 Asia Pacific Miticides Market, By Crop Type (2021 and 2028)
- 9.3 Fruits and Vegetables
- 9.3.1 Overview
- 9.3.2 Fruits and Vegetables: Asia Pacific Miticides Market - Revenue and Forecast to 2028 (US$ Million)
- 9.4 Cereals and Grains
- 9.4.1 Overview
- 9.4.2 Cereals and Grains: Asia Pacific Miticides Market - Revenue and Forecast to 2028 (US$ Million)
- 9.5 Oilseeds and Pulses
- 9.5.1 Overview
- 9.5.2 Oilseeds and Pulses: Asia Pacific Miticides Market - Revenue and Forecast to 2028 (US$ Million)
- 9.6 Others
- 9.6.1 Overview
- 9.6.2 Others: Asia Pacific Miticides Market - Revenue and Forecast to 2028 (US$ Million)
10. Asia Pacific Miticides Market - Country Analysis
- 10.1 Overview
- 10.1.1 Asia Pacific: Miticides Market, by Key Country
- 10.1.1.1 Australia: Miticides Market - Volume and Forecast to 2028 (Tons)
- 10.1.1.2 Australia: Miticides Market -Revenue and Forecast to 2028 (US$ Million)
- 10.1.1.2.1 Australia: Miticides Market, by Source
- 10.1.1.2.2 Australia: Miticides Market, by Source
- 10.1.1.2.3 Australia: Miticides Market, by Form
- 10.1.1.2.4 Australia: Miticides Market, by Crop Type
- 10.1.1.3 China: Miticides Market - Volume and Forecast to 2028 (Tons)
- 10.1.1.4 China: Miticides Market -Revenue and Forecast to 2028 (US$ Million)
- 10.1.1.4.1 China: Miticides Market, by Source
- 10.1.1.4.2 China: Miticides Market, by Source
- 10.1.1.4.3 China: Miticides Market, by Form
- 10.1.1.4.4 China: Miticides Market, by Crop Type
- 10.1.1.5 India: Miticides Market - Volume and Forecast to 2028 (Tons)
- 10.1.1.6 India: Miticides Market -Revenue and Forecast to 2028 (US$ Million)
- 10.1.1.6.1 India: Miticides Market, by Source
- 10.1.1.6.2 India: Miticides Market, by Source
- 10.1.1.6.3 India: Miticides Market, by Form
- 10.1.1.6.4 India: Miticides Market, by Crop Type
- 10.1.1.7 Japan: Miticides Market - Volume and Forecast to 2028 (Tons)
- 10.1.1.8 Japan: Miticides Market -Revenue and Forecast to 2028 (US$ Million)
- 10.1.1.8.1 Japan: Miticides Market, by Source
- 10.1.1.8.2 Japan: Miticides Market, by Source
- 10.1.1.8.3 Japan: Miticides Market, by Form
- 10.1.1.8.4 Japan: Miticides Market, by Crop Type
- 10.1.1.9 South Korea: Miticides Market - Volume and Forecast to 2028 (Tons)
- 10.1.1.10 South Korea: Miticides Market -Revenue and Forecast to 2028 (US$ Million)
- 10.1.1.10.1 South Korea: Miticides Market, by Source
- 10.1.1.10.2 South Korea: Miticides Market, by Source
- 10.1.1.10.3 South Korea: Miticides Market, by Form
- 10.1.1.10.4 South Korea: Miticides Market, by Crop Type
- 10.1.1.11 Rest of Asia Pacific: Miticides Market - Volume and Forecast to 2028 (Tons)
- 10.1.1.12 Rest of Asia Pacific: Miticides Market -Revenue and Forecast to 2028 (US$ Million)
- 10.1.1.12.1 Rest of Asia Pacific: Miticides Market, by Source
- 10.1.1.12.2 Rest of Asia Pacific: Miticides Market, by Source
- 10.1.1.12.3 Rest of Asia Pacific: Miticides Market, by Form
- 10.1.1.12.4 Rest of Asia Pacific: Miticides Market, by Crop Type
- 10.1.1 Asia Pacific: Miticides Market, by Key Country
11. Company Profiles
- 11.1 Nihon Nohyaku Co. Ltd.
- 11.1.1 Key Facts
- 11.1.2 Business Description
- 11.1.3 Products and Services
- 11.1.4 Financial Overview
- 11.1.5 SWOT Analysis
- 11.1.6 Key Developments
- 11.2 Kemin Industries Inc.
- 11.2.1 Key Facts
- 11.2.2 Business Description
- 11.2.3 Products and Services
- 11.2.4 Financial Overview
- 11.2.5 SWOT Analysis
- 11.2.6 Key Developments
- 11.3 BASF SE
- 11.3.1 Key Facts
- 11.3.2 Business Description
- 11.3.3 Products and Services
- 11.3.4 Financial Overview
- 11.3.5 SWOT Analysis
- 11.3.6 Key Developments
- 11.4 Bayer AG
- 11.4.1 Key Facts
- 11.4.2 Business Description
- 11.4.3 Products and Services
- 11.4.4 Financial Overview
- 11.4.5 SWOT Analysis
- 11.4.6 Key Developments
- 11.5 FMC Corp
- 11.5.1 Key Facts
- 11.5.2 Business Description
- 11.5.3 Products and Services
- 11.5.4 Financial Overview
- 11.5.5 SWOT Analysis
- 11.5.6 Key Developments
- 11.6 Gowan Co
- 11.6.1 Key Facts
- 11.6.2 Business Description
- 11.6.3 Products and Services
- 11.6.4 Financial Overview
- 11.6.5 SWOT Analysis
- 11.6.6 Key Developments
- 11.7 Syngenta AG
- 11.7.1 Key Facts
- 11.7.2 Business Description
- 11.7.3 Products and Services
- 11.7.4 Financial Overview
- 11.7.5 SWOT Analysis
- 11.7.6 Key Developments
- 11.8 UPL Ltd
- 11.8.1 Key Facts
- 11.8.2 Business Description
- 11.8.3 Products and Services
- 11.8.4 Financial Overview
- 11.8.5 SWOT Analysis
- 11.8.6 Key Developments
- 11.9 Oro Agri International BV
- 11.9.1 Key Facts
- 11.9.2 Business Description
- 11.9.3 Products and Services
- 11.9.4 Financial Overview
- 11.9.5 SWOT Analysis
- 11.9.6 Key Developments
- 11.10 Certis USA LLC
- 11.10.1 Key Facts
- 11.10.2 Business Description
- 11.10.3 Products and Services
- 11.10.4 Financial Overview
- 11.10.5 SWOT Analysis
- 11.10.6 Key Developments
12. Appendix
- 12.1 About The Insight Partners
- 12.2 Glossary of Terms