|
|
市場調査レポート
商品コード
1347201
米国のソーラーインバーター市場の2030年までの予測- 製品タイプ、位相、接続性、用途、容量別に分析US Solar Inverter Market Forecast to 2030 - analysis by Product Type, Phase, Connectivity, Application, and Capacity |
||||||
|
|
|||||||


| 米国のソーラーインバーター市場の2030年までの予測- 製品タイプ、位相、接続性、用途、容量別に分析 |
|
出版日: 2023年08月11日
発行: The Insight Partners
ページ情報: 英文 97 Pages
納期: 即納可能
|
- 全表示
- 概要
- 図表
- 目次
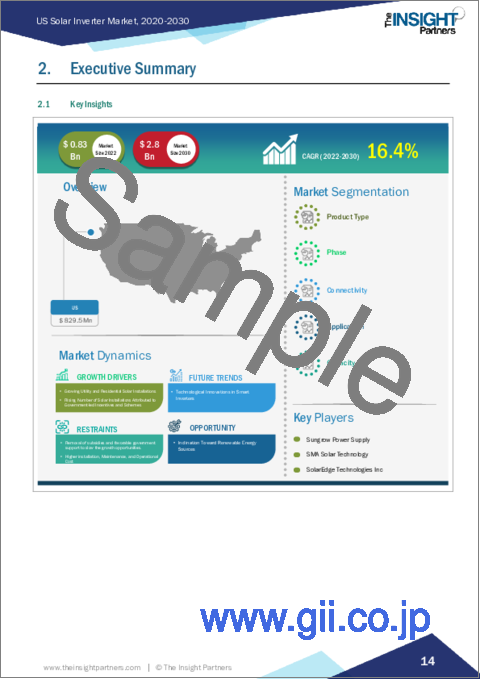
米国の太陽光発電インバーター市場は、2022年に8億2,586万米ドルに達し、2030年には27億7,399万米ドルに達すると予測され、2022年から2030年までのCAGRは12.8%と予測されます。
政府主導のインセンティブやスキームによる太陽光発電の設置、住宅用太陽光発電の屋上設置の増加が、太陽光発電インバータ市場の成長にプラスの影響を与えています。さらに、化石燃料の消費を削減し二酸化炭素排出量を削減するために再生可能エネルギー分野への投資が増加していることや、米国の太陽光発電インバーター市場における技術革新も市場成長を促進する要因の一つです。しかし、ソーラー・インバーターの高い直流電圧に伴う安全上のリスクが市場成長を抑制しています。
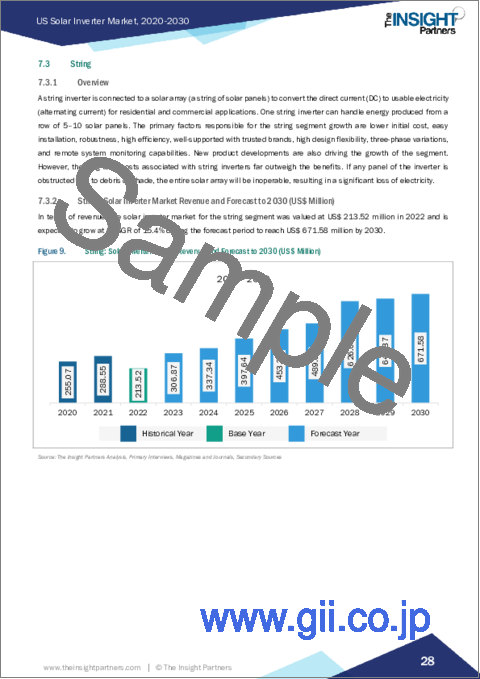
ストリング・インバータはソーラー・アレイ(ソーラー・パネルの列)に接続され、直流(DC)を住宅用および商業用アプリケーションで使用可能な電気(交流)に変換します。1台のストリング・インバーターで、5~10枚のソーラー・パネルの列から生産されるエネルギーを扱うことができます。
米国ソーラー・インバーター市場のニーズは、COVID-19以前の時代には都市人口の増加によりインフラ整備が進んでいた。COVID-19の流行により、太陽エネルギーの見通しは劇的に変化しました。2020年6月、太陽光発電産業の従業員数は、当初予測されていた30万2,000人ではなく、18万8,000人となり、38%の激減が見られました。米国は2020年第2四半期に3ギガワット(GW)の太陽光発電設備の設置を計画していたが、これはCOVID以前の予測から37%減少しました。2020年第2四半期、米国の太陽光発電導入プロジェクトは、28万8,000世帯分の電力、i.e.経済投資32億米ドルに相当する落ち込みを見せた。2020年には、製品需要の激減、価格下落、貯蔵不足により、製造業が深刻な影響を受けた。事実上存在しない製造需要と生産能力の低下により製造業の収益が急速に減少したため、北米のさまざまな産業で既存のソーラー・インバータの設置やアップグレードへの支出が制限されました。既存の製造工場における定期的なメンテナンスと操業停止も、米国のソーラー・インバータ市場の需要を阻害しました。このように、COVID-19の流行は米国のソーラーインバーター市場の成長に悪影響を与えました。
2021年、非公開会社は住宅への分散型(屋上を含む)太陽光発電設置に投資しました。この種の投資はソーラーインバーターの需要を生み出しました。製造業は労働力不足やサプライチェーンの課題から回復し始め、これが米国ソーラーインバーター市場の採用の引き金となっています。2022年には、再生可能エネルギー分野の継続的な進展により、米国でソーラー・インバーターの需要が高まる。
GoodWe Technologies Co Ltd、Delta Electronics Inc、CyboEnergy Inc、Yaskawa America Inc、Danfoss AS、SMA Solar Technology AG、SolarEdge Technologies Inc、Power Electronics SL、Ginlong Technologies Co Ltd、Chicago Digital Power Inc、Sungrow Power Supply Co Ltd、Caterpillar Inc.は、米国のソーラーインバータ市場の主要企業です。
米国における再生可能エネルギーの消費量は増加傾向にあり、風力と太陽エネルギーは国内発電量の14%を占めています。2022年3月には、再生可能エネルギーによる発電量が石炭を上回っています。水力発電の貢献度は6%で、バイオマスと地熱の貢献度は1%未満です。カリフォルニア州は国内の電力会社規模の太陽光発電の26%を生産し、テキサス州の16%、ノースカロライナ州の8%がそれに続いた。テキサス州は風力発電でも米国をリードし、26%を占めました。次いでアイオワ州が10%、オクラホマ州が9%だっています。このように、増大するエネルギー消費要件に対応するため、再生不可能なエネルギー源から再生可能なエネルギー源への移行が急増しており、予測期間中、米国のソーラー・インバーター市場のプレーヤーにとって有利な機会が創出され続けると予想されます。
目次
第1章 イントロダクション
第2章 エグゼクティブサマリー
- 主要な洞察
第3章 調査手法
- 調査範囲
- 2次調査
- 1次調査
第4章 ソーラーインバータの市場情勢
- PEST分析
- エコシステム分析
第5章 ソーラーインバータ市場- 主要産業力学
- 主な市場促進要因
- 増加する太陽光発電設備と住宅用太陽光発電設備
- 原材料コストと太陽光発電システムの急落
- 政府主導のインセンティブとスキームによるソーラー設置数の増加
- 主な市場抑制要因
- 成長機会を鈍らせる補助金や政府支援の廃止
- 設置、メンテナンス、運用コストの上昇
- 主な市場機会
- 再生可能エネルギーへの傾斜
- 今後の動向
- スマートインバータの技術革新
- 促進要因と阻害要因の影響
第6章 ソーラーインバータ市場:地域別市場分析
- ソーラーインバータ市場、2020年および2030年
- ソーラーインバータの市場収益、2020年~2030年
第7章 ソーラーインバータ市場分析:製品タイプ
- ソーラーインバータ市場の収益シェア:最終用途産業別(2022年、2030年)
- 文字列
- マイクロ
- マイクロ
- セントラル
第8章 ソーラーインバータ市場分析-フェーズ
- ソーラーインバータ市場のフェーズ別収益シェア(2022年、2030年)
- 単相
- 三相
第9章 ソーラーインバータ市場分析:接続性
- ソーラーインバータ市場の接続性別収益シェア(2022年、2030年)
- スタンドアロン
- オングリッド
第10章 ソーラーインバータ市場分析:容量
- ソーラーインバータ市場の容量別収益シェア(2022年、2030年)
- 5kW未満
- 5~15 kW
- -25kW未満
- -50 kW
- 50 kW以上
第11章 ソーラーインバータの市場分析-用途
- ソーラーインバータ市場の用途別収益シェア(2022年、2030年)
- 住宅および地域社会
- 商業用および産業用
- 公益事業
第12章 COVID-19前後の影響
第13章 競合情勢
- 企業のポジショニングと集中度
- 競合ベンチマーキング
第14章 業界情勢
- 市場への取り組み
- 製品開発
- 合併と買収
第15章 企業プロファイル
- GoodWe Technologies Co Ltd
- Delta Electronics Inc
- Yaskawa America Inc
- SMA Solar Technology AG
- Danfoss AS
- CyboEnergy Inc
- Chicago Digital Power Inc
- Caterpillar Inc
- Sungrow Power Supply Co Ltd
- Ginlong Technologies Co Ltd
- Power Electronics SL
- Solaredge Technologies Inc
第16章 付録
List Of Tables
- Table 1. Solar Inverter Market Segmentation
- Table 2. Solar Inverter Market Revenue And Forecasts To 2030 (US$ Mn)
- Table 3. US Solar Inverter Market, By Product Type - Revenue and Forecast to 2030 (US$ Million)
- Table 4. US Solar Inverter Market, By Phase - Revenue and Forecast to 2030 (US$ Million)
- Table 5. US Solar Inverter Market, By Connectivity - Revenue and Forecast to 2030 (US$ Million)
- Table 6. US Solar Inverter Market, By Capacity - Revenue and Forecast to 2030 (US$ Million)
- Table 7. US Solar Inverter Market, By Application - Revenue and Forecast to 2030 (US$ Million)
- Table 8. Competitive Benchmarking
List Of Figures
- Figure 1. Solar Inverter Market Segmentation, By Geography
- Figure 2. Solar Inverter Market - PEST Analysis
- Figure 3. Solar Inverter Market - Ecosystem Analysis
- Figure 4. Solar Inverter Market - Key Industry Dynamics
- Figure 5. Impact Analysis of Drivers And Restraints
- Figure 6. Solar Inverter Market, (US$ Billion), 2020 and 2030
- Figure 7. Solar Inverter Market Revenue (US$ Mn), 2020 - 2030
- Figure 8. Solar Inverter Market Revenue Share, By Function (2022 and 2030)
- Figure 9. String: Solar Inverter Market Revenue and Forecast to 2030 (US$ Million)
- Figure 10. Micro: Solar Inverter Market Revenue and Forecast to 2030 (US$ Million)
- Figure 11. Central: Solar Inverter Market Revenue and Forecast to 2030 (US$ Million)
- Figure 12. Solar Inverter Market Revenue Share, By Phase (2022 and 2030)
- Figure 13. Single Phase: Solar Inverter Market Revenue and Forecast to 2030 (US$ Million)
- Figure 14. Three Phase: Solar Inverter Market Revenue and Forecast to 2030 (US$ Million)
- Figure 15. Solar Inverter Market Revenue Share, By Connectivity (2022 and 2030)
- Figure 16. Standalone: Solar Inverter Market Revenue and Forecast to 2030 (US$ Million)
- Figure 17. On-Grid: Solar Inverter Market Revenue and Forecast to 2030 (US$ Million)
- Figure 18. Solar Inverter Market Revenue Share, By Capacity (2022 and 2030)
- Figure 19. Below 5 kW: Solar Inverter Market Revenue and Forecast to 2030 (US$ Million)
- Figure 20. 5-15 kW: Solar Inverter Market Revenue and Forecast to 2030 (US$ Million)
- Figure 21. -25 kW: Solar Inverter Market Revenue and Forecast to 2030 (US$ Million)
- Figure 22. -50 kW: Solar Inverter Market Revenue and Forecast to 2030 (US$ Million)
- Figure 23. Above 50 kW: Solar Inverter Market Revenue and Forecast to 2030 (US$ Million)
- Figure 24. Solar Inverter Market Revenue Share, By Application (2022 and 2030)
- Figure 25. Residential and Community: Solar Inverter Market Revenue and Forecast to 2030 (US$ Million)
- Figure 26. Commercial and Industrial: Solar Inverter Market Revenue and Forecast to 2030 (US$ Million)
- Figure 27. Utility: Solar Inverter Market Revenue and Forecast to 2030 (US$ Million)
- Figure 28. Company Positioning & Concentration
The US solar inverter market is projected to reach US$ 825.86 million in 2022 and is expected to reach US$ 2,773.99 million by 2030; it is estimated to record a CAGR of 12.8% from 2022 to 2030
Solar installations attributed to government-led incentives and schemes, along with growing residential solar rooftop installations, positively influence the solar PV inverters market growth. Further, the increasing investments in the renewable energy sector to reduce fossil fuel consumption to lower carbon emission, coupled with technological innovations in US solar inverter market, are among the factors driving the market growth. However, the safety risks associated with high DC voltages in solar inverters are restraining the market growth.
A string inverter is connected to a solar array (a string of solar panels) to convert the direct current (DC) to usable electricity (alternating current) for residential and commercial applications. One string inverter can handle energy produced from a row of 5-10 solar panels.
The need for US solar inverter market was prevalent during the pre-COVID-19 era because of the growing urban population that led to increasing infrastructural developments. Due to the COVID-19 pandemic, the outlook for solar energy changed dramatically. In June 2020, the solar industry employed 188,000 workers rather than the 302,000 originally forecasted-a sharp decline of 38% was observed. The US planned to install 3 gigawatts (GW) of solar capacity in Q2 2020-a 37% decline from pre-COVID forecasts. In Q2 of 2020, the US solar deployment project witnessed a drop-off equivalent to power 288,000 homes, i.e., US$ 3.2 billion in economic investment. In 2020, manufacturing industries were severely affected due to a drastic decrease in product demand, falling prices, and storage shortages. A swift decline in manufacturing revenues due to virtually nonexistent manufacturing demand and slow production capabilities limited the expenditure on installing or upgrading existing solar inverters across various industries in North America. Periodic maintenance and discontinuation of operation in existing manufacturing plants also hampered the demand for US solar inverter market. Thus, the COVID-19 pandemic adversely affected the US solar inverter market growth.
In 2021, private companies invested in distributed (including rooftop) solar PV installation on residential buildings. This type of investment created a demand for solar Inverters. The manufacturing industry started recovering from labor shortages and supply chain challenges, which triggered the adoption of US solar inverter market. In 2022, solar inverters witnessed a higher demand in the US due to the continued progress in the renewable energy sector.
GoodWe Technologies Co Ltd, Delta Electronics Inc, CyboEnergy Inc, Yaskawa America Inc, Danfoss AS, SMA Solar Technology AG, SolarEdge Technologies Inc, Power Electronics SL, Ginlong Technologies Co Ltd, Chicago Digital Power Inc, Sungrow Power Supply Co Ltd, Caterpillar Inc. are a few key US solar inverter market players.
The consumption of renewable energy sources in the US is on the rise, with wind and solar energy contributing 14% of domestic electricity production. In March 2022, electricity generated from renewables surpassed coal. Hydropower contributed 6%, and biomass and geothermal sources generated less than 1%. California produced 26% of the national utility-scale solar electricity, followed by Texas with 16% and North Carolina with 8%. Texas also led the way in wind generation, accounting for 26% of the US. Iowa and Oklahoma were the next closest states, with 10% and 9% of the total, respectively. Thus, the surge in the transition from nonrenewable sources to renewable sources to meet growing energy consumption requirements is expected to continue to create lucrative opportunities for the US solar inverter market players during the forecast period.
Reasons to Buy:
- Save and reduce time carrying out entry-level research by identifying the growth, size, leading players and segments in the US solar inverter market
- Highlights key business priorities in order to assist companies to realign their business strategies
- The key findings and recommendations such as specific country and segmental insight highlights crucial progressive industry trends in the US solar inverter market, thereby allowing players across the value chain to develop effective long-term strategies
- Develop/modify business expansion plans by using substantial growth offering developed and emerging markets
- Scrutinize in-depth market trends and outlook coupled with the factors driving the market, as well as those hindering it
- Enhance the decision-making process by understanding the strategies that underpin commercial interest with respect to client products, segmentation, pricing and distribution
Table Of Contents
1. Introduction
- 1.1 The Insight Partners Research Report Guidance
- 1.2 Market Segmentation
2. Executive Summary
- 2.1 Key Insights
3. Research Methodology
- 3.1 Coverage
- 3.2 Secondary Research
- 3.3 Primary Research
4. Solar Inverter Market Landscape
- 4.1 Overview
- 4.2 PEST Analysis
- 4.3 Ecosystem Analysis
5. Solar Inverter Market - Key Industry Dynamics
- 5.1 Key Market Drivers:
- 5.1.1 Growing Utility and Residential Solar Installations
- 5.1.2 Steep Decline in Raw Material Costs and PV Systems
- 5.1.3 Rising Number of Solar Installations Attributed to Government-led Incentives and Schemes
- 5.2 Key Market Restraints:
- 5.2.1 Removal of subsidies and favorable government support to slow the growth opportunities.
- 5.2.2 Higher installation, Maintenance, and Operational Cost
- 5.3 Key Market Opportunities:
- 5.3.1 Inclination Toward Renewable Energy Sources
- 5.4 Future Trend:
- 5.4.1 Technological Innovations in Smart Inverters
- 5.5 Impact of Drivers And Restraints:
6. Solar Inverter Market - Regional Market Analysis
- 6.1 Solar Inverter Market, (US$ Billion), 2020 and 2030
- 6.2 Solar Inverter Market Revenue (US$ Mn), 2020 - 2030
7. Solar Inverter Market Analysis - Product Type
- 7.1 Overview
- 7.2 Solar Inverter Market Revenue Share, By End-Use Industry (2022 and 2030)
- 7.3 String
- 7.3.1 Overview
- 7.3.2 String: Solar Inverter Market Revenue and Forecast to 2030 (US$ Million)
- 7.4 Micro
- 7.4.1 Overview
- 7.4.2 Micro: Solar Inverter Market Revenue and Forecast to 2030 (US$ Million)
- 7.5 Central
- 7.5.1 Overview
- 7.5.2 Central: Solar Inverter Market Revenue and Forecast to 2030 (US$ Million)
8. Solar Inverter Market Analysis - Phase
- 8.1 Overview
- 8.2 Solar Inverter Market Revenue Share, By Phase (2022 and 2030)
- 8.3 Single Phase
- 8.3.1 Overview
- 8.3.2 Single Phase: Solar Inverter Market Revenue and Forecast to 2030 (US$ Million)
- 8.4 Three Phase
- 8.4.1 Overview
- 8.4.2 Three Phase: Solar Inverter Market Revenue and Forecast to 2030 (US$ Million)
9. Solar Inverter Market Analysis - Connectivity
- 9.1 Overview
- 9.2 Solar Inverter Market Revenue Share, By Connectivity (2022 and 2030)
- 9.3 Standalone
- 9.3.1 Overview
- 9.3.2 Standalone: Solar Inverter Market Revenue and Forecast to 2030 (US$ Million)
- 9.4 On-Grid
- 9.4.1 Overview
- 9.4.2 On-Grid: Solar Inverter Market Revenue and Forecast to 2030 (US$ Million)
10. Solar Inverter Market Analysis - Capacity
- 10.1 Overview
- 10.2 Solar Inverter Market Revenue Share, By Capacity (2022 and 2030)
- 10.3 Below 5 kW
- 10.3.1 Overview
- 10.3.2 Below 5 kW: Solar Inverter Market Revenue and Forecast to 2030 (US$ Million)
- 10.4 5-15 kW
- 10.4.1 Overview
- 10.4.2 5-15 kW: Solar Inverter Market Revenue and Forecast to 2030 (US$ Million)
- 10.5-25 kW
- 10.5.1 Overview
- 10.5.2-25 kW: Solar Inverter Market Revenue and Forecast to 2030 (US$ Million)
- 10.6-50 kW
- 10.6.1 Overview
- 10.6.2-50 kW: Solar Inverter Market Revenue and Forecast to 2030 (US$ Million)
- 10.7 Above 50 kW
- 10.7.1 Overview
- 10.7.2 Above 50 kW: Solar Inverter Market Revenue and Forecast to 2030 (US$ Million)
11. Solar Inverter Market Analysis - Application
- 11.1 Overview
- 11.2 Solar Inverter Market Revenue Share, By Application (2022 and 2030)
- 11.3 Residential and Community
- 11.3.1 Overview
- 11.3.2 Residential and Community: Solar Inverter Market Revenue and Forecast to 2030 (US$ Million)
- 11.4 Commercial and Industrial
- 11.4.1 Overview
- 11.4.2 Commercial and Industrial: Solar Inverter Market Revenue and Forecast to 2030 (US$ Million)
- 11.5 Utility
- 11.5.1 Overview
- 11.5.2 Utility: Solar Inverter Market Revenue and Forecast to 2030 (US$ Million)
12. Pre & Post Covid-19 Impact
- 12.1 Overview
13. Competitive Landscape
- 13.1 Company Positioning & Concentration
- 13.2 Competitive Benchmarking
14. Industry Landscape
- 14.1 Overview
- 14.2 Market Initiative
- 14.3 Product Development
- 14.4 Mergers & Acquisitions
15. Company Profiles
- 15.1 GoodWe Technologies Co Ltd
- 15.1.1 Key Facts
- 15.1.2 Business Description
- 15.1.3 Products and Services
- 15.1.4 Financial Overview
- 15.1.5 SWOT Analysis
- 15.1.6 Key Developments
- 15.2 Delta Electronics Inc
- 15.2.1 Key Facts
- 15.2.2 Business Description
- 15.2.3 Products and Services
- 15.2.4 Financial Overview
- 15.2.5 SWOT Analysis
- 15.2.6 Key Developments
- 15.3 Yaskawa America Inc
- 15.3.1 Key Facts
- 15.3.2 Business Description
- 15.3.3 Products and Services
- 15.3.4 Financial Overview
- 15.3.5 SWOT Analysis
- 15.3.6 Key Developments
- 15.4 SMA Solar Technology AG
- 15.4.1 Key Facts
- 15.4.2 Business Description
- 15.4.3 Products and Services
- 15.4.4 Financial Overview
- 15.4.5 SWOT Analysis
- 15.4.6 Key Developments
- 15.5 Danfoss AS
- 15.5.1 Key Facts
- 15.5.2 Business Description
- 15.5.3 Products and Services
- 15.5.4 Financial Overview
- 15.5.5 SWOT Analysis
- 15.5.6 Key Developments
- 15.6 CyboEnergy Inc
- 15.6.1 Key Facts
- 15.6.2 Business Description
- 15.6.3 Products and Services
- 15.6.4 Financial Overview
- 15.6.5 SWOT Analysis
- 15.6.6 Key Developments
- 15.7 Chicago Digital Power Inc
- 15.7.1 Key Facts
- 15.7.2 Business Description
- 15.7.3 Products and Services
- 15.7.4 Financial Overview
- 15.7.5 SWOT Analysis
- 15.7.6 Key Developments
- 15.8 Caterpillar Inc
- 15.8.1 Key Facts
- 15.8.2 Business Description
- 15.8.3 Products and Services
- 15.8.4 Financial Overview
- 15.8.5 SWOT Analysis
- 15.8.6 Key Developments
- 15.9 Sungrow Power Supply Co Ltd
- 15.9.1 Key Facts
- 15.9.2 Business Description
- 15.9.3 Products and Services
- 15.9.4 Financial Overview
- 15.9.5 SWOT Analysis
- 15.9.6 Key Developments
- 15.10 Ginlong Technologies Co Ltd
- 15.10.1 Key Facts
- 15.10.2 Business Description
- 15.10.3 Products and Services
- 15.10.4 Financial Overview
- 15.10.5 SWOT Analysis
- 15.10.6 Key Developments
- 15.11 Power Electronics SL
- 15.11.1 Key Facts
- 15.11.2 Business Description
- 15.11.3 Products and Services
- 15.11.4 Financial Overview
- 15.11.5 SWOT Analysis
- 15.11.6 Key Developments
- 15.12 Solaredge Technologies Inc
- 15.12.1 Key Facts
- 15.12.2 Business Description
- 15.12.3 Products and Services
- 15.12.4 Financial Overview
- 15.12.5 SWOT Analysis
- 15.12.6 Key Developments
16. Appendix
- 16.1 Appendix