|
|
市場調査レポート
商品コード
1280768
米国のリンパ浮腫治療市場の2028年までの予測- 病態タイプ、治療タイプ、エンドユーザー別の国分析US Lymphedema Treatment Market Forecast to 2028 - Country Analysis By Condition Type, Treatment Type, and End User |
||||||
|
|
|||||||
|
|||||||


| 米国のリンパ浮腫治療市場の2028年までの予測- 病態タイプ、治療タイプ、エンドユーザー別の国分析 |
|
出版日: 2023年05月12日
発行: The Insight Partners
ページ情報: 英文 132 Pages
納期: 即納可能
|

- 全表示
- 概要
- 図表
- 目次
米国のリンパ浮腫治療市場規模は、2022年の51億8,598万米ドルから2028年には83億2,007万米ドルに成長すると予測されており、2023年から2028年にかけて8.2%のCAGRを記録すると推定されています。
米国のリンパ浮腫治療市場の成長は、リンパ浮腫症例の発生率の上昇とヘルスケアサービスおよびリンパ浮腫管理プログラムの増加に起因しています。しかし、認知度や熟練した専門医の不足が市場の成長を妨げています。
リンパ浮腫は、皮膚のすぐ下にある脂肪組織にリンパ液が蓄積される病気です。この症状は、人のリンパ系の流れが悪くなることで起こり、脚や腕、あるいはその両方に見られます。また、治療を受けた部位によっては、腹部、頸部、性器、顔面にも症状が現れることがあります。一次性リンパ浮腫は一般的に出生時に存在し、二次性リンパ浮腫はリンパ系の機能障害や損傷によって引き起こされます。
米国心臓病学会財団の報告書によると、リンパ浮腫の治療は、主に症状管理、体積減少、感染予防によって進められます。例えば、リンパ浮腫の治療の第一線は保存的管理です。完全脱血療法(CGT)は理学療法的な保存的管理の最前線となっています。さらに、外科的治療のアプローチは、保存的管理の良好なアドヒアランスを提供します。さらに、リンパ浮腫に対する新しい低侵襲の血管性リンパ節移植術は、世界中で大きな注目を集めています。例えば、アリゾナ州フェニックス/スコッツデールにあるメイヨークリニックのキャンパスの医師は、従来の治療に抵抗性のリンパ浮腫を経験している患者さんのために、新しい外来手術法を開発しました。リンパ節転移の利点は、リンパ節の痛みと腫れが大幅に軽減されることです。また、この手術により、患者さんは抗生物質の使用量を減らすことができ、患者さんのQOL(生活の質)を向上させることができます。さらに、乳がん、陰茎がん、膀胱がん、婦人科がんなどの患者さんがリンパ節転移手術を受けることができます。
リンパ浮腫は慢性的な不治の病であり、患者の肉体的、精神的な幸福に影響を与えます。タームベース・ケアは、患者管理のための集学的アプローチであることが証明されています。タームベース・ケア・チームには、リハビリテーション科、血管内科、形成外科、放射線科、腫瘍科、感染症科、ソーシャルワークの人々が参加しています。このチームは、四肢の腫れの病因を評価し、保存的治療を最適化し、適切な候補者には外科的治療を提供するための徹底した評価を行うことができます。
MedStar Healthのレポートによると、患者さんのリンパ浮腫の治療計画は、その原因や重症度によって異なります。医師は薬物を処方したり、リンパ浮腫の管理を専門とする理学療法士や作業療法士に紹介したりします。治療法としては、エクササイズ、特殊なマッサージ技術、機械的なポンプ装置などを用いて腫れを抑え、痛みをコントロールします。患者さんの症状が重い場合は、リンパ節転移やリンパ管バイパスなど、より高度な治療法を医師が勧めることもあります。
Mayo Foundation for Medical Education and Researchのレポートによると、リンパ手術にロボットを使用することで、これまで使用されていた腹腔鏡手術と比較して、はるかに柔軟で精度の高い手術が可能になるとされています。さらに、ロボットの使用は、外科医と患者の両方の結果に最適であることが証明されており、予測期間中に肯定的な結果を明らかにする予定です。例えば、2020年5月にリンパ浮腫に対するシングルロボット手術を受けた患者は、外科医の大きな功績により服を着ることができるようになるなど、臨床的な改善が見られるなど、肯定的な逸話的フィードバックを提供しています。さらに、人工知能(AI)を搭載したロボットが、患者さんの回復に影響を与える可能性のある外科医のばらつきを減らすために、リンパ浮腫手術におけるマイクロサージェリーを支援することが増えています。例えば、リンパ浮腫手術では、2020年5月に泌尿器科の外科医が、リンパ浮腫の低侵襲手術治療を目的として、遊離リンパ節転移を利用した世界初のシングルポートロボットによるメンタルハーベストを実施しました。この新しい外科的治療法の主な目的は、衰弱したリンパ浮腫の症状を伴うドナー部位の病的状態を最小限に抑えることです。
治療法に基づく洞察
米国のリンパ浮腫治療市場は、治療に基づき、レーザー治療、圧迫装置と包帯、薬物治療、生理学的処置、デバルキング処置、その他に分類されます。生理的処置は、さらにリンパ管吻合術(LVA)と血管性リンパ節転移術(VLNT)に分類されます。同様に、デバルキング処置のセグメントは、外科的デバルキング、脂肪吸引、その他に細分化されます。2022年の市場では、圧迫装置と包帯のセグメントが最大のシェアを占めています。生理学的処置分野は、主にリンパ浮腫患者に対して行われるLVAおよびVLNTによる治療が可能であることから、予測期間中に最も高いCAGRを記録すると予想されます。現在、リンパ浮腫の治療には、主に2つの生理学的介入が取り入れられています。第一の介入は、リンパ管閉塞の場所に近い静脈系と鬱血したリンパ管の間にシャント(移動を容易にするための穴または小さな通路)を作るものです。もう一つの生理的介入は、患部リンパ節を含む血管性軟部組織フラップを患部リンパ節に組み込むものです。この分野では、血管性リンパ節転移(VLNT)法が予測期間中に最も高いCAGR%で成長すると思われます。北米放射線学会(RSNA)は、リンパ浮腫治療は従来、保守的で限定的なものであったが、外科的およびマイクロ外科的処置は今日、驚異的に上昇しているとしています。例えば、VLNTはマイクロサージャリーの中で最も著名で有望な技術の一つです。VLNTは、健康なドナー部位から機能的なリンパ節(LN)を、リンパの流れが損傷したり病気になったりしている体の部位に移植することです。
目次
第1章 イントロダクション
第2章 米国のリンパ浮腫治療市場 - 調査手法
第3章 調査手法
- Coverage 24
- 2次調査
- 1次調査
第4章 リンパ浮腫治療市場-市場情勢
- 専門家の見解
第5章 リンパ浮腫治療市場- 主要な市場力学
- 市場促進要因
- リンパ浮腫の発生率の増加
- ヘルスケアサービスおよびリンパ浮腫管理プログラムの増加
- 市場抑制要因
- 認識と熟練した専門家の不足
- 市場機会
- 治療法の選択肢の増加
- 今後の動向
- リンパ浮腫治療におけるロボティクスの使用
- インパクト分析
第6章 米国のリンパ浮腫治療市場分析
- 米国のリンパ浮腫治療市場の収益と予測・分析
- 米国のリンパ浮腫治療市場、企業製品別
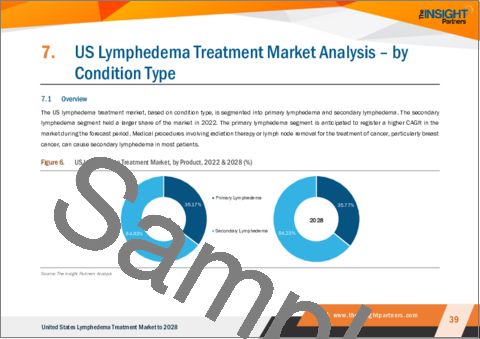
第7章 米国のリンパ浮腫治療市場分析:病態タイプ別
- 原発性リンパ浮腫
- 二次性リンパ浮腫
第8章 米国のリンパ浮腫治療薬市場分析:治療タイプ別
- レーザー治療
- 圧迫装置と包帯
- 薬物療法
- 生理的処置
- デバルキング処置
- その他
第9章 米国のリンパ浮腫治療市場の分析:エンドユーザー別
- 病院
- 診療所
- 臨床研究機関
- その他
第10章 米国のリンパ浮腫治療市場
- 米国リンパ浮腫治療市場:病態タイプ別、2019年~2028年
- 米国リンパ浮腫治療市場:治療タイプ別、2019年~2028年
- 米国リンパ浮腫治療市場:エンドユーザー別、2019年~2028年
第11章 米国のリンパ浮腫治療市場
- 米国のリンパ浮腫治療市場に対するCOVID-19パンデミックの影響分析
第12章 米国のリンパ浮腫治療市場-業界情勢
- 有機的開発
第13章 企業プロファイル
- BIOCOMPRESSION SYSTEMS
- Tactile Medical
- Essity AB
- Lohmann & Rauscher GmbH & Co. KG
- SIGVARIS GROUP
- ThermoTek Inc
- Huntleigh Healthcare Limited
- 3M Co
- AIROS Medical
- PAUL HARTMANN AG
第14章 付録
List Of Tables
- Table 1. North America Clinical Trial Imaging Market, by Modality - Revenue and Forecast to 2028 (US$ Million)
- Table 2. North America Clinical Trial Imaging Market, by Offering - Revenue and Forecast to 2028 (US$ Million)
- Table 3. North America Clinical Trial Imaging Market, by End User - Revenue and Forecast to 2028 (US$ Million)
- Table 4. US Clinical Trial Imaging Market, by Modality - Revenue and Forecast to 2028 (US$ Million)
- Table 5. US Clinical Trial Imaging Market, by Offering - Revenue and Forecast to 2028 (US$ Million)
- Table 6. US Clinical Trial Imaging Market, by End User - Revenue and Forecast to 2028 (US$ Million)
- Table 7. Canada: Clinical Trial Imaging Market, by Modality - Revenue and Forecast to 2028 (US$ Million)
- Table 8. Canada: Clinical Trial Imaging Market, by Offering - Revenue and Forecast to 2028 (US$ Million)
- Table 9. Canada: Clinical Trial Imaging Market, by End User - Revenue and Forecast to 2028 (US$ Million)
- Table 10. Mexico: Clinical Trial Imaging Market, by Modality - Revenue and Forecast to 2028 (US$ Million)
- Table 11. Mexico: Clinical Trial Imaging Market, by Offering - Revenue and Forecast to 2028 (US$ Million)
- Table 12. Mexico: Clinical Trial Imaging Market, by End User - Revenue and Forecast to 2028 (US$ Million)
- Table 13. Europe Clinical Trial Imaging Market, by Modality - Revenue and Forecast to 2028 (US$ Million)
- Table 14. Europe Clinical Trial Imaging Market, by Offering - Revenue and Forecast to 2028 (US$ Million)
- Table 15. Europe Clinical Trial Imaging Market, by End User - Revenue and Forecast to 2028 (US$ Million)
- Table 16. Germany: Clinical Trial Imaging Market, by Modality - Revenue and Forecast to 2028 (US$ Million)
- Table 17. Germany: Clinical Trial Imaging Market, by Offering - Revenue and Forecast to 2028 (US$ Million)
- Table 18. Germany: Clinical Trial Imaging Market, by End User - Revenue and Forecast to 2028 (US$ Million)
- Table 19. UK Clinical Trial Imaging Market, by Modality - Revenue and Forecast to 2028 (US$ Million)
- Table 20. UK Clinical Trial Imaging Market, by Offering - Revenue and Forecast to 2028 (US$ Million)
- Table 21. UK Clinical Trial Imaging Market, by End User - Revenue and Forecast to 2028 (US$ Million)
- Table 22. France: Clinical Trial Imaging Market, by Modality - Revenue and Forecast to 2028 (US$ Million)
- Table 23. France: Clinical Trial Imaging Market, by Offering - Revenue and Forecast to 2028 (US$ Million)
- Table 24. France: Clinical Trial Imaging Market, by End User - Revenue and Forecast to 2028 (US$ Million)
- Table 25. Italy: Clinical Trial Imaging Market, by Modality - Revenue and Forecast to 2028 (US$ Million)
- Table 26. Italy: Clinical Trial Imaging Market, by Offering - Revenue and Forecast to 2028 (US$ Million)
- Table 27. Italy: Clinical Trial Imaging Market, by End User - Revenue and Forecast to 2028 (US$ Million)
- Table 28. Spain: Clinical Trial Imaging Market, by Modality - Revenue and Forecast to 2028 (US$ Million)
- Table 29. Spain: Clinical Trial Imaging Market, by Offering - Revenue and Forecast to 2028 (US$ Million)
- Table 30. Spain: Clinical Trial Imaging Market, by End User - Revenue and Forecast to 2028 (US$ Million)
- Table 31. Rest of Europe: Clinical Trial Imaging Market, by Modality - Revenue and Forecast to 2028 (US$ Million)
- Table 32. Rest of Europe: Clinical Trial Imaging Market, by Offering - Revenue and Forecast to 2028 (US$ Million)
- Table 33. Rest of Europe: Clinical Trial Imaging Market, by End User - Revenue and Forecast to 2028 (US$ Million)
- Table 34. Asia Pacific Clinical Trial Imaging Market, by Modality- Revenue and Forecast to 2028 (US$ Million)
- Table 35. Asia Pacific Clinical Trial Imaging Market, by Offering- Revenue and Forecast to 2028 (US$ Million)
- Table 36. Asia Pacific Clinical Trial Imaging Market, by End User- Revenue and Forecast to 2028 (US$ Million)
- Table 37. China Clinical Trial Imaging Market, by Modality- Revenue and Forecast to 2028 (US$ Million)
- Table 38. China Clinical Trial Imaging Market, by Offering- Revenue and Forecast to 2028 (US$ Million)
- Table 39. China Clinical Trial Imaging Market, by End User- Revenue and Forecast to 2028 (US$ Million)
- Table 40. Japan Clinical Trial Imaging Market, by Modality- Revenue and Forecast to 2028 (US$ Million)
- Table 41. Japan Clinical Trial Imaging Market, by Offering- Revenue and Forecast to 2028 (US$ Million)
- Table 42. Japan Clinical Trial Imaging Market, by End User- Revenue and Forecast to 2028 (US$ Million)
- Table 43. India Clinical Trial Imaging Market, by Modality- Revenue and Forecast to 2028 (US$ Million)
- Table 44. India Clinical Trial Imaging Market, by Offering- Revenue and Forecast to 2028 (US$ Million)
- Table 45. India Clinical Trial Imaging Market, by End User- Revenue and Forecast to 2028 (US$ Million)
- Table 46. South Korea Clinical Trial Imaging Market, by Modality- Revenue and Forecast to 2028 (US$ Million)
- Table 47. South Korea Clinical Trial Imaging Market, by Offering- Revenue and Forecast to 2028 (US$ Million)
- Table 48. South Korea Clinical Trial Imaging Market, by End User- Revenue and Forecast to 2028 (US$ Million)
- Table 49. Australia Clinical Trial Imaging Market, by Modality- Revenue and Forecast to 2028 (US$ Million)
- Table 50. Australia Clinical Trial Imaging Market, by Offering- Revenue and Forecast to 2028 (US$ Million)
- Table 51. Australia Clinical Trial Imaging Market, by End User- Revenue and Forecast to 2028 (US$ Million)
- Table 52. Rest of Asia Pacific Clinical Trial Imaging Market, by Modality- Revenue and Forecast to 2028 (US$ Million)
- Table 53. Rest of Asia Pacific Clinical Trial Imaging Market, by Offering- Revenue and Forecast to 2028 (US$ Million)
- Table 54. Rest of Asia Pacific Clinical Trial Imaging Market, by End User- Revenue and Forecast to 2028 (US$ Million)
- Table 55. South and Central America Clinical Trial Imaging Market, by Modality- Revenue and Forecast to 2028 (US$ Million)
- Table 56. South and Central America Clinical Trial Imaging Market, by Offering- Revenue and Forecast to 2028 (US$ Million)
- Table 57. South and Central America Clinical Trial Imaging Market, by End User- Revenue and Forecast to 2028 (US$ Million)
- Table 58. Brazil Clinical Trial Imaging Market, by Modality- Revenue and Forecast to 2028 (US$ Million)
- Table 59. Brazil Clinical Trial Imaging Market, by Offering- Revenue and Forecast to 2028 (US$ Million)
- Table 60. Brazil Clinical Trial Imaging Market, by End Use- Revenue and Forecast to 2028 (US$ Million)
- Table 61. Argentina Clinical Trial Imaging Market, by Modality- Revenue and Forecast to 2028 (US$ Million)
- Table 62. Argentina Clinical Trial Imaging Market, by Offering- Revenue and Forecast to 2028 (US$ Million)
- Table 63. Argentina Clinical Trial Imaging Market, by End User- Revenue and Forecast to 2028 (US$ Million)
- Table 64. Rest of South and Central America Clinical Trial Imaging Market, by Modality- Revenue and Forecast to 2028 (US$ Million)
- Table 65. Rest of South and Central America Clinical Trial Imaging Market, by Offering- Revenue and Forecast to 2028 (US$ Million)
- Table 66. Rest of South and Central America Clinical Trial Imaging Market, by End User- Revenue and Forecast to 2028 (US$ Million)
- Table 67. Middle East & Africa Clinical Trial Imaging Market, by Modality - Revenue and Forecast to 2028 (US$ Million)
- Table 68. Middle East & Africa Clinical Trial Imaging Market, by Offering - Revenue and Forecast to 2028 (US$ Million)
- Table 69. Middle East & Africa Clinical Trial Imaging Market, by End User - Revenue and Forecast to 2028 (US$ Million)
- Table 70. South Africa Clinical Trial Imaging Market, by Modality - Revenue and Forecast to 2028 (US$ Million)
- Table 71. South Africa Clinical Trial Imaging Market, by Offering - Revenue and Forecast to 2028 (US$ Million)
- Table 72. South Africa Clinical Trial Imaging Market, by End User - Revenue and Forecast to 2028 (US$ Million)
- Table 73. Saudi Arabia Clinical Trial Imaging Market, by Modality - Revenue and Forecast to 2028 (US$ Million)
- Table 74. Saudi Arabia Clinical Trial Imaging Market, by Product and Services - Revenue and Forecast to 2028 (US$ Million)
- Table 75. Saudi Arabia Clinical Trial Imaging Market, by End User - Revenue and Forecast to 2028 (US$ Million)
- Table 76. UAE Clinical Trial Imaging Market, by Modality - Revenue and Forecast to 2028 (US$ Million)
- Table 77. UAE Clinical Trial Imaging Market, by Offering - Revenue and Forecast to 2028 (US$ Million)
- Table 78. UAE Clinical Trial Imaging Market, by End User - Revenue and Forecast to 2028 (US$ Million)
- Table 79. Rest of Middle East & Africa Clinical Trial Imaging Market, by Modality - Revenue and Forecast to 2028 (US$ Million)
- Table 80. Rest of Middle East & Africa Clinical Trial Imaging Market, by Offering - Revenue and Forecast to 2028 (US$ Million)
- Table 81. Rest of Middle East & Africa Clinical Trial Imaging Market, by End User - Revenue and Forecast to 2028 (US$ Million)
- Table 82. Recent Inorganic Growth Strategies in the Clinical Trial Imaging Market
- Table 83. Recent Organic Growth Strategies in Clinical Trial Imaging Market
- Table 84. Glossary of Terms
List Of Figures
- Figure 1. Clinical Trial Imaging Market Segmentation
- Figure 2. Clinical Trial Imaging Market by Region
- Figure 3. Global Clinical Trial Imaging Market Overview
- Figure 4. Tomography Largest Share of Modality Segment in Clinical Trial Imaging Market
- Figure 5. Asia Pacific Expected to Show Remarkable Growth During Forecast Period
- Figure 6. Clinical Trial Imaging Market, by Geography (US$ Million)
- Figure 7. Global Clinical Trial Imaging Market - Leading Country Markets (US$ Million)
- Figure 8. Global Clinical Trial Imaging Market - Industry Landscape
- Figure 9. North America: PEST Analysis
- Figure 10. Europe: PEST Analysis
- Figure 11. Asia Pacific: PEST Analysis
- Figure 12. Middle East and Africa: PEST Analysis
- Figure 13. South and Central America: PEST Analysis
- Figure 14. Clinical Trial Imaging Market: Impact Analysis of Drivers and Restraints
- Figure 15. Global Clinical Trial Imaging Market - Revenue Forecast and Analysis - 2021-2028
- Figure 16. Global Clinical Trial Imaging Market, by Geography - Forecast and Analysis (2022-2028)
- Figure 17. Market Positioning of Key Players in the Clinical Trial Imaging Market
- Figure 18. Clinical Trial Imaging Market Revenue Share, by Modality (2022 and 2028)
- Figure 19. Tomography: Clinical Trial Imaging Market - Revenue and Forecast to 2028 (US$ Million)
- Figure 20. Ultrasound: Clinical Trial Imaging Market - Revenue and Forecast to 2028 (US$ Million)
- Figure 21. PET: Clinical Trial Imaging Market - Revenue and Forecast to 2028 (US$ Million)
- Figure 22. X-Ray: Clinical Trial Imaging Market - Revenue and Forecast to 2028 (US$ Million)
- Figure 23. Echocardiography: Clinical Trial Imaging Market - Revenue and Forecast to 2028 (US$ Million)
- Figure 24. Magnetic Resonance Imaging: Clinical Trial Imaging Market - Revenue and Forecast to 2028 (US$ Million)
- Figure 25. Others: Clinical Trial Imaging Market - Revenue and Forecast to 2028 (US$ Million)
- Figure 26. Clinical Trial Imaging Market Revenue Share, by Offering (2022 and 2028)
- Figure 27. Trial Design Consulting Services: Clinical Trial Imaging Market - Revenue and Forecast to 2028 (US$ Million)
- Figure 28. Read Analysis Services: Clinical Trial Imaging Market - Revenue and Forecast to 2028 (US$ Million)
- Figure 29. Operational Imaging Services: Clinical Trial Imaging Market - Revenue and Forecast to 2028 (US$ Million)
- Figure 30. Imaging Software: Clinical Trial Imaging Market - Revenue and Forecast to 2028 (US$ Million)
- Figure 31. Others: Clinical Trial Imaging Market - Revenue and Forecast to 2028 (US$ Million)
- Figure 32. Clinical Trial Imaging Market Revenue Share, by End User (2022 and 2028)
- Figure 33. Pharmaceutical and Biopharmaceutical Companies: Clinical Trial Imaging Market - Revenue and Forecast to 2028 (US$ Million)
- Figure 34. Contract Research Organizations: Clinical Trial Imaging Market - Revenue and Forecast to 2028 (US$ Million)
- Figure 35. Academic and Research Institutes: Clinical Trial Imaging Market - Revenue and Forecast to 2028 (US$ Million)
- Figure 36. Others: Clinical Trial Imaging Market - Revenue and Forecast to 2028 (US$ Million)
- Figure 37. North America: Clinical Trial Imaging Market, by Key Country - Revenue (2022) (US$ Million)
- Figure 38. North America Clinical Trial Imaging Market - Revenue and Forecast to 2028 (US$ Million)
- Figure 39. North America: Clinical Trial Imaging Market, by Country, 2022 & 2028 (%)
- Figure 40. US: Clinical Trial Imaging Market - Revenue and Forecast to 2028 (US$ Million)
- Figure 41. Canada: Clinical Trial Imaging Market - Revenue and Forecast to 2028 (US$ Million)
- Figure 42. Mexico: Clinical Trial Imaging Market - Revenue and Forecast to 2028 (US$ Million)
- Figure 43. Europe: Clinical Trial Imaging Market, by Key Country - Revenue (2022) (US$ Million)
- Figure 44. Europe Clinical Trial Imaging Market - Revenue and Forecast to 2028 (US$ Million)
- Figure 45. Europe: Clinical Trial Imaging Market, by Country, 2022 & 2028 (%)
- Figure 46. Germany: Clinical Trial Imaging Market - Revenue and Forecast to 2028 (US$ Million)
- Figure 47. UK: Clinical Trial Imaging Market - Revenue and Forecast to 2028 (US$ Million)
- Figure 48. France: Clinical Trial Imaging Market - Revenue and Forecast to 2028 (US$ Million)
- Figure 49. Italy: Clinical Trial Imaging Market - Revenue and Forecast to 2028 (US$ Million)
- Figure 50. Spain: Clinical Trial Imaging Market - Revenue and Forecast to 2028 (US$ Million)
- Figure 51. Rest of Europe: Clinical Trial Imaging Market - Revenue and Forecast to 2028 (US$ Million)
- Figure 52. Asia Pacific: Clinical Trial Imaging Market, by Key Country - Revenue (2022) (US$ Million)
- Figure 53. Asia Pacific Clinical Trial Imaging Market Revenue and Forecast to 2028 (US$ Million)
- Figure 54. China Clinical Trial Imaging Market Revenue and Forecast to 2028 (US$ Million)
- Figure 55. Japan Clinical Trial Imaging Market Revenue and Forecast to 2028 (US$ Million)
- Figure 56. India Clinical Trial Imaging Market Revenue and Forecast to 2028 (US$ Million)
- Figure 57. South Korea Clinical Trial Imaging Market Revenue and Forecast to 2028 (US$ Million)
- Figure 58. Australia Clinical Trial Imaging Market Revenue and Forecast to 2028 (US$ Million)
- Figure 59. Rest of Asia Pacific Clinical Trial Imaging Market Revenue and Forecast to 2028 (US$ Million)
- Figure 60. South and Central America: Clinical Trial Imaging Market, by Key Country - Revenue (2022) (US$ Million)
- Figure 61. South and Central America Clinical Trial Imaging Market Revenue and Forecast to 2028 (US$ Million)
- Figure 62. Brazil Clinical Trial Imaging Market Revenue and Forecast to 2028 (US$ Million)
- Figure 63. Argentina Clinical Trial Imaging Market Revenue and Forecast to 2028 (US$ Million)
- Figure 64. Rest of South and Central America Clinical Trial Imaging Market Revenue and Forecast to 2028 (US$ Million)
- Figure 65. Middle East & Africa: Clinical Trial Imaging Market, by Key Country - Revenue (2022) (US$ Million)
- Figure 66. Middle East & Africa Clinical Trial Imaging Market - Revenue and Forecast to 2028 (US$ Million)
- Figure 67. South Africa: Clinical Trial Imaging Market - Revenue and Forecast to 2028 (US$ Million)
- Figure 68. Saudi Arabia: Clinical Trial Imaging Market - Revenue and Forecast to 2028 (US$ Million)
- Figure 69. UAE: Clinical Trial Imaging Market - Revenue and Forecast to 2028 (US$ Million)
- Figure 70. Rest of Middle East & Africa: Clinical Trial Imaging Market - Revenue and Forecast to 2028 (US$ Million)
- Figure 71. Impact of COVID-19 Pandemic on North American Country Markets
- Figure 72. Impact of COVID-19 Pandemic on European Country Markets
- Figure 73. Impact of COVID-19 Pandemic In Asia Pacific Country Markets
- Figure 74. Impact of COVID-19 Pandemic on South and Central America Country Markets
- Figure 75. Impact of COVID-19 Pandemic on Middle East and Africa Country Markets
- Figure 76. Growth Strategies in Clinical Trial Imaging Market
The US lymphedema treatment market size is expected to grow from US$ 5,185.98 million in 2022 to US$ 8,320.07 million by 2028; it is estimated to record a CAGR of 8.2% from 2023 to 2028.
The US lymphedema treatment market growth is attributed to the rising incidence of lymphedema cases and increasing healthcare services and lymphedema management programs. However, a lack of awareness and skilled proffesionals is hampering the growth of the market.
Lymphedema involve the accumulation of lymph fluid in fatty tissues just beneath the skin. The condition is caused due to impaired flow in the lymphatic system of a person and is observed either in the legs or arms or in both. It can also be affecting abdomen, neck, genitals, and face of a person, depending on the portion of the body which has undergone treatment. Primary lymphedema is generally present at birth, while secondary lymphedema is caused due to dysfunction or damage to the lymphatic system.
According to the American College of Cardiology Foundation report, the treatment of lymphedema is primarily driven by symptom management, volume reduction, and infection prevention. For example, the first line of treatment for lymphedema is conservative management. Complete decongestive therapy (CGT) has become the forefront of physiotherapeutic conservative management. Additionally, surgical treatment approaches provide good adherence to conservative management. Moreover, the new minimally invasive vascularized lymph node transfer for lymphedema has gained significant attention worldwide. For example, physicians at Mayo Clinic's campus in Phoenix/Scottsdale, Arizona, have developed a new outpatient surgical procedure for patients experiencing lymphedema refractory to traditional therapy. Benefits associated with lymph node transfer involve a significant reduction of pain and swelling in the lymphedemic anatomy. Also, the surgery allows patients to decrease their antibiotic use, adding quality-of-life benefits among the patient pool. Further, patients diagnosed with breast, skin penile, bladder, and gynecological cancers may undergo lymph nodes procedure.
Lymphedema is a chronic, incurable disease affecting a patient's physical and mental well-being. Term-based care proves to be a multidisciplinary approach for patient management. The term-based care team includes people from physical rehabilitation, vascular medicine, plastic surgery, radiology, oncology, infectious disease, and social work. The team can provide a thorough evaluation for assessing the etiology of limb swelling, optimizing conservative care, and offering surgical treatment for appropriate candidates.
MedStar Health report states that a patient's lymphedema treatment plans will depend on the cause and severity of the condition. Doctors may prescribe medication or refer to a physical or occupational therapist specializing in the management of lymphedema. Therapies include reducing swelling and controlling pain through exercises, special massage techniques, or mechanical pumping devices. If a patient's condition is severe, doctors may recommend more advanced treatments such as lymph node transfer and lymphovenous bypass.
The Mayo Foundation for Medical Education and Research report states that the utility of robotics for lymphatic surgery allows much greater flexibility and precision compared to previously used laparoscopy. Additionally, the use of robotics proves optimal for both surgeon and patient outcomes and will reveal positive results during the forecast period. For instance, patients who underwent single-robotic surgery for lymphedema in May 2020 have provided positive anecdotal feedback, including significant clinical improvement such as the ability to wear clothes with the surgeon's significant accomplishments. Further, robots enabled with artificial intelligence (AI) are increasingly assisting in microsurgical procedures in lymphedema surgeries for reducing surgeon variations that could affect patient recovery. For example, for lymphedema surgery, in May 2020, an urogynecology surgeon performed a first-of-its-kind single-port robotic mental harvest by utilizing a free lymph node transfer, intended for minimally invasive surgical treatment of lymphedema. The main objective of this new surgical treatment method is to minimize donor site morbidity with debilitating lymphedema symptoms.
Treatment-Based Insights
Based on treatment, the US lymphedema treatment market is categorized into laser therapy, compression devices and bandaging, drug therapy, physiological procedures, debulking procedures, and others. The physiological procedures segment is further segmented into lymphovenous anastomosis (LVA) and vascularized lymph node transfer (VLNT). Similarly, the debulking procedures segment is subdivided into surgical debulking, liposuction, and others. The compression devices and bandaging segment held the largest share of the market in 2022. The physiological procedure segment is anticipated to register the highest CAGR during the forecast period mainly due to the treatment availability through LVA and VLNT performed on lymphedema patients. Two main physiologic interventions are currently incorporated to treat lymphedema. The primary intervention creates a shunt (a hole or a small passage to facilitate movement) between the congested lymphatic channels with the venous system close to the location of lymphatic obstruction. The other physiologic intervention incorporates vascularized soft tissue flaps that frequently include vascularized lymph nodes to the affected lymphatic extremity. Under this segment, the vascularized lymph node transfer (VLNT) procedure will grow at the highest CAGR% during the forecasted year. The Radiological Society of North America (RSNA) states that lymphedema treatment has traditionally been conservative and limited, but surgical and microsurgical procedures have risen tremendously today. For instance, VLNT is one of the most prominent and promising techniques for micro surgeries. VLNT involves the transfer of functional lymph nodes (LNs) from a healthy donor site to an area of the body with damaged or diseased lymphatic drainage.
Reasons to Buy:
- Save and reduce time carrying out entry-level research by identifying the growth, size, leading players and segments in the US lymphedema treatment market.
- Highlights key business priorities in order to assist companies to realign their business strategies.
- The key findings and recommendations highlight crucial progressive industry trends in the US lymphedema treatment market, thereby allowing players across the value chain to develop effective long-term strategies.
- Develop/modify business expansion plans by using substantial growth offering developed and emerging markets.
- Scrutinize in-depth global market trends and outlook coupled with the factors driving the market, as well as those hindering it.
- Enhance the decision-making process by understanding the strategies that underpin security interest with respect to client products, segmentation, pricing and distribution.
1. Introduction
2. US Lymphedema Treatment Market – Key Takeaways
3. Research Methodology
- 3.1 Coverage 24
- 3.2 Secondary Research
- 3.3 Primary Research
4. Lymphedema Treatment Market – Market Landscape
- 4.1 Overview
- 4.2 Experts' Opinion
5. Lymphedema Treatment Market – Key Market Dynamics
- 5.1 Market Drivers
- 5.1.1 Rising Incidence of Lymphedema Cases
- 5.1.2 Increasing Healthcare Services and Lymphedema Management Programs
- 5.2 Market Restraints
- 5.2.1 Lack of Awareness and Skilled Professionals
- 5.3 Market Opportunities
- 5.3.1 Rising Treatment Options
- 5.4 Future Trends
- 5.4.1 Use of Robotics for Lymphedema Treatment
- 5.5 Impact Analysis
6. US Lymphedema Treatment Market Analysis
- 6.1 US Lymphedema Treatment Market Revenue Forecast and Analysis
- 6.2 US Lymphedema Treatment Market, By Company Products
7. US Lymphedema Treatment Market Analysis – by Condition Type
- 7.1 Overview
- 7.2 Primary Lymphedema
- 7.3 Secondary Lymphedema
8. US Lymphedema Treatment Market Analysis – by Treatment Type
- 8.1 Overview
- 8.2 Laser Therapy
- 8.3 Compression Devices and Bandaging
- 8.4 Drug Therapy
- 8.5 Physiological Procedures
- 8.6 Debulking Procedures
- 8.7 Others
9. US Lymphedema Treatment Market Analysis – by End User
- 9.1 Overview
- 9.2 Hospitals
- 9.3 Clinics
- 9.4 Clinical Research Organization
- 9.5 Others
10. US Lymphedema Treatment Market
- 10.1 Overview
- 10.1.1 US Lymphedema Treatment Market – Revenue and Forecast to 2028 (US$ Million)
- 10.1.1.1 US Lymphedema Treatment Market, by Condition Type, 2019–2028 (USD Million)
- 10.1.1.2 US Lymphedema Treatment Market, by Treatment Type, 2019–2028 (USD Million)
- 10.1.1.3 US Lymphedema Treatment Market, by End User, 2019–2028 (USD Million)
- 10.1.1 US Lymphedema Treatment Market – Revenue and Forecast to 2028 (US$ Million)
11. US Lymphedema Treatment Market: Impact Assessment of COVID-19 Pandemic
- 11.1 Impact Analysis of COVID-19 Pandemic on US Lymphedema Treatment Market
12. US Lymphedema Treatment Market–Industry Landscape
- 12.1 Overview
- 12.2 Organic Developments
13. Company Profiles
- 13.1 BIOCOMPRESSION SYSTEMS
- 13.2 Tactile Medical
- 13.3 Essity AB
- 13.4 Lohmann & Rauscher GmbH & Co. KG
- 13.5 SIGVARIS GROUP
- 13.6 ThermoTek Inc
- 13.7 Huntleigh Healthcare Limited
- 13.8 3M Co
- 13.9 AIROS Medical
- 13.10 PAUL HARTMANN AG
14. Appendix
- 14.1 About The Insight Partners
- 14.2 Glossary of Terms