|
|
市場調査レポート
商品コード
1206398
南米のモバイル水処理市場の2028年までの予測- 地域別分析- オファリング別、用途別、エンドユーザー別South America Mobile Water Treatment Market Forecast to 2028 - COVID-19 Impact and Regional Analysis - by Offering, Application, and End User |
||||||
|
|
|||||||


| 南米のモバイル水処理市場の2028年までの予測- 地域別分析- オファリング別、用途別、エンドユーザー別 |
|
出版日: 2023年01月17日
発行: The Insight Partners
ページ情報: 英文 109 Pages
納期: 即納可能
|
- 全表示
- 概要
- 図表
- 目次
南米のモバイル水処理市場は、2022年の1億3,196万米ドルから2028年には2億1,921万米ドルに成長すると予測されています。2022年から2028年までのCAGRは8.8%と推定されています。
廃水処理に関する厳しい政府規制が南米のモバイル水処理市場の活性化要因に
廃水の約78%は未処理のまま、河川、地下水、湖沼に廃棄され、深刻な水質汚染を引き起こしています。そのため、この地域の政府は、水質改善のための規制を強化するとともに、産業界へのモバイル水処理システムの導入を促進しています。新興諸国では、人口と産業の成長により、産業で使用する清浄な水源の必要性が高まっています。廃水処理に関する規制を遵守し、関連技術を採用することで、工業プラントのオーナーやオペレーターは、排水中の汚染物質レベルに関する規制を遵守することができます。様々な政府による厳しい規制基準が、南米のモバイル水処理市場を牽引しています。
南米のモバイル水処理市場の概要
ブラジルとアルゼンチンは、南米のモバイル水処理市場の主要な貢献者の一人です。都市化、人口増加、工業化は、この地域のモバイル水処理市場に引き続き貢献すると予想されます。また、建設業の復興に伴う需要の増加や、専門的なモバイル水処理システムやサービスを提供する企業の存在が、同地域の市場成長を促進しています。水ろ過は、物理的な浄化よりも費用対効果の高いプロセスです。また、ろ過、イオン交換、逆浸透膜は大規模な設備投資を必要とするため、低コストのモバイル水処理ソリューションの需要はかなりの割合で伸びています。この地域の国々は、モバイル水処理がこの地域に強く根付いているため、緩やかな成長を示しています。例えば、2014年には、Ecosphere Technologies, Inc.がBrasil Clean Energy(以下、BCE)向けにOzonix EF10M水処理システムを初納品しています。しかし、他の地域と比較すると、南米はまだ先進的な技術の導入に欠けています。
南米のモバイル水処理市場の収益と2028年までの予測(金額)
南米のモバイル水処理市場のセグメンテーション
南米のモバイル水処理市場は、製品、アプリケーション、エンドユーザー、国別に区分されます。オファリングに基づき、市場はシステム部門とサービス部門に区分されます。2022年には、サービスセグメントがより大きな市場シェアを登録しました。
アプリケーションに基づいて、南米のモバイル水処理市場は、清澄化、ろ過、化学軟化、逆浸透、イオン交換、およびその他にセグメント化されます。2022年には、ろ過分野が最大の市場シェアを記録しました。
エンドユーザーに基づいて、南米のモバイル水処理市場は、建設、自治体、農業、化学、およびその他に分割されます。2022年には、その他セグメントが最大の市場シェアを記録しました。
国に基づき、南米のモバイル水処理市場は、ブラジル、アルゼンチン、および南米の他の地域に分割されます。2022年の市場シェアは、ブラジルが独占しています。
Aquatech International LLC;EMWG Srl;Evoqua Water Technologies Corp.;Filtra-Systems Company LLC;Newater Technology Co.;Pall Corporation;and Veolia Environnement SAは、南米のモバイル水処理市場で活動している主要企業です。
目次
第1章 イントロダクション
第2章 重要なポイント
第3章 調査手法
- カバレッジ
- 2次調査
- 1次調査
第4章 南米のモバイル水処理市場の展望
- 市場概要
- 南米のPEST分析
- エコシステム分析
- 専門家の見解
第5章 南米のモバイル水処理市場-主要な市場力学
- 市場促進要因
- 産業界における水質浄化の需要増加
- 廃水処理に関する政府の厳しい規制
- 主な市場抑制要因
- 高い設置・運用コスト
- 今後の動向
- トラック搭載型モバイル水処理装置
- 促進要因と抑制要因の影響分析
第6章 モバイル水処理装置- 南米市場分析
- 南米のモバイル水処理市場の収益と予測・分析
第7章 南米のモバイル水処理市場- オファリング別
- 南米のモバイル水処理市場、オファリング別(2020年、2028年)
- システム
- サービス
第8章 南米のモバイル水処理市場- 用途別
- 南米のモバイル水処理市場:用途別(2020年、2028年)
- 清澄化
- ろ過
- 化学的軟化
- 逆浸透膜
- イオン交換
- その他
第9章 南米のモバイル水処理市場- エンドユーザー別
- 南米のモバイル水処理市場:エンドユーザー別(2020年、2028年)
- 建設業
- 自治体
- 農業
- 化学
- その他
第10章 南米のモバイル水処理市場- 国別分析
- 南米
- ブラジル
- アルゼンチン
- その他南米地域
第11章 業界情勢
- M&A:合併・買収
- ジョイントベンチャー
第12章 企業プロファイル
- Newater Technology Co.
- Pall Corporation
- Evoqua Water Technologies Corp.
- Aquatech International LLC
- Filtra-Systems Company LLC
- EMWG Srl
- Veolia Environnement SA
第13章 付録
List Of Tables
- Table 1. SAM Mobile Water Treatment Market Revenue and Forecast to 2028 (US$ Million)
- Table 2. SAM: Mobile Water Treatment Market, By Country - Revenue and Forecast to 2028 (US$ Million)
- Table 3. Brazil: Mobile Water Treatment Market, By Offering - Revenue and Forecast to 2028 (US$ Million)
- Table 4. Brazil: Mobile Water Treatment Market, By Services - Revenue and Forecast to 2028 (US$ Million)
- Table 5. Brazil: Mobile Water Treatment Market, By Application - Revenue and Forecast to 2028 (US$ Million)
- Table 6. Brazil: Mobile Water Treatment Market, By End User - Revenue and Forecast to 2028 (US$ Million)
- Table 7. Argentina: Mobile Water Treatment Market, By Offering - Revenue and Forecast to 2028 (US$ Million)
- Table 8. Argentina: Mobile Water Treatment Market, By Services - Revenue and Forecast to 2028 (US$ Million)
- Table 9. Argentina: Mobile Water Treatment Market, By Application - Revenue and Forecast to 2028 (US$ Million)
- Table 10. Argentina: Mobile Water Treatment Market, By End User - Revenue and Forecast to 2028 (US$ Million)
- Table 11. Rest of SAM: Mobile Water Treatment Market, By Offering - Revenue and Forecast to 2028 (US$ Million)
- Table 12. Rest of SAM: Mobile Water Treatment Market, By Services - Revenue and Forecast to 2028 (US$ Million)
- Table 13. Rest of SAM: Mobile Water Treatment Market, By Application - Revenue and Forecast to 2028 (US$ Million)
- Table 14. Rest of SAM: Mobile Water Treatment Market, By End User - Revenue and Forecast to 2028 (US$ Million)
- Table 15. List of Abbreviation
List Of Figures
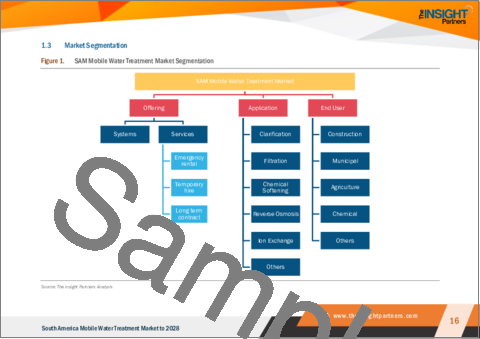
- Figure 1. SAM Mobile Water Treatment Market Segmentation
- Figure 2. SAM Mobile Water Treatment Market Segmentation - By Country
- Figure 3. SAM Mobile Water Treatment Market Overview
- Figure 4. SAM Mobile Water Treatment Market, By Offering
- Figure 5. SAM Mobile Water Treatment Market, By Country
- Figure 6. South America - PEST Analysis
- Figure 7. Mobile Water Treatment Market- Ecosystem Analysis
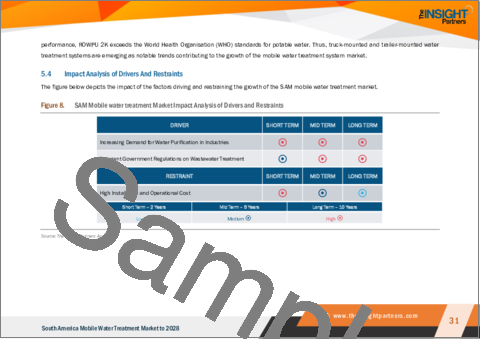
- Figure 8. SAM Mobile water treatment Market Impact Analysis of Drivers and Restraints
- Figure 9. SAM Mobile Water Treatment Market Revenue Forecast and Analysis (US$ Million)
- Figure 10. SAM Mobile Water Treatment Market Revenue Share, by Offering (2020 and 2028)
- Figure 11. Systems: SAM Mobile Water Treatment Market - Revenue and Forecast to 2028 (US$ Million)
- Figure 12. Services: SAM Mobile Water Treatment Market - Revenue and Forecast to 2028 (US$ Million)
- Figure 13. Emergency Rental: SAM Mobile Water Treatment Market - Revenue and Forecast to 2028 (US$ Million)
- Figure 14. Temporary Hire: SAM Mobile Water Treatment Market - Revenue and Forecast to 2028 (US$ Million)
- Figure 15. Long Term Contract: SAM Mobile Water Treatment Market - Revenue and Forecast to 2028 (US$ Million)
- Figure 16. SAM Mobile Water Treatment Market Revenue Share, by Application (2020 and 2028)
- Figure 17. Clarification: SAM Mobile Water Treatment Market - Revenue and Forecast to 2028 (US$ Million)
- Figure 18. Filtration: SAM Mobile Water Treatment Market - Revenue and Forecast to 2028 (US$ Million)
- Figure 19. Chemical Softening: SAM Mobile Water Treatment Market - Revenue and Forecast to 2028 (US$ Million)
- Figure 20. Reverse Osmosis: SAM Mobile Water Treatment Market - Revenue and Forecast to 2028 (US$ Million)
- Figure 21. Ion Exchange: SAM Mobile Water Treatment Market - Revenue and Forecast to 2028 (US$ Million)
- Figure 22. Others: SAM Mobile Water Treatment Market - Revenue and Forecast to 2028 (US$ Million)
- Figure 23. SAM Mobile Water Treatment Market Revenue Share, by End User (2020 and 2028)
- Figure 24. Construction: SAM Mobile Water Treatment Market - Revenue and Forecast to 2028 (US$ Million)
- Figure 25. Municipal: SAM Mobile Water Treatment Market - Revenue and Forecast to 2028 (US$ Million)
- Figure 26. Agriculture: SAM Mobile Water Treatment Market - Revenue and Forecast to 2028 (US$ Million)
- Figure 27. Chemical: SAM Mobile Water Treatment Market - Revenue and Forecast to 2028 (US$ Million)
- Figure 28. Others: SAM Mobile Water Treatment Market - Revenue and Forecast to 2028 (US$ Million)
- Figure 29. SAM: Mobile Water Treatment Market, by Key Country - Revenue (2021) (US$ Million)
- Figure 30. SAM: Mobile Water Treatment Market Revenue Share, by Key Country (2021 & 2028)
- Figure 31. Brazil: Mobile Water Treatment Market - Revenue and Forecast to 2028 (US$ Million)
- Figure 32. Argentina: Mobile Water Treatment Market - Revenue and Forecast to 2028 (US$ Million)
- Figure 33. Rest of SAM: Mobile Water Treatment Market - Revenue and Forecast to 2028 (US$ Million)
The SAM mobile water treatment market is expected to grow from US$ 131.96 million in 2022 to US$ 219.21 million by 2028. It is estimated to grow at a CAGR of 8.8% from 2022 to 2028.
Stringent Government Regulations on Wastewater Treatment is Fueling the SAM Mobile Water Treatment Market
Approximately 78% of the wastewater remains untreated and is disposed of in rivers, groundwater, or lakes, causing severe water pollution. Therefore, governments across the region are reinforcing their regulatory efforts to improve the overall water quality, along with encouraging the deployment of mobile water treatment systems in industries. In developing countries population and industrial growth have created pressure regarding the need for clean water sources for use in industries. Abiding by wastewater treatment regulations and adopting related technologies help industrial plant owners/operators to comply with the regulations pertaining to pollutant levels in their discharge. Several stringent regulatory norms by various governments are driving the SAM mobile water treatment market .
SAM Mobile Water Treatment Market Overview
Brazil and Argentina are among the key contributors to the SAM mobile water treatment market . Urbanization, population growth, and industrialization are expected to continue to contribute to the mobile water treatment market in this region. Moreover, growing demand from the reviving construction industry, and the presence of companies offering specialized mobile water treatment systems and services are driving the market growth in the region. Water filtration is a more cost-effective process than physical purification. In addition, filtration, ion exchange, and reverse osmosis plant require large capital investments, and therefore, the demand for alternative low-cost mobile water treatment solution is growing at considerable rate. The countries in the region has witnessed moderate growth as mobile water treatment has strong roots in the region. Such as in 2014, Ecosphere Technologies, Inc. has delivered the first Ozonix EF10M water treatment system for the Brasil Clean Energy ("BCE"). However, considering to other regions south America still lacks in the adoption of advanced technologies.
SAM Mobile Water Treatment Market Revenue and Forecast to 2028 (US$ Million)
SAM Mobile Water Treatment Market Segmentation
The SAM mobile water treatment market is segmented into offering, application, end user, and country. Based on offering, the market is segmented into systems and services segment. The services segment registered a larger market share in 2022.
Based on application, the SAM mobile water treatment market is segmented into clarification, filtration, chemical softening, reverse osmosis, ion exchange, and others. The filtration segment registered the largest market share in 2022.
Based on end user, the SAM mobile water treatment market is segmented into construction, municipal, agriculture, chemical, and others. The others segment registered the largest market share in 2022.
Based on country, the SAM mobile water treatment market is segmented into Brazil, Argentina, and the Rest of SAM. Brazil dominated the market share in 2022.
Aquatech International LLC; EMWG Srl; Evoqua Water Technologies Corp.; Filtra-Systems Company LLC; Newater Technology Co.; Pall Corporation; and Veolia Environnement SA are the leading companies operating in the SAM mobile water treatment market .
Reasons to Buy:
- Save and reduce time carrying out entry-level research by identifying the growth, size, leading players, and segments in the SAM mobile water treatment market.
- Highlights key business priorities in order to assist companies to realign their business strategies
- The key findings and recommendations highlight crucial progressive industry trends in the SAM mobile water treatment market, thereby allowing players across the value chain to develop effective long-term strategies
- Develop/modify business expansion plans by using substantial growth offering developed and emerging markets
- Scrutinize in-depth SAM market trends and outlook coupled with the factors driving the mobile water treatment market, as well as those hindering it
- Enhance the decision-making process by understanding the strategies that underpin commercial interest with respect to client products, segmentation, pricing, and distribution
Table Of Contents
1. Introduction
- 1.1 Study Scope
- 1.2 The Insight Partners Research Report Guidance
- 1.3 Market Segmentation
2. Key Takeaways
3. Research Methodology
- 3.1 Coverage
- 3.2 Secondary Research
- 3.3 Primary Research
4. SAM Mobile Water Treatment Market Landscape
- 4.1 Market Overview
- 4.2 SAM PEST Analysis
- 4.3 Ecosystem Analysis
- 4.4 Expert Opinions
5. SAM Mobile Water Treatment Market - Key Market Dynamics
- 5.1 Market Drivers
- 5.1.1 Increasing Demand for Water Purification in Industries
- 5.1.2 Stringent Government Regulations on Wastewater Treatment
- 5.2 Key Market Restraints
- 5.2.1 High Installation and Operational Cost
- 5.3 Future Trends
- 5.3.1 Truck-Mounted Mobile Water Treatment Plants
- 5.4 Impact Analysis of Drivers And Restraints
6. Mobile Water Treatment - SAM Market Analysis
- 6.1 SAM Mobile Water Treatment Market Revenue Forecast and Analysis
7. SAM Mobile Water Treatment Market - By Offering
- 7.1 Overview
- 7.2 SAM Mobile Water Treatment Market, By Offering (2020 and 2028)
- 7.3 Systems
- 7.3.1 Overview
- 7.3.2 Systems: Mobile Water Treatment Market - Revenue and Forecast to 2028 (US$ Million)
- 7.4 Services
- 7.4.1 Overview
- 7.4.2 Services: Mobile Water Treatment Market - Revenue and Forecast to 2028 (US$ Million)
- 7.4.2.1 Emergency Rental
- 7.4.2.1.1 Overview
- 7.4.2.1.2 Emergency Rental: Mobile Water Treatment Market - Revenue and Forecast to 2028 (US$ Million)
- 7.4.2.2 Temporary Hire
- 7.4.2.2.1 Overview
- 7.4.2.2.2 Temporary Hire: Mobile Water Treatment Market - Revenue and Forecast to 2028 (US$ Million)
- 7.4.2.3 Long Term Contract
- 7.4.2.3.1 Overview
- 7.4.2.3.2 Long Term Contract: Mobile Water Treatment Market - Revenue and Forecast to 2028 (US$ Million)
- 7.4.2.1 Emergency Rental
8. SAM Mobile Water Treatment Market - By Application
- 8.1 Overview
- 8.2 SAM Mobile Water Treatment Market, By Application (2020 and 2028)
- 8.3 Clarification
- 8.3.1 Overview
- 8.3.2 Clarification: Mobile Water Treatment Market - Revenue and Forecast to 2028 (US$ Million)
- 8.4 Filtration
- 8.4.1 Overview
- 8.4.2 Filtration: Mobile Water Treatment Market - Revenue and Forecast to 2028 (US$ Million)
- 8.5 Chemical Softening
- 8.5.1 Overview
- 8.5.2 Chemical Softening: Mobile Water Treatment Market - Revenue and Forecast to 2028 (US$ Million)
- 8.6 Reverse Osmosis
- 8.6.1 Overview
- 8.6.2 Reverse Osmosis: Mobile Water Treatment Market - Revenue and Forecast to 2028 (US$ Million)
- 8.7 Ion Exchange
- 8.7.1 Overview
- 8.7.2 Ion Exchange: Mobile Water Treatment Market - Revenue and Forecast to 2028 (US$ Million)
- 8.8 Others
- 8.8.1 Overview
- 8.8.2 Others: Mobile Water Treatment Market - Revenue and Forecast to 2028 (US$ Million)
9. SAM Mobile Water Treatment Market - By End User
- 9.1 Overview
- 9.2 SAM Mobile Water Treatment Market, By End User (2020 and 2028)
- 9.3 Construction
- 9.3.1 Overview
- 9.3.2 Construction: Mobile Water Treatment Market - Revenue and Forecast to 2028 (US$ Million)
- 9.4 Municipal
- 9.4.1 Overview
- 9.4.2 Municipal: Mobile Water Treatment Market - Revenue and Forecast to 2028 (US$ Million)
- 9.5 Agriculture
- 9.5.1 Overview
- 9.5.2 Agriculture: Mobile Water Treatment Market - Revenue and Forecast to 2028 (US$ Million)
- 9.6 Chemical
- 9.6.1 Overview
- 9.6.2 Chemical: Mobile Water Treatment Market - Revenue and Forecast to 2028 (US$ Million)
- 9.7 Others
- 9.7.1 Overview
- 9.7.2 Others: Mobile Water Treatment Market - Revenue and Forecast to 2028 (US$ Million)
10. SAM Mobile Water Treatment Market - Country Analysis
- 10.1 Overview
- 10.1.1 SAM: Mobile Water Treatment Market, By Key Country
- 10.1.1.1 Brazil: Mobile Water Treatment Market - Revenue and Forecast to 2028 (US$ Million)
- 10.1.1.1.1 Brazil: Mobile Water Treatment Market, By Offering
- 10.1.1.1.1.1 Brazil: Mobile Water Treatment Market, By Services
- 10.1.1.1.2 Brazil: Mobile Water Treatment Market, By Application
- 10.1.1.1.3 Brazil: Mobile Water Treatment Market, By End User
- 10.1.1.2 Argentina: Mobile Water Treatment Market - Revenue and Forecast to 2028 (US$ Million)
- 10.1.1.2.1 Argentina: Mobile Water Treatment Market, By Offering
- 10.1.1.2.1.1 Argentina: Mobile Water Treatment Market, By Services
- 10.1.1.2.2 Argentina: Mobile Water Treatment Market, By Application
- 10.1.1.2.3 Argentina: Mobile Water Treatment Market, By End User
- 10.1.1.3 Rest of SAM: Mobile Water Treatment Market - Revenue and Forecast to 2028 (US$ Million)
- 10.1.1.3.1 Rest of SAM: Mobile Water Treatment Market, By Offering
- 10.1.1.3.1.1 Rest of SAM: Mobile Water Treatment Market, By Services
- 10.1.1.3.2 Rest of SAM: Mobile Water Treatment Market, By Application
- 10.1.1.3.3 Rest of SAM: Mobile Water Treatment Market, By End User
- 10.1.1.1 Brazil: Mobile Water Treatment Market - Revenue and Forecast to 2028 (US$ Million)
- 10.1.1 SAM: Mobile Water Treatment Market, By Key Country
11. Industry Landscape
- 11.1 Merger and Acquisitions
- 11.2 Joint Venture
12. Company Profiles
- 12.1 Newater Technology Co.
- 12.1.1 Key Facts
- 12.1.2 Business Description
- 12.1.3 Products and Services
- 12.1.4 Financial Overview
- 12.1.5 SWOT Analysis
- 12.1.6 Key Developments
- 12.2 Pall Corporation
- 12.2.1 Key Facts
- 12.2.2 Business Description
- 12.2.3 Products and Services
- 12.2.4 Financial Overview
- 12.2.5 SWOT Analysis
- 12.2.6 Key Developments
- 12.3 Evoqua Water Technologies Corp.
- 12.3.1 Key Facts
- 12.3.2 Business Description
- 12.3.3 Products and Services
- 12.3.4 Financial Overview
- 12.3.5 SWOT Analysis
- 12.3.6 Key Developments
- 12.4 Aquatech International LLC
- 12.4.1 Key Facts
- 12.4.2 Business Description
- 12.4.3 Products and Services
- 12.4.4 Financial Overview
- 12.4.5 SWOT Analysis
- 12.4.6 Key Developments
- 12.5 Filtra-Systems Company LLC
- 12.5.1 Key Facts
- 12.5.2 Business Description
- 12.5.3 Products and Services
- 12.5.4 Financial Overview
- 12.5.5 SWOT Analysis
- 12.5.6 Key Developments
- 12.6 EMWG Srl
- 12.6.1 Key Facts
- 12.6.2 Business Description
- 12.6.3 Products and Services
- 12.6.4 Financial Overview
- 12.6.5 SWOT Analysis
- 12.6.6 Key Developments
- 12.7 Veolia Environnement SA
- 12.7.1 Key Facts
- 12.7.2 Business Description
- 12.7.3 Products and Services
- 12.7.4 Financial Overview
- 12.7.5 SWOT Analysis
- 12.7.6 Key Developments
13. Appendix
- 13.1 About The Insight Partners
- 13.2 Word Index