|
|
市場調査レポート
商品コード
1206385
中東・アフリカのモバイル水処理市場の2028年までの予測- 地域別分析- オファリング別、アプリケーション別、エンドユーザー別Middle East & Africa Mobile Water Treatment Market Forecast to 2028 - COVID-19 Impact and Regional Analysis - by Offering, Application, and End User |
||||||
|
|
|||||||


| 中東・アフリカのモバイル水処理市場の2028年までの予測- 地域別分析- オファリング別、アプリケーション別、エンドユーザー別 |
|
出版日: 2023年01月17日
発行: The Insight Partners
ページ情報: 英文 117 Pages
納期: 即納可能
|
- 全表示
- 概要
- 図表
- 目次
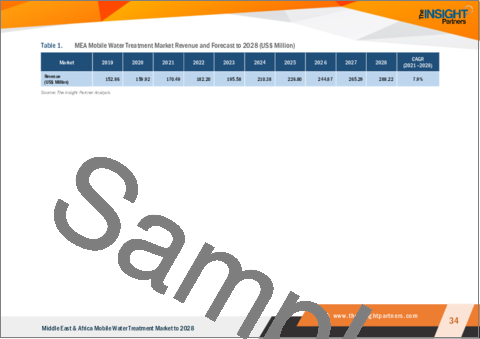
中東・アフリカのモバイル水処理市場は、2022年の1億8,220万米ドルから2028年には2億8,822万米ドルに成長すると予測されています。2022年から2028年までのCAGRは7.9%で成長すると推定されています。
産業界における浄水需要の高まりが中東・アフリカモバイル水処理市場を牽引する
産業界では、希釈、蒸気発生、製造装置の洗浄や冷却など、さまざまな用途に清浄な水が使用されています。このため、発電、製造、飲食品、農業などの分野では、安定した信頼性の高い水の供給に対する需要が高まっています。エネルギー・電力セクターは、水の消費量が最も多いセクターの一つであり、これらのプラントが沿岸部に立地している大きな理由となっています。急速な工業化の進展により、企業はシステムの中断やダウンタイムを避けようとするため、移動式水処理システムの必要性が高まっています。移動式水処理システムは、短期的な水処理需要に対応するため、機器をレンタルすることで現場での作業をサポートします。ネッツォル・ウォーター・ソリューションズは、機動性と対応力を最大限に高めるため、あらかじめパッケージ化されたコンテナで移動式水処理システムを提供しています。同社は、プロセス技術を組み合わせて、さまざまな水処理アプリケーションのニーズを満たすソリューションを提供しています。同様に、WaterStep社は、コンパクトで持続可能、かつ簡単に持ち運びができるポータブル水処理システム(PWTS)を提供しており、クイックコネクトモジュールを装備しています。そのため、産業界における水質浄化の需要の高まりが、中東・アフリカのモバイル水処理市場の成長を促進すると期待されています。
中東・アフリカのモバイル水処理市場の概要
南アフリカ、サウジアラビア、UAEは、中東・アフリカのモバイル水処理市場の主要な貢献国の一つです。政府によるイニシアチブの増加や水処理施設建設への投資の急増が、この地域の市場成長に寄与しています。モバイル処理システムで行われる一次浄水工程には、油水分離、沈殿、砂ろ過が含まれます。さらに、二次的な浄水工程として、膜ろ過(逆浸透膜)、イオン交換による脱塩水があります。これらの工程でオペレーターに発生するコストや、工程で使用する機器の製造に必要な原材料の価格上昇や変動は、特にコストに敏感な新興経済諸国において、移動式水処理市場の成長を制限する要因となっています。しかし、新しい産業インフラの開拓と政府規制の厳格化は、アフリカのモバイル水処理市場のプレーヤーに大きな機会を提供すると思われます。
中東・アフリカモバイル水処理市場の収益と2028年までの予測(金額)
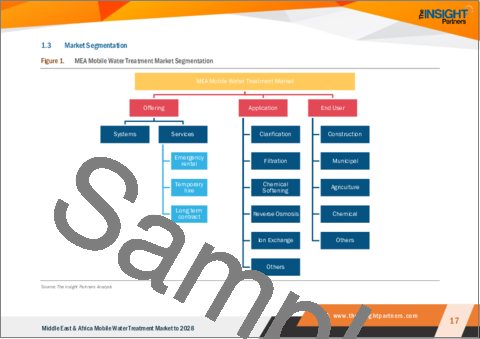
中東・アフリカのモバイル水処理市場のセグメント化
中東・アフリカのモバイル水処理市場は、オファリング、アプリケーション、エンドユーザー、国に区分されます。提供形態に基づき、市場はシステム部門とサービス部門に区分されます。2022年には、サービスセグメントがより大きな市場シェアを登録しました。
アプリケーションに基づいて、中東・アフリカモバイル水処理市場は、清澄化、ろ過、化学軟化、逆浸透、イオン交換、およびその他に分割されます。2022年には、ろ過分野が最大の市場シェアを記録しました。エンドユーザーに基づいて、中東・アフリカモバイル水処理市場は、建設、自治体、農業、化学、およびその他に分割されます。2022年には、その他セグメントが最大の市場シェアを記録しました。国別では、市場は南アフリカ、UAE、サウジアラビア、Rest of 中東・アフリカに区分されます。2022年の市場シェアはサウジアラビアが独占しています。Aquatech International LLC、EMWG Srl、Evoqua Water Technologies Corp.、Filtra-Systems Company LLC、Newater Technology Co.、Pall Corporation、Veolia Environnement SAは、中東・アフリカモバイル水処理市場で活動している主要企業です。
目次
第1章 イントロダクション
第2章 重要なポイント
第3章 調査手法
- カバレッジ
- 2次調査
- 1次調査
第4章 中東・アフリカのモバイル水処理市場の展望
- 市場概要
- 中東・アフリカのPEST分析
- エコシステム分析
- 専門家の見解
第5章 中東・アフリカのモバイル水処理市場:主要市場力学
- 市場促進要因
- 産業界における水質浄化の需要増加
- 廃水処理に関する政府の厳しい規制
- 主な市場抑制要因
- 高い設置・運用コスト
- 今後の動向
- トラック搭載型移動式水処理装置
- 促進要因と阻害要因の影響分析
第6章 移動式水処理-中東・アフリカ市場分析
- 中東・アフリカの移動式水処理市場収益と予測・分析
第7章 中東・アフリカの移動式水処理市場:オファリング別
- 中東・アフリカのモバイル水処理市場:オファリング別(2020年、2028年)
- システム
- サービス
第8章 中東・アフリカのモバイル水処理市場:アプリケーション別
- 中東・アフリカのモバイル水処理市場:アプリケーション別(2020年、2028年)
- 清澄化
- 濾過
- 化学的軟化
- 逆浸透膜
- イオン交換
- その他
第9章 中東・アフリカのモバイル水処理市場:エンドユーザー別
- 中東・アフリカのモバイル水処理市場:エンドユーザー別(2020年、2028年)
- 建設業
- 自治体
- 農業分野
- 化学
- その他
第10章 中東・アフリカのモバイル水処理市場:国別分析
- 中東・アフリカ
- 南アフリカ
- サウジアラビア
- UAE
- 中東・アフリカの残りの地域
第11章 業界情勢
- M&A(合併・買収)
- ジョイントベンチャー
第12章 企業企業プロファイル
- Newater Technology Co.
- Pall Corporation
- Evoqua Water Technologies Corp.
- Aquatech International LLC
- Filtra-Systems Company LLC
- EMWG Srl
- Veolia Environnement SA
第13章 付録
List Of Tables
- Table 1. MEA Mobile Water Treatment Market Revenue and Forecast to 2028 (US$ Million)
- Table 2. MEA: Mobile Water Treatment Market, By Country - Revenue and Forecast to 2028 (US$ Million)
- Table 3. South Africa: Mobile Water Treatment Market, By Offering - Revenue and Forecast to 2028 (US$ Million)
- Table 4. South Africa: Mobile Water Treatment Market, By Services - Revenue and Forecast to 2028 (US$ Million)
- Table 5. South Africa: Mobile Water Treatment Market, By Application - Revenue and Forecast to 2028 (US$ Million)
- Table 6. South Africa: Mobile Water Treatment Market, By End User - Revenue and Forecast to 2028 (US$ Million)
- Table 7. Saudi Arabia: Mobile Water Treatment Market, By Offering - Revenue and Forecast to 2028 (US$ Million)
- Table 8. Saudi Arabia: Mobile Water Treatment Market, By Services - Revenue and Forecast to 2028 (US$ Million)
- Table 9. Saudi Arabia: Mobile Water Treatment Market, By Application - Revenue and Forecast to 2028 (US$ Million)
- Table 10. Saudi Arabia: Mobile Water Treatment Market, By End User - Revenue and Forecast to 2028 (US$ Million)
- Table 11. UAE: Mobile Water Treatment Market, By Offering - Revenue and Forecast to 2028 (US$ Million)
- Table 12. UAE: Mobile Water Treatment Market, By Services - Revenue and Forecast to 2028 (US$ Million)
- Table 13. UAE: Mobile Water Treatment Market, By Application - Revenue and Forecast to 2028 (US$ Million)
- Table 14. UAE: Mobile Water Treatment Market, By End User - Revenue and Forecast to 2028 (US$ Million)
- Table 15. Rest of MEA: Mobile Water Treatment Market, By Offering - Revenue and Forecast to 2028 (US$ Million)
- Table 16. Rest of MEA: Mobile Water Treatment Market, By Services - Revenue and Forecast to 2028 (US$ Million)
- Table 17. Rest of MEA: Mobile Water Treatment Market, By Application - Revenue and Forecast to 2028 (US$ Million)
- Table 18. Rest of MEA: Mobile Water Treatment Market, By End User - Revenue and Forecast to 2028 (US$ Million)
- Table 19. List of Abbreviation
List Of Figures
- Figure 1. MEA Mobile Water Treatment Market Segmentation
- Figure 2. MEA Mobile Water Treatment Market Segmentation - By Country
- Figure 3. MEA Mobile Water Treatment Market Overview
- Figure 4. MEA Mobile Water Treatment Market, By Offering
- Figure 5. MEA Mobile Water Treatment Market, By Country
- Figure 6. Middle East and Africa - PEST Analysis
- Figure 7. Mobile Water Treatment Market- Ecosystem Analysis
- Figure 8. MEA Mobile water treatment Market Impact Analysis of Drivers and Restraints
- Figure 9. MEA Mobile Water Treatment Market Revenue Forecast and Analysis (US$ Million)
- Figure 10. MEA Mobile Water Treatment Market Revenue Share, by Offering (2020 and 2028)
- Figure 11. Systems: MEA Mobile Water Treatment Market - Revenue and Forecast to 2028 (US$ Million)
- Figure 12. Services: MEA Mobile Water Treatment Market - Revenue and Forecast to 2028 (US$ Million)
- Figure 13. Emergency Rental: MEA Mobile Water Treatment Market - Revenue and Forecast to 2028 (US$ Million)
- Figure 14. Temporary Hire: MEA Mobile Water Treatment Market - Revenue and Forecast to 2028 (US$ Million)
- Figure 15. Long Term Contract: MEA Mobile Water Treatment Market - Revenue and Forecast to 2028 (US$ Million)
- Figure 16. MEA Mobile Water Treatment Market Revenue Share, by Application (2020 and 2028)
- Figure 17. Clarification: MEA Mobile Water Treatment Market - Revenue and Forecast to 2028 (US$ Million)
- Figure 18. Filtration: MEA Mobile Water Treatment Market - Revenue and Forecast to 2028 (US$ Million)
- Figure 19. Chemical Softening: MEA Mobile Water Treatment Market - Revenue and Forecast to 2028 (US$ Million)
- Figure 20. Reverse Osmosis: MEA Mobile Water Treatment Market - Revenue and Forecast to 2028 (US$ Million)
- Figure 21. Ion Exchange: MEA Mobile Water Treatment Market - Revenue and Forecast to 2028 (US$ Million)
- Figure 22. Others: MEA Mobile Water Treatment Market - Revenue and Forecast to 2028 (US$ Million)
- Figure 23. MEA Mobile Water Treatment Market Revenue Share, by End User (2020 and 2028)
- Figure 24. Construction: MEA Mobile Water Treatment Market - Revenue and Forecast to 2028 (US$ Million)
- Figure 25. Municipal: MEA Mobile Water Treatment Market - Revenue and Forecast to 2028 (US$ Million)
- Figure 26. Agriculture: MEA Mobile Water Treatment Market - Revenue and Forecast to 2028 (US$ Million)
- Figure 27. Chemical: MEA Mobile Water Treatment Market - Revenue and Forecast to 2028 (US$ Million)
- Figure 28. Others: MEA Mobile Water Treatment Market - Revenue and Forecast to 2028 (US$ Million)
- Figure 29. MEA: Mobile Water Treatment Market, by Key Country - Revenue (2021) (US$ Million)
- Figure 30. MEA: Mobile Water Treatment Market Revenue Share, by Key Country (2021 & 2028)
- Figure 31. South Africa: Mobile Water Treatment Market - Revenue and Forecast to 2028 (US$ Million)
- Figure 32. Saudi Arabia: Mobile Water Treatment Market - Revenue and Forecast to 2028 (US$ Million)
- Figure 33. UAE: Mobile Water Treatment Market - Revenue and Forecast to 2028 (US$ Million)
- Figure 34. Rest of MEA: Mobile Water Treatment Market - Revenue and Forecast to 2028 (US$ Million)
The MEA mobile water treatment market is expected to grow from US$ 182.20 million in 2022 to US$ 288.22 million by 2028. It is estimated to grow at a CAGR of 7.9% from 2022 to 2028.
Increasing Demand for Water Purification in Industries is Driving MEA Mobile Water Treatment Market
In industries, clean water is used for a range of applications, including dilution, steam generation, and manufacturing equipment washing and cooling. This has increased the demand for a consistent and reliable water supply in sectors such as power generation, manufacturing, food & beverages, and agriculture. The energy & power sector is one of the largest consumers of water, which is a major reason why these plants are located on the coast. Rapid industrialization encourages companies to avoid any disruptions and system downtime, thereby increasing the need for mobile water treatment systems. Mobile water treatment systems support on-site operations by providing equipment on a rental basis to cater to the short-term water treatment demand. Netsol Water Solutions provides mobile water treatment systems in prepackaged containers for maximum mobility and response. The company combines process technologies to produce a solution that satisfies the needs of a wide range of water treatment applications. Similarly, WaterStep offers a compact, sustainable, and easily transportable portable water treatment system (PWTS) that is equipped with quick-connect modules. So, increasing demand for water purification in industries is expected to drive the MEA mobile water treatment market growth.
MEA Mobile Water Treatment Market Overview
South Africa, Saudi Arabia, and UAE are among the prime contributors to the MEA mobile water treatment market. The increasing number of initiatives taken by governments and a surge in investments in the construction of water treatment facilities are contributing to the market growth in the region. Primary water purification steps performed in the mobile treatment systems include oil/water separation, sedimentation, and sand filtration. Further, the secondary water purification steps are membrane filtration (reverse osmosis) and ion exchange for demi-water production. Costs incurred by these steps to operators and the rising or fluctuating prices of raw materials required for the manufacturing of equipment used in these steps are the factors limiting the growth of the mobile water treatment market, especially in cost-sensitive, developing or underdeveloped economies. However, the development of new industrial infrastructure and stringency of government regulations are likely to provide significant opportunities to the mobile water treatment market players in Africa.
MEA Mobile Water Treatment Market Revenue and Forecast to 2028 (US$ Million)
MEA Mobile Water Treatment Market Segmentation
The MEA mobile water treatment market is segmented into offering, application, end user, and country. Based on offering, the market is segmented into systems and services segment. The services segment registered a larger market share in 2022.
Based on application, the MEA mobile water treatment market is segmented into clarification, filtration, chemical softening, reverse osmosis, ion exchange, and others. The filtration segment registered the largest market share in 2022. Based on end user, the MEA mobile water treatment market is segmented into construction, municipal, agriculture, chemical, and others. The others segment registered the largest market share in 2022. Based on country, the market is segmented into South Africa, the UAE, Saudi Arabia, and the Rest of MEA. Saudi Arabia dominated the market share in 2022. Aquatech International LLC; EMWG Srl; Evoqua Water Technologies Corp.; Filtra-Systems Company LLC; Newater Technology Co.; Pall Corporation; and Veolia Environnement SA are the leading companies operating in the MEA mobile water treatment market.
Reasons to Buy:
- Save and reduce time carrying out entry-level research by identifying the growth, size, leading players, and segments in the MEA mobile water treatment market.
- Highlights key business priorities in order to assist companies to realign their business strategies
- The key findings and recommendations highlight crucial progressive industry trends in the MEA mobile water treatment market, thereby allowing players across the value chain to develop effective long-term strategies
- Develop/modify business expansion plans by using substantial growth offering developed and emerging markets
- Scrutinize in-depth MEA market trends and outlook coupled with the factors driving the mobile water treatment market, as well as those hindering it
- Enhance the decision-making process by understanding the strategies that underpin commercial interest with respect to client products, segmentation, pricing, and distribution
Table Of Contents
1. Introduction
- 1.1 Study Scope
- 1.2 The Insight Partners Research Report Guidance
- 1.3 Market Segmentation
2. Key Takeaways
3. Research Methodology
- 3.1 Coverage
- 3.2 Secondary Research
- 3.3 Primary Research
4. MEA Mobile Water Treatment Market Landscape
- 4.1 Market Overview
- 4.2 MEA PEST Analysis
- 4.3 Ecosystem Analysis
- 4.4 Expert Opinions
5. MEA Mobile Water Treatment Market - Key Market Dynamics
- 5.1 Market Drivers
- 5.1.1 Increasing Demand for Water Purification in Industries
- 5.1.2 Stringent Government Regulations on Wastewater Treatment
- 5.2 Key Market Restraints
- 5.2.1 High Installation and Operational Cost
- 5.3 Future Trends
- 5.3.1 Truck-Mounted Mobile Water Treatment Plants
- 5.4 Impact Analysis of Drivers And Restraints
6. Mobile Water Treatment - MEA Market Analysis
- 6.1 MEA Mobile Water Treatment Market Revenue Forecast and Analysis
7. MEA Mobile Water Treatment Market - By Offering
- 7.1 Overview
- 7.2 MEA Mobile Water Treatment Market, By Offering (2020 and 2028)
- 7.3 Systems
- 7.3.1 Overview
- 7.3.2 Systems: Mobile Water Treatment Market - Revenue and Forecast to 2028 (US$ Million)
- 7.4 Services
- 7.4.1 Overview
- 7.4.2 Services: Mobile Water Treatment Market - Revenue and Forecast to 2028 (US$ Million)
- 7.4.2.1 Emergency Rental
- 7.4.2.1.1 Overview
- 7.4.2.1.2 Emergency Rental: Mobile Water Treatment Market - Revenue and Forecast to 2028 (US$ Million)
- 7.4.2.2 Temporary Hire
- 7.4.2.2.1 Overview
- 7.4.2.2.2 Temporary Hire: Mobile Water Treatment Market - Revenue and Forecast to 2028 (US$ Million)
- 7.4.2.3 Long Term Contract
- 7.4.2.3.1 Overview
- 7.4.2.3.2 Long Term Contract: Mobile Water Treatment Market - Revenue and Forecast to 2028 (US$ Million)
- 7.4.2.1 Emergency Rental
8. MEA Mobile Water Treatment Market - By Application
- 8.1 Overview
- 8.2 MEA Mobile Water Treatment Market, By Application (2020 and 2028)
- 8.3 Clarification
- 8.3.1 Overview
- 8.3.2 Clarification: Mobile Water Treatment Market - Revenue and Forecast to 2028 (US$ Million)
- 8.4 Filtration
- 8.4.1 Overview
- 8.4.2 Filtration: Mobile Water Treatment Market - Revenue and Forecast to 2028 (US$ Million)
- 8.5 Chemical Softening
- 8.5.1 Overview
- 8.5.2 Chemical Softening: Mobile Water Treatment Market - Revenue and Forecast to 2028 (US$ Million)
- 8.6 Reverse Osmosis
- 8.6.1 Overview
- 8.6.2 Reverse Osmosis: Mobile Water Treatment Market - Revenue and Forecast to 2028 (US$ Million)
- 8.7 Ion Exchange
- 8.7.1 Overview
- 8.7.2 Ion Exchange: Mobile Water Treatment Market - Revenue and Forecast to 2028 (US$ Million)
- 8.8 Others
- 8.8.1 Overview
- 8.8.2 Others: Mobile Water Treatment Market - Revenue and Forecast to 2028 (US$ Million)
9. MEA Mobile Water Treatment Market - By End User
- 9.1 Overview
- 9.2 MEA Mobile Water Treatment Market, By End User (2020 and 2028)
- 9.3 Construction
- 9.3.1 Overview
- 9.3.2 Construction: Mobile Water Treatment Market - Revenue and Forecast to 2028 (US$ Million)
- 9.4 Municipal
- 9.4.1 Overview
- 9.4.2 Municipal: Mobile Water Treatment Market - Revenue and Forecast to 2028 (US$ Million)
- 9.5 Agriculture
- 9.5.1 Overview
- 9.5.2 Agriculture: Mobile Water Treatment Market - Revenue and Forecast to 2028 (US$ Million)
- 9.6 Chemical
- 9.6.1 Overview
- 9.6.2 Chemical: Mobile Water Treatment Market - Revenue and Forecast to 2028 (US$ Million)
- 9.7 Others
- 9.7.1 Overview
- 9.7.2 Others: Mobile Water Treatment Market - Revenue and Forecast to 2028 (US$ Million)
10. MEA Mobile Water Treatment Market - Country Analysis
- 10.1 Overview
- 10.1.1 MEA: Mobile Water Treatment Market, By Key Country
- 10.1.1.1 South Africa: Mobile Water Treatment Market - Revenue and Forecast to 2028 (US$ Million)
- 10.1.1.1.1 South Africa: Mobile Water Treatment Market, By Offering
- 10.1.1.1.1.1 South Africa: Mobile Water Treatment Market, By Services
- 10.1.1.1.2 South Africa: Mobile Water Treatment Market, By End User
- 10.1.1.2 Saudi Arabia: Mobile Water Treatment Market - Revenue and Forecast to 2028 (US$ Million)
- 10.1.1.2.1 Saudi Arabia: Mobile Water Treatment Market, By Offering
- 10.1.1.2.1.1 Saudi Arabia: Mobile Water Treatment Market, By Services
- 10.1.1.2.2 Saudi Arabia: Mobile Water Treatment Market, By Application
- 10.1.1.2.3 Saudi Arabia: Mobile Water Treatment Market, By End User
- 10.1.1.3 UAE: Mobile Water Treatment Market - Revenue and Forecast to 2028 (US$ Million)
- 10.1.1.3.1 UAE: Mobile Water Treatment Market, By Offering
- 10.1.1.3.1.1 UAE: Mobile Water Treatment Market, By Services
- 10.1.1.3.2 UAE: Mobile Water Treatment Market, By Application
- 10.1.1.3.3 UAE: Mobile Water Treatment Market, By End User
- 10.1.1.4 Rest of MEA: Mobile Water Treatment Market - Revenue and Forecast to 2028 (US$ Million)
- 10.1.1.4.1 Rest of MEA: Mobile Water Treatment Market, By Offering
- 10.1.1.4.1.1 Rest of MEA: Mobile Water Treatment Market, By Services
- 10.1.1.4.2 Rest of MEA: Mobile Water Treatment Market, By Application
- 10.1.1.4.3 Rest of MEA: Mobile Water Treatment Market, By End User
- 10.1.1.1 South Africa: Mobile Water Treatment Market - Revenue and Forecast to 2028 (US$ Million)
- 10.1.1 MEA: Mobile Water Treatment Market, By Key Country
11. Industry Landscape
- 11.1 Merger and Acquisitions
- 11.2 Joint Venture
12. Company Profiles
- 12.1 Newater Technology Co.
- 12.1.1 Key Facts
- 12.1.2 Business Description
- 12.1.3 Products and Services
- 12.1.4 Financial Overview
- 12.1.5 SWOT Analysis
- 12.1.6 Key Developments
- 12.2 Pall Corporation
- 12.2.1 Key Facts
- 12.2.2 Business Description
- 12.2.3 Products and Services
- 12.2.4 Financial Overview
- 12.2.5 SWOT Analysis
- 12.2.6 Key Developments
- 12.3 Evoqua Water Technologies Corp.
- 12.3.1 Key Facts
- 12.3.2 Business Description
- 12.3.3 Products and Services
- 12.3.4 Financial Overview
- 12.3.5 SWOT Analysis
- 12.3.6 Key Developments
- 12.4 Aquatech International LLC
- 12.4.1 Key Facts
- 12.4.2 Business Description
- 12.4.3 Products and Services
- 12.4.4 Financial Overview
- 12.4.5 SWOT Analysis
- 12.4.6 Key Developments
- 12.5 Filtra-Systems Company LLC
- 12.5.1 Key Facts
- 12.5.2 Business Description
- 12.5.3 Products and Services
- 12.5.4 Financial Overview
- 12.5.5 SWOT Analysis
- 12.5.6 Key Developments
- 12.6 EMWG Srl
- 12.6.1 Key Facts
- 12.6.2 Business Description
- 12.6.3 Products and Services
- 12.6.4 Financial Overview
- 12.6.5 SWOT Analysis
- 12.6.6 Key Developments
- 12.7 Veolia Environnement SA
- 12.7.1 Key Facts
- 12.7.2 Business Description
- 12.7.3 Products and Services
- 12.7.4 Financial Overview
- 12.7.5 SWOT Analysis
- 12.7.6 Key Developments
13. Appendix
- 13.1 About The Insight Partners
- 13.2 Word Index