|
|
市場調査レポート
商品コード
1141925
スマートマニュファクチャリング市場の2028年までの予測-エンドユーザー(ディスクリート産業と製造プロセス産業)およびコンポーネント(ハードウェアとソフトウェア)別の世界分析Smart Manufacturing Market Forecast to 2028 - COVID-19 Impact and Global Analysis By End User (Discrete Industry and Process Industry) and Component (Hardware and Software) |
||||||
|
|
|||||||


| スマートマニュファクチャリング市場の2028年までの予測-エンドユーザー(ディスクリート産業と製造プロセス産業)およびコンポーネント(ハードウェアとソフトウェア)別の世界分析 |
|
出版日: 2022年10月06日
発行: The Insight Partners
ページ情報: 英文 258 Pages
納期: 即納可能
|
- 全表示
- 概要
- 図表
- 目次
スマートマニュファクチャリング市場は、2022年の2587億2000万米ドルから2028年には3652億2000万米ドルに成長すると予測されており、2022年から2028年までのCAGRは6.0%と推定されています。
製造プロセスにおける生産性の向上と可視性の強化が常に求められていることから、製造業におけるデジタル化の導入が進んでいます。さまざまな領域でイノベーションと効率化を組み合わせることに注目が集まり、データ分析、予知保全、産業用ネットワーキングにおける主要な技術的進歩が、スマートマニュファクチャリング市場の成長を押し上げています。また、リアルタイムな情報を提供するために、単一のプラットフォーム上で統合・合理化されたソフトウェアシステムに対する需要の高まりも、市場の成長を後押ししています。さらに、インダストリー4.0は、レガシーシステムからスマートコンポーネントへの産業の転換を後押ししています。資産効率、コスト削減、品質、持続可能性などのメリットを提供する自動車部門が急成長しており、スマートファクトリー・ソリューションの成長を後押ししています。スマートファクトリーへの投資は、収益性の向上や市場投入期間の短縮など、自動車メーカーに競争上の優位性をもたらすでしょう。また、スマートマニュファクチャリングリーダーシップ連合(SMLC)やインダストリアルインターネットコンソーシアム(IIC)など、産業界の自動化を促進するための政府によるさまざまなスマートマニュファクチャリングの取り組みも、スマートマニュファクチャリング市場の成長を後押ししています。
世界のスマートマニュファクチャリング市場において、北米は大きなシェアを占めています。IoTやクラウドプラットフォームを含む産業用オートメーションソリューションの採用拡大、規制遵守の重視の高まり、時間とコストを削減するソフトウェアシステムに対する需要の増加は、この地域の市場成長を推進する主要な力のいくつかです。米国、カナダ、メキシコのメーカーは、エンタープライズサービスバス(ESB)、製造サービスバス(MSB)、アプリケーションプログラミングインターフェース(API)マネージャーなどのエンタープライズ統合プラットフォームを導入し、データの受信、分析、集約を行うとともに、プロセス制御のトリガーや企業およびバリューチェーンのシステム全体のビジネスプロセスの最適化を行っています。
欧州連合では、3Dフードプリンティングやマシンビジョンなどの技術が急速に採用され、設計の柔軟性を高めるための自動化技術への高い投資、革新的な統合安全ソリューション、高度なソフトウェアツールが、ドイツ、フランス、英国などの欧州諸国におけるスマートマニュファクチャリング市場の成長を後押ししています。これらの国々の自動車、航空宇宙・防衛、飲食品、半導体・電子産業のメーカーは、軽量でコスト効率の高い製品を製造するために、3Dプリント技術の採用を増やしています。Hadoop、R、Storm、ストリーミング解析などのビッグデータ処理機能の台頭により、サプライチェーンの運用の可視化、分析、診断がサポートされます。産業機器へのビッグデータ解析の統合により、市場参加者はその寿命、能力変動、需要パターンを分析できるようになり、スマートマニュファクチャリングソリューションの採用をさらに後押ししています。
APACのスマートマニュファクチャリング市場は、予測期間中に最も高いCAGRで成長すると予想されます。この地域の国々は、"Make in India"や"Made in China 2025"などのイニシアティブにより、社内製造施設の自動化に注力しています。メーカーは、他のプレイヤーに対する競争力を獲得し、職場の安全性を向上させ、オペレーションコストを削減するために、サプライチェーンの合理化を進めています。中国は主要な製造拠点であり、国内の産業部門は急速な変革期を迎えています。中国は、デジタルインフラ公共支出プログラムに1兆4,000億米ドルを費やすと予想されています。同国の製造業は、製造プロセスを最適化するために、インダストリー4.0やインダストリアルIoT(IIoT)など、さまざまなスマートマニュファクチャリングアプローチを導入しています。
スマートマニュファクチャリング市場は、エンドユーザーとコンポーネントに基づき二分されます。エンドユーザーに基づいて、スマートマニュファクチャリング市場はディスクリート産業とプロセス産業に分けられます。2020年にはディスクリート産業分野がより大きな市場シェアを占めました。医療機器、防衛機器、半導体、自動車、機械などの生産量増加により、先進技術の採用が進んでいるコンポーネントに基づき、スマートマニュファクチャリング市場は、ハードウェアとソフトウェアに二分されます。ハードウェアセグメントがより大きなシェアを占めています。このセグメントの成長は、RTL、ロボット、センサーの統合と実装が製造工場で拡大していることに起因しています。地域別に見ると、スマートマニュファクチャリング市場は、北米(米国、カナダ、メキシコ)、欧州(オーストリア、イタリア、ポーランド、スイス、スウェーデン、ノルウェー、韓国、台湾、オランダ、フィンランド、スペイン、バルト諸国、その他の欧州地域)、アジア太平洋(オーストラリア、日本、韓国、台湾、その他のAPAC)に区分されます。
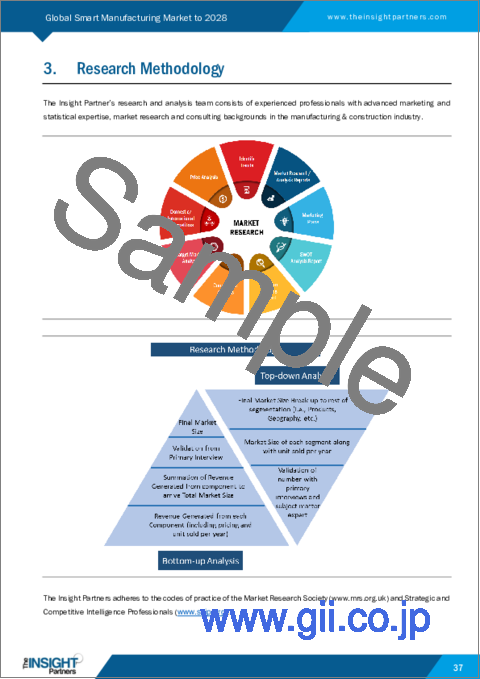
スマート製造の全体的な市場規模は、一次情報と二次情報の両方を用いて導き出されています。スマート製造市場に関連する質的・量的情報を得るために、内外の情報源を用いて網羅的な二次調査を実施しました。このプロセスでは、すべてのセグメントに関するスマート製造市場の概要と予測も得ています。また、データを検証し、より分析的な洞察を得るために、業界関係者に複数の一次インタビューを実施しました。このプロセスの参加企業には、副社長、事業開発マネージャー、市場情報マネージャー、国内営業マネージャーなどの業界専門家や、スマート製造市場を専門とする外部コンサルタント(評価専門家、研究アナリスト、キーオピニオンリーダー)などが含まれます。
目次
第1章 イントロダクション
- 調査範囲
- インサイトパートナーズの調査報告書ガイダンス
- 市場セグメンテーション
第2章 重要なポイント
第3章 調査手法
- 対象範囲
- 2次調査
- 1次調査
第4章 スマートマニュファクチャリング市場の情勢
- 市場概要
- PEST分析
- 北米
- 欧州
- アジア太平洋地域
- 中東・アフリカ
- 南米
- エコシステム分析
- 専門家の見解
第5章 スマートマニュファクチャリング市場- 主な市場力学
- 市場促進要因
- スマートマシンビジョンシステムに対する需要の高まり
- 巨大な産業部門と先進技術の実装を持つ国
- 市場抑制要因
- データセキュリティのリスクと互換性の問題
- 市場機会
- RTLSの採用が急増している
- 今後の動向
- 自動化におけるロボティクスの利用拡大
- スマートファクトリー化
- 促進要因と阻害要因のインパクト分析
第6章 スマートマニュファクチャリング市場- 世界分析
- スマートマニュファクチャリング市場の概要
- 市場のポジショニング-主要5社
第7章 スマートマニュファクチャリング市場分析-エンドユーザー別
- スマートマニュファクチャリング市場内訳、エンドユーザー別(2020年、2028年)
- ディスクリート産業
- プロセス産業
第8章 スマートマニュファクチャリング市場の分析- コンポーネント別
- スマートマニュファクチャリング市場の内訳、コンポーネント別(2020年、2028年)
- ハードウェア
- ソフトウェア
第9章 スマートマニュファクチャリング市場- 地域別分析
- 北米
- 米国
- カナダ
- メキシコ
- 欧州
- フランス
- ドイツ
- イタリア
- 英国
- ロシア
- その他欧州
- APAC
- オーストラリア
- 中国
- インド
- 日本
- 韓国
- APACのその他諸国
- MEA
- サウジアラビア
- UAE
- 南アフリカ
- MEAの残りの地域
- 南米
- ブラジル
- アルゼンチン
- その他の南米地域
第10章 スマートマニュファクチャリング市場-COVID-19影響度分析
- 北米
- 欧州
- アジア太平洋地域
- MEA
- SAM
第11章 業界情勢
- 市場への取り組み
- 新製品開発
- 合併・買収
第12章 企業プロファイル
- Yokogawa Electric Corporation
- Cisco Systems, Inc.
- Honeywell International Inc.
- 3D Systems, Inc.
- Daifuku Co., Ltd.
- GENERAL ELECTRIC
- IBM Corporation
- Oracle Corporation
- Siemens AG
- Schneider Electric SE
第13章 付録
- インサイト・パートナーズについて
- 単語索引
List Of Tables
- Table 1. Smart Manufacturing Market - Revenue and Forecast to 2028 (US$ Billion)
- Table 2. North America: Smart Manufacturing Market, by End User - Revenue and Forecast to 2028 (US$ Million)
- Table 3. North America: Smart Manufacturing Market, by Discrete Industry - Revenue and Forecast to 2028 (US$ Million)
- Table 4. North America: Smart Manufacturing Market, by Process Industry - Revenue and Forecast to 2028 (US$ Million)
- Table 5. North America: Smart Manufacturing Market, by Component - Revenue and Forecast to 2028 (US$ Million)
- Table 6. North America: Smart Manufacturing Market, by Hardware - Revenue and Forecast to 2028 (US$ Million)
- Table 7. North America: Smart Manufacturing Market, by Software - Revenue and Forecast to 2028 (US$ Million)
- Table 8. US: Smart Manufacturing Market, by End User - Revenue and Forecast to 2028 (US$ Million)
- Table 9. US: Smart Manufacturing Market, By Discrete Industry- Revenue and Forecast to 2028 (US$ Million)
- Table 10. US: Smart Manufacturing Market, By Process Industry- Revenue and Forecast to 2028 (US$ Million)
- Table 11. US: Smart Manufacturing Market, by Component - Revenue and Forecast to 2028 (US$ Million)
- Table 12. North America: Smart Manufacturing Market, by Hardware - Revenue and Forecast to 2028 (US$ Million)
- Table 13. North America: Smart Manufacturing Market, by Software - Revenue and Forecast to 2028 (US$ Million)
- Table 14. Canada: Smart Manufacturing Market, by End User - Revenue and Forecast to 2028 (US$ Million)
- Table 15. Canada: Smart Manufacturing Market, By Discrete Industry- Revenue and Forecast to 2028 (US$ Million)
- Table 16. Canada: Smart Manufacturing Market, By Process Industry- Revenue and Forecast to 2028 (US$ Million)
- Table 17. Canada: Smart Manufacturing Market, by Component - Revenue and Forecast to 2028 (US$ Million)
- Table 18. Canada: Smart Manufacturing Market, by Hardware - Revenue and Forecast to 2028 (US$ Million)
- Table 19. Canada: Smart Manufacturing Market, by Software - Revenue and Forecast to 2028 (US$ Million)
- Table 20. Mexico: Smart Manufacturing Market, by End User - Revenue and Forecast to 2028 (US$ Million)
- Table 21. Mexico: Smart Manufacturing Market, By Discrete Industry- Revenue and Forecast to 2028 (US$ Million)
- Table 22. Mexico: Smart Manufacturing Market, By Process Industry- Revenue and Forecast to 2028 (US$ Million)
- Table 23. Mexico: Smart Manufacturing Market, by Component - Revenue and Forecast to 2028 (US$ Million)
- Table 24. Mexico: Smart Manufacturing Market, by Hardware - Revenue and Forecast to 2028 (US$ Million)
- Table 25. Mexico: Smart Manufacturing Market, by Software - Revenue and Forecast to 2028 (US$ Million)
- Table 26. Europe: Smart Manufacturing Market, by End User - Revenue and Forecast to 2028 (US$ Million)
- Table 27. Europe: Smart Manufacturing Market, By Discrete Industry- Revenue and Forecast to 2028 (US$ Million)
- Table 28. Europe: Smart Manufacturing Market, By Process Industry- Revenue and Forecast to 2028 (US$ Million)
- Table 29. Europe: Smart Manufacturing Market, by Component - Revenue and Forecast to 2028 (US$ Million)
- Table 30. Europe: Smart Manufacturing Market, by Hardware - Revenue and Forecast to 2028 (US$ Million)
- Table 31. Europe: Smart Manufacturing Market, by Software - Revenue and Forecast to 2028 (US$ Million)
- Table 32. France: Smart Manufacturing Market, by End User - Revenue and Forecast to 2028 (US$ Million)
- Table 33. France: Smart Manufacturing Market, By Discrete Industry- Revenue and Forecast to 2028 (US$ Million)
- Table 34. France: Smart Manufacturing Market, By Process Industry- Revenue and Forecast to 2028 (US$ Million)
- Table 35. France: Smart Manufacturing Market, by Component - Revenue and Forecast to 2028 (US$ Million)
- Table 36. France: Smart Manufacturing Market, by Hardware - Revenue and Forecast to 2028 (US$ Million)
- Table 37. France: Smart Manufacturing Market, by Software - Revenue and Forecast to 2028 (US$ Million)
- Table 38. Germany: Smart Manufacturing Market, by End User - Revenue and Forecast to 2028 (US$ Million)
- Table 39. Germany: Smart Manufacturing Market, By Discrete Industry- Revenue and Forecast to 2028 (US$ Million)
- Table 40. Germany: Smart Manufacturing Market, By Process Industry- Revenue and Forecast to 2028 (US$ Million)
- Table 41. Germany: Smart Manufacturing Market, by Component - Revenue and Forecast to 2028 (US$ Million)
- Table 42. Germany: Smart Manufacturing Market, by Hardware - Revenue and Forecast to 2028 (US$ Million)
- Table 43. Germany: Smart Manufacturing Market, by Software - Revenue and Forecast to 2028 (US$ Million)
- Table 44. Italy: Smart Manufacturing Market, by End User - Revenue and Forecast to 2028 (US$ Million)
- Table 45. Italy: Smart Manufacturing Market, By Discrete Industry- Revenue and Forecast to 2028 (US$ Million)
- Table 46. Italy: Smart Manufacturing Market, By Process Industry- Revenue and Forecast to 2028 (US$ Million)
- Table 47. Italy: Smart Manufacturing Market, by Component - Revenue and Forecast to 2028 (US$ Million)
- Table 48. Italy: Smart Manufacturing Market, by Hardware - Revenue and Forecast to 2028 (US$ Million)
- Table 49. Italy: Smart Manufacturing Market, by Software - Revenue and Forecast to 2028 (US$ Million)
- Table 50. UK: Smart Manufacturing Market, by End User - Revenue and Forecast to 2028 (US$ Million)
- Table 51. UK: Smart Manufacturing Market, By Discrete Industry- Revenue and Forecast to 2028 (US$ Million)
- Table 52. UK: Smart Manufacturing Market, By Process Industry- Revenue and Forecast to 2028 (US$ Million)
- Table 53. UK: Smart Manufacturing Market, by Component - Revenue and Forecast to 2028 (US$ Million)
- Table 54. UK: Smart Manufacturing Market, by Hardware - Revenue and Forecast to 2028 (US$ Million)
- Table 55. UK: Smart Manufacturing Market, by Software - Revenue and Forecast to 2028 (US$ Million)
- Table 56. Russia: Smart Manufacturing Market, by End User - Revenue and Forecast to 2028 (US$ Million)
- Table 57. Russia: Smart Manufacturing Market, By Discrete Industry- Revenue and Forecast to 2028 (US$ Million)
- Table 58. Russia: Smart Manufacturing Market, By Process Industry- Revenue and Forecast to 2028 (US$ Million)
- Table 59. Russia: Smart Manufacturing Market, by Component - Revenue and Forecast to 2028 (US$ Million)
- Table 60. Russia: Smart Manufacturing Market, by Hardware - Revenue and Forecast to 2028 (US$ Million)
- Table 61. Russia: Smart Manufacturing Market, by Software - Revenue and Forecast to 2028 (US$ Million)
- Table 62. Rest of Europe: Smart Manufacturing Market, by End User - Revenue and Forecast to 2028 (US$ Million)
- Table 63. Rest of Europe: Smart Manufacturing Market, By Discrete Industry- Revenue and Forecast to 2028 (US$ Million)
- Table 64. Rest of Europe: Smart Manufacturing Market, By Process Industry- Revenue and Forecast to 2028 (US$ Million)
- Table 65. Rest of Europe: Smart Manufacturing Market, by Component - Revenue and Forecast to 2028 (US$ Million)
- Table 66. Rest of Europe: Smart Manufacturing Market, by Hardware - Revenue and Forecast to 2028 (US$ Million)
- Table 67. Rest of Europe: Smart Manufacturing Market, by Software - Revenue and Forecast to 2028 (US$ Million)
- Table 68. APAC: Smart Manufacturing Market, by End User - Revenue and Forecast to 2028 (US$ Million)
- Table 69. APAC: Smart Manufacturing Market, By Discrete Industry- Revenue and Forecast to 2028 (US$ Million)
- Table 70. APAC: Smart Manufacturing Market, By Process Industry- Revenue and Forecast to 2028 (US$ Million)
- Table 71. APAC: Smart Manufacturing Market, by Component - Revenue and Forecast to 2028 (US$ Million)
- Table 72. APAC: Smart Manufacturing Market, by Hardware - Revenue and Forecast to 2028 (US$ Million)
- Table 73. APAC: Smart Manufacturing Market, by Software - Revenue and Forecast to 2028 (US$ Million)
- Table 74. Australia: Smart Manufacturing Market, by End User - Revenue and Forecast to 2028 (US$ Million)
- Table 75. Australia: Smart Manufacturing Market, By Discrete Industry- Revenue and Forecast to 2028 (US$ Million)
- Table 76. Australia: Smart Manufacturing Market, By Process Industry- Revenue and Forecast to 2028 (US$ Million)
- Table 77. Australia: Smart Manufacturing Market, by Component - Revenue and Forecast to 2028 (US$ Million)
- Table 78. Australia: Smart Manufacturing Market, by Hardware - Revenue and Forecast to 2028 (US$ Million)
- Table 79. Australia: Smart Manufacturing Market, by Software - Revenue and Forecast to 2028 (US$ Million)
- Table 80. China: Smart Manufacturing Market, by End User - Revenue and Forecast to 2028 (US$ Million)
- Table 81. China: Smart Manufacturing Market, By Discrete Industry- Revenue and Forecast to 2028 (US$ Million)
- Table 82. China: Smart Manufacturing Market, By Process Industry- Revenue and Forecast to 2028 (US$ Million)
- Table 83. China: Smart Manufacturing Market, by Component - Revenue and Forecast to 2028 (US$ Million)
- Table 84. China: Smart Manufacturing Market, by Hardware - Revenue and Forecast to 2028 (US$ Million)
- Table 85. China: Smart Manufacturing Market, by Software - Revenue and Forecast to 2028 (US$ Million)
- Table 86. India: Smart Manufacturing Market, by End User - Revenue and Forecast to 2028 (US$ Million)
- Table 87. India: Smart Manufacturing Market, By Discrete Industry- Revenue and Forecast to 2028 (US$ Million)
- Table 88. India: Smart Manufacturing Market, By Process Industry- Revenue and Forecast to 2028 (US$ Million)
- Table 89. India: Smart Manufacturing Market, by Component - Revenue and Forecast to 2028 (US$ Million)
- Table 90. India: Smart Manufacturing Market, by Hardware - Revenue and Forecast to 2028 (US$ Million)
- Table 91. India: Smart Manufacturing Market, by Software - Revenue and Forecast to 2028 (US$ Million)
- Table 92. Japan: Smart Manufacturing Market, by End User - Revenue and Forecast to 2028 (US$ Million)
- Table 93. Japan: Smart Manufacturing Market, By Discrete Industry- Revenue and Forecast to 2028 (US$ Million)
- Table 94. Japan: Smart Manufacturing Market, By Process Industry- Revenue and Forecast to 2028 (US$ Million)
- Table 95. Japan: Smart Manufacturing Market, by Component - Revenue and Forecast to 2028 (US$ Million)
- Table 96. Japan: Smart Manufacturing Market, by Hardware - Revenue and Forecast to 2028 (US$ Million)
- Table 97. Japan: Smart Manufacturing Market, by Software - Revenue and Forecast to 2028 (US$ Million)
- Table 98. South Korea: Smart Manufacturing Market, by End User - Revenue and Forecast to 2028 (US$ Million)
- Table 99. South Korea: Smart Manufacturing Market, By Discrete Industry- Revenue and Forecast to 2028 (US$ Million)
- Table 100. South Korea: Smart Manufacturing Market, By Process Industry- Revenue and Forecast to 2028 (US$ Million)
- Table 101. South Korea: Smart Manufacturing Market, by Component - Revenue and Forecast to 2028 (US$ Million)
- Table 102. South Korea: Smart Manufacturing Market, by Hardware - Revenue and Forecast to 2028 (US$ Million)
- Table 103. South Korea: Smart Manufacturing Market, by Software - Revenue and Forecast to 2028 (US$ Million)
- Table 104. Rest of APAC: Smart Manufacturing Market, by End User - Revenue and Forecast to 2028 (US$ Million)
- Table 105. Rest of APAC: Smart Manufacturing Market, By Discrete Industry- Revenue and Forecast to 2028 (US$ Million)
- Table 106. Rest of APAC: Smart Manufacturing Market, By Process Industry- Revenue and Forecast to 2028 (US$ Million)
- Table 107. Rest of APAC: Smart Manufacturing Market, by Component - Revenue and Forecast to 2028 (US$ Million)
- Table 108. Rest of APAC: Smart Manufacturing Market, by Hardware - Revenue and Forecast to 2028 (US$ Million)
- Table 109. Rest of APAC: Smart Manufacturing Market, by Software - Revenue and Forecast to 2028 (US$ Million)
- Table 110. MEA: Smart Manufacturing Market, by End User - Revenue and Forecast to 2028 (US$ Million)
- Table 111. MEA: Smart Manufacturing Market, By Discrete Industry- Revenue and Forecast to 2028 (US$ Million)
- Table 112. MEA: Smart Manufacturing Market, By Process Industry- Revenue and Forecast to 2028 (US$ Million)
- Table 113. MEA: Smart Manufacturing Market, by Component - Revenue and Forecast to 2028 (US$ Million)
- Table 114. MEA: Smart Manufacturing Market, by Hardware - Revenue and Forecast to 2028 (US$ Million)
- Table 115. MEA: Smart Manufacturing Market, by Software - Revenue and Forecast to 2028 (US$ Million)
- Table 116. Saudi Arabia: Smart Manufacturing Market, by End User - Revenue and Forecast to 2028 (US$ Million)
- Table 117. Saudi Arabia: Smart Manufacturing Market, By Discrete Industry- Revenue and Forecast to 2028 (US$ Million)
- Table 118. Saudi Arabia: Smart Manufacturing Market, By Process Industry- Revenue and Forecast to 2028 (US$ Million)
- Table 119. Saudi Arabia: Smart Manufacturing Market, by Component - Revenue and Forecast to 2028 (US$ Million)
- Table 120. Saudi Arabia: Smart Manufacturing Market, by Hardware - Revenue and Forecast to 2028 (US$ Million)
- Table 121. Saudi Arabia: Smart Manufacturing Market, by Software - Revenue and Forecast to 2028 (US$ Million)
- Table 122. UAE: Smart Manufacturing Market, by End User - Revenue and Forecast to 2028 (US$ Million)
- Table 123. UAE: Smart Manufacturing Market, By Discrete Industry- Revenue and Forecast to 2028 (US$ Million)
- Table 124. UAE: Smart Manufacturing Market, By Process Industry- Revenue and Forecast to 2028 (US$ Million)
- Table 125. UAE: Smart Manufacturing Market, by Component - Revenue and Forecast to 2028 (US$ Million)
- Table 126. UAE: Smart Manufacturing Market, by Hardware - Revenue and Forecast to 2028 (US$ Million)
- Table 127. UAE: Smart Manufacturing Market, by Software - Revenue and Forecast to 2028 (US$ Million)
- Table 128. South Africa: Smart Manufacturing Market, by End User - Revenue and Forecast to 2028 (US$ Million)
- Table 129. South Africa: Smart Manufacturing Market, By Discrete Industry- Revenue and Forecast to 2028 (US$ Million)
- Table 130. South Africa: Smart Manufacturing Market, By Process Industry- Revenue and Forecast to 2028 (US$ Million)
- Table 131. South Africa: Smart Manufacturing Market, by Component - Revenue and Forecast to 2028 (US$ Million)
- Table 132. South Africa: Smart Manufacturing Market, by Hardware - Revenue and Forecast to 2028 (US$ Million)
- Table 133. South Africa: Smart Manufacturing Market, by Software - Revenue and Forecast to 2028 (US$ Million)
- Table 134. Rest of MEA: Smart Manufacturing Market, by End User - Revenue and Forecast to 2028 (US$ Million)
- Table 135. Rest of MEA: Smart Manufacturing Market, By Discrete Industry- Revenue and Forecast to 2028 (US$ Million)
- Table 136. Rest of MEA: Smart Manufacturing Market, By Process Industry- Revenue and Forecast to 2028 (US$ Million)
- Table 137. Rest of MEA: Smart Manufacturing Market, by Component - Revenue and Forecast to 2028 (US$ Million)
- Table 138. Rest of MEA: Smart Manufacturing Market, by Hardware - Revenue and Forecast to 2028 (US$ Million)
- Table 139. Rest of MEA: Smart Manufacturing Market, by Software - Revenue and Forecast to 2028 (US$ Million)
- Table 140. SAM: Smart Manufacturing Market, by End User - Revenue and Forecast to 2028 (US$ Million)
- Table 141. SAM: Smart Manufacturing Market, By Discrete Industry- Revenue and Forecast to 2028 (US$ Million)
- Table 142. SAM: Smart Manufacturing Market, By Process Industry- Revenue and Forecast to 2028 (US$ Million)
- Table 143. SAM: Smart Manufacturing Market, by Component - Revenue and Forecast to 2028 (US$ Million)
- Table 144. SAM: Smart Manufacturing Market, by Hardware - Revenue and Forecast to 2028 (US$ Million)
- Table 145. SAM: Smart Manufacturing Market, by Software - Revenue and Forecast to 2028 (US$ Million)
- Table 146. Brazil: Smart Manufacturing Market, by End User - Revenue and Forecast to 2028 (US$ Million)
- Table 147. Brazil: Smart Manufacturing Market, By Discrete Industry- Revenue and Forecast to 2028 (US$ Million)
- Table 148. Brazil: Smart Manufacturing Market, By Process Industry- Revenue and Forecast to 2028 (US$ Million)
- Table 149. Brazil: Smart Manufacturing Market, by Component - Revenue and Forecast to 2028 (US$ Million)
- Table 150. Brazil: Smart Manufacturing Market, by Hardware - Revenue and Forecast to 2028 (US$ Million)
- Table 151. Brazil: Smart Manufacturing Market, by Software - Revenue and Forecast to 2028 (US$ Million)
- Table 152. Argentina: Smart Manufacturing Market, by End User - Revenue and Forecast to 2028 (US$ Million)
- Table 153. Argentina: Smart Manufacturing Market, By Discrete Industry- Revenue and Forecast to 2028 (US$ Million)
- Table 154. Argentina: Smart Manufacturing Market, By Process Industry- Revenue and Forecast to 2028 (US$ Million)
- Table 155. Argentina: Smart Manufacturing Market, by Component - Revenue and Forecast to 2028 (US$ Million)
- Table 156. Argentina: Smart Manufacturing Market, by Hardware - Revenue and Forecast to 2028 (US$ Million)
- Table 157. Argentina: Smart Manufacturing Market, by Software - Revenue and Forecast to 2028 (US$ Million)
- Table 158. Rest of SAM: Smart Manufacturing Market, by End User - Revenue and Forecast to 2028 (US$ Million)
- Table 159. Rest of SAM: Smart Manufacturing Market, By Discrete Industry- Revenue and Forecast to 2028 (US$ Million)
- Table 160. Rest of SAM: Smart Manufacturing Market, By Process Industry- Revenue and Forecast to 2028 (US$ Million)
- Table 161. Rest of SAM: Smart Manufacturing Market, by Component - Revenue and Forecast to 2028 (US$ Million)
- Table 162. Rest of SAM: Smart Manufacturing Market, by Hardware - Revenue and Forecast to 2028 (US$ Million)
- Table 163. Rest of SAM : Smart Manufacturing Market, by Software - Revenue and Forecast to 2028 (US$ Million)
- Table 164. List of Abbreviation
List Of Figures
- Figure 1. Smart Manufacturing Market Segmentation
- Figure 2. Smart Manufacturing Market Segmentation - By Geography
- Figure 3. Global Smart Manufacturing Market Overview
- Figure 4. Discrete Industry Segment held the largest share in 2020
- Figure 5. Hardware Segment held the largest share in 2020
- Figure 6. APAC held the largest share in 2020
- Figure 7. North America: PEST Analysis
- Figure 8. Europe: PEST Analysis
- Figure 9. Asia Pacific: PEST Analysis
- Figure 10. Middle East & Africa: PEST Analysis
- Figure 11. South America: PEST Analysis
- Figure 12. Smart Manufacturing Market - Ecosystem Analysis
- Figure 13. Expert Opinion
- Figure 14. Impact Analysis of Drivers and Restraints
- Figure 15. Smart Manufacturing Market - Geographic Analysis
- Figure 16. Smart Manufacturing Market Revenue and Forecast to 2028 (US$ Billion)
- Figure 17. Smart Manufacturing Market Breakdown, By End User (2020 and 2028)
- Figure 18. Discrete Industry: Smart Manufacturing Market Revenue and Forecast to 2028 (US$ Million)
- Figure 19. Defense Market Revenue and Forecast to 2028 (US$ Million)
- Figure 20. Medical Devices Market Revenue and Forecast to 2028 (US$ Million)
- Figure 21. Automotive Market Revenue and Forecast to 2028 (US$ Million)
- Figure 22. Semiconductors and Electronics Market Revenue and Forecast to 2028 (US$ Million)
- Figure 23. Machine Manufacturing Market Revenue and Forecast to 2028 (US$ Million)
- Figure 24. Aerospace Market Revenue and Forecast to 2028 (US$ Million)
- Figure 25. Others Market Revenue and Forecast to 2028 (US$ Million)
- Figure 26. Process Industry: Smart Manufacturing Market Revenue and Forecast to 2028 (US$ Million)
- Figure 27. Pulp and Paper Market Revenue and Forecast to 2028 (US$ Million)
- Figure 28. Metals and Mining Market Revenue and Forecast to 2028 (US$ Million)
- Figure 29. Pharmaceuticals Market Revenue and Forecast to 2028 (US$ Million)
- Figure 30. Oil and Gas Market Revenue and Forecast to 2028 (US$ Million)
- Figure 31. Energy and Power Market Revenue and Forecast to 2028 (US$ Million)
- Figure 32. Chemicals Market Revenue and Forecast to 2028 (US$ Million)
- Figure 33. Food and Beverages Market Revenue and Forecast to 2028 (US$ Million)
- Figure 34. Others Market Revenue and Forecast to 2028 (US$ Million)
- Figure 35. Smart Manufacturing Market Breakdown, By Component (2020 and 2028)
- Figure 36. Hardware: Smart Manufacturing Market Revenue and Forecast to 2028 (US$ Million)
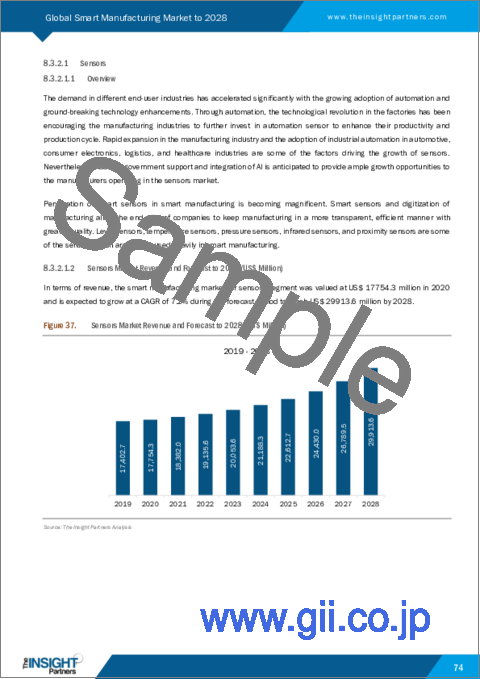
- Figure 37. Sensors Market Revenue and Forecast to 2028 (US$ Million)
- Figure 38. RTLS Market Revenue and Forecast to 2028 (US$ Million)
- Figure 39. Robotics Market Revenue and Forecast to 2028 (US$ Million)
- Figure 40. Industrial Machine Vision Market Revenue and Forecast to 2028 (US$ Million)
- Figure 41. Warehouse Management System Market Revenue and Forecast to 2028 (US$ Million)
- Figure 42. Human-Machine Interface Market Revenue and Forecast to 2028 (US$ Million)
- Figure 43. Industrial Communication Market Revenue and Forecast to 2028 (US$ Million)
- Figure 44. Industrial 3D Printing Market Revenue and Forecast to 2028 (US$ Million)
- Figure 45. IIoT Market Revenue and Forecast to 2028 (US$ Million)
- Figure 46. Software: Smart Manufacturing Market Revenue and Forecast to 2028 (US$ Million)
- Figure 47. Enterprise Manufacturing Intelligence Market Revenue and Forecast to 2028 (US$ Million)
- Figure 48. Plant Asset Management Market Revenue and Forecast to 2028 (US$ Million)
- Figure 49. Digital Twin Market Revenue and Forecast to 2028 (US$ Million)
- Figure 50. AI in manufacturing Market Revenue and Forecast to 2028 (US$ Million)
- Figure 51. Others Market Revenue and Forecast to 2028 (US$ Million)
- Figure 52. Global Smart Manufacturing Market Revenue Share, by Region (2020 and 2028)
- Figure 53. North America: Smart Manufacturing Market - Revenue and Forecast to 2028 (US$ Million)
- Figure 54. North America: Smart Manufacturing Market Revenue Share, by End User (2020 and 2028)
- Figure 55. North America: Smart Manufacturing Market Revenue Share, by Component (2020 and 2028)
- Figure 56. North America: Smart Manufacturing Market Revenue Share, by Key Country (2020 and 2028)
- Figure 57. US: Smart Manufacturing Market - Revenue and Forecast to 2028 (US$ Million)
- Figure 58. Canada: Smart Manufacturing Market - Revenue and Forecast to 2028 (US$ Million)
- Figure 59. Mexico: Smart Manufacturing Market - Revenue and Forecast to 2028 (US$ Million)
- Figure 60. Europe: Smart Manufacturing Market - Revenue and Forecast to 2028 (US$ Million)
- Figure 61. Europe: Smart Manufacturing Market Revenue Share, by End User (2020 and 2028)
- Figure 62. Europe: Smart Manufacturing Market Revenue Share, by Component (2020 and 2028)
- Figure 63. Europe: Smart Manufacturing Market Revenue Share, by Key Country (2020 and 2028)
- Figure 64. France: Smart Manufacturing Market - Revenue and Forecast to 2028 (US$ Million)
- Figure 65. Germany: Smart Manufacturing Market - Revenue and Forecast to 2028 (US$ Million)
- Figure 66. Italy: Smart Manufacturing Market - Revenue and Forecast to 2028 (US$ Million)
- Figure 67. UK: Smart Manufacturing Market - Revenue and Forecast to 2028 (US$ Million)
- Figure 68. Russia: Smart Manufacturing Market - Revenue and Forecast to 2028 (US$ Million)
- Figure 69. Rest of Europe: Smart Manufacturing Market - Revenue and Forecast to 2028 (US$ Million)
- Figure 70. APAC: Smart Manufacturing Market - Revenue and Forecast to 2028 (US$ Million)
- Figure 71. APAC: Smart Manufacturing Market Revenue Share, by End User (2020 and 2028)
- Figure 72. APAC: Smart Manufacturing Market Revenue Share, by Component (2020 and 2028)
- Figure 73. APAC: Smart Manufacturing Market Revenue Share, by Key Country (2020 and 2028)
- Figure 74. Australia: Smart Manufacturing Market - Revenue and Forecast to 2028 (US$ Million)
- Figure 75. China: Smart Manufacturing Market - Revenue and Forecast to 2028 (US$ Million)
- Figure 76. India: Smart Manufacturing Market - Revenue and Forecast to 2028 (US$ Million)
- Figure 77. Japan: Smart Manufacturing Market - Revenue and Forecast to 2028 (US$ Million)
- Figure 78. South Korea: Smart Manufacturing Market - Revenue and Forecast to 2028 (US$ Million)
- Figure 79. Rest of APAC: Smart Manufacturing Market - Revenue and Forecast to 2028 (US$ Million)
- Figure 80. MEA: Smart Manufacturing Market - Revenue and Forecast to 2028 (US$ Million)
- Figure 81. MEA: Smart Manufacturing Market Revenue Share, by End User (2020 and 2028)
- Figure 82. MEA: Smart Manufacturing Market Revenue Share, by Component (2020 and 2028)
- Figure 83. MEA: Smart Manufacturing Market Revenue Share, by Key Country (2020 and 2028)
- Figure 84. Saudi Arabia: Smart Manufacturing Market - Revenue and Forecast to 2028 (US$ Million)
- Figure 85. UAE: Smart Manufacturing Market - Revenue and Forecast to 2028 (US$ Million)
- Figure 86. South Africa: Smart Manufacturing Market - Revenue and Forecast to 2028 (US$ Million)
- Figure 87. Rest of MEA: Smart Manufacturing Market - Revenue and Forecast to 2028 (US$ Million)
- Figure 88. SAM: Smart Manufacturing Market - Revenue and Forecast to 2028 (US$ Million)
- Figure 89. SAM: Smart Manufacturing Market Revenue Share, by End User (2020 and 2028)
- Figure 90. SAM: Smart Manufacturing Market Revenue Share, by Component (2020 and 2028)
- Figure 91. SAM: Smart Manufacturing Market Revenue Share, by Key Country (2020 and 2028)
- Figure 92. Brazil: Smart Manufacturing Market - Revenue and Forecast to 2028 (US$ Million)
- Figure 93. Argentina: Smart Manufacturing Market - Revenue and Forecast to 2028 (US$ Million)
- Figure 94. Rest of SAM: Smart Manufacturing Market - Revenue and Forecast to 2028 (US$ Million)
- Figure 95. Impact of COVID-19 Pandemic in North American Country Markets
- Figure 96. Impact of COVID-19 Pandemic in Europe Country Markets
- Figure 97. Impact of COVID-19 Pandemic in Asia Pacific Country Markets
- Figure 98. Impact of COVID-19 Pandemic in MEA Country Markets
- Figure 99. Impact of COVID-19 Pandemic in SAM Country Markets
The smart manufacturing market is expected to grow from US$ 258.72 billion in 2022 to US$ 365.22 billion by 2028; it is estimated to grow at a CAGR of 6.0% from 2022 to 2028.
The constant need to improve productivity and enhance visibility in the manufacturing processes has propelled the adoption of digitization in the manufacturing sector. Increased focus on combining innovation and efficiency of innovation across various domains and major technological advancements in data analytics, predictive maintenance, and industrial networking is boosting the growth of the smart manufacturing market. Growing demand for software systems that are consolidated and streamlined over a single platform for providing real-time information is also bolstering the market growth. Moreover, Industry 4.0 is aiding the transformation of industries from legacy systems to smart components. The rapidly growing automotive sector that offers benefits such as asset efficiency, cost savings, quality, and sustainability is bolstering the growth of smart factory solutions. Investments in the smart factory would offer automotive manufacturers competitive advantages, including better profitability and shortened time to market. Various smart manufacturing initiatives by governments, such as the Smart Manufacturing Leadership Coalition (SMLC) and the Industrial Internet Consortium (IIC), to boost industrial automation are also fueling the smart manufacturing market growth.
North America accounts for a significant share of the global smart manufacturing market. The growing adoption of industrial automation solutions, including IoT and cloud platforms; rising emphasis on regulatory compliances; and increasing demand for software systems that reduce time and cost are a few of the key forces propelling the market growth in the region. Manufacturers in the US, Canada, and Mexico are implementing enterprise integration platforms such as enterprise service buses (ESBs), manufacturing service buses (MSBs), and application programming interface (API) managers to receive, analyze, and aggregate the data, along with triggering process controls and optimizing the business processes across the enterprise and value chain systems.
The rapid adoption of 3D food printing and machine vision, among other technologies, in the European Union, high investments in automation technologies for design flexibility, innovative and integrated safety solutions, and advanced software tools are boosting the smart manufacturing market growth in European countries such as Germany, France, and the UK. Manufacturers in the automotive, aerospace & defense, food & beverages, and semiconductor & electronics industries in these countries are increasingly adopting 3D printing technologies to produce lightweight, cost-effective products. The rise of Big Data processing capabilities such as Hadoop, R, Storm, and streaming analytics support the operational visibility, analysis, and diagnostics of supply chains. The integration of Big Data analytics into industrial equipment is enabling the market players to analyze its lifespan, capacity fluctuation, and demand patterns, which is further boosting the adoption of smart manufacturing solutions.
The smart manufacturing market in APAC is expected to grow at the highest CAGR during the forecast period. Countries in the region are focusing on automating in-house manufacturing facilities with initiatives such as "Make in India" and "Made in China 2025." Manufacturers are streamlining their supply chains to gain a competitive edge over other players, improve safety at workplaces, and reduce the cost of operations. China is a major manufacturing hub, and the industrial sector in the country is undergoing a rapid transformation. China is anticipated to spend ~US$ 1.4 trillion on its digital infrastructure public spending program. Manufacturers in the country are adopting various smart manufacturing approaches, including Industry 4.0 and Industrial IoT (IIoT), to optimize manufacturing processes.
The smart manufacturing market is bifurcated on the basis of end-user and component. Based on end-users, the smart manufacturing market is divided into discrete industry and process industry. The discrete industry segment held a larger market share in 2020. Due to the rising production of medical devices, defense equipment, semiconductors, cars, and machines, advanced technologies are being adopted Based on component, the smart manufacturing market is bifurcated into hardware and software. The hardware segment holds a larger share of the market. The segment growth is due to the growing integration & implementation of RTL, robots, and sensors are expanding in manufacturing plants. Based on geography, the smart manufacturing market is segmented into North America (the US, Canada, and Mexico), Europe (Austria, Italy, Poland, Switzerland, Sweden, Norway, Denmark, the Netherlands, Finland, Spain, Baltic states and Rest of Europe), and Asia Pacific (Australia, Japan, South Korea, Taiwan, and Rest of APAC).
The overall smart manufacturing market size has been derived using both primary and secondary sources. Exhaustive secondary research has been conducted using internal and external sources to obtain qualitative and quantitative information related to the smart manufacturing market. The process also obtains an overview and forecast for the smart manufacturing market with respect to all the segments. Also, multiple primary interviews have been conducted with industry participants to validate the data and gain more analytical insights. Participants of this process include industry experts such as VPs, business development managers, market intelligence managers, national sales managers, and external consultants-valuation experts, research analysts, and key opinion leaders-specializing in the smart manufacturing market.
Reasons to Buy:
Save and reduce time carrying out entry-level research by identifying the growth, size, leading players, and segments in the smart manufacturing market
Highlights key business priorities in order to assist companies to realign their business strategies
The key findings and recommendations highlight crucial progressive industry trends in the smart manufacturing market thereby allowing players across the value chain to develop effective long-term strategies
Develop/modify business expansion plans by using substantial growth offering developed and emerging markets
Scrutinize in-depth global market trends and outlook coupled with the factors driving the market, as well as those hindering it
Enhance the decision-making process by understanding the strategies that underpin commercial interest with respect to client products, segmentation, pricing, and distribution
Table Of Contents
1. Introduction
- 1.1 Study Scope
- 1.2 The Insight Partners Research Report Guidance
- 1.3 Market Segmentation
2. Key Takeaways
3. Research Methodology
- 3.1 Coverage
- 3.2 Secondary Research
- 3.3 Primary Research
4. Smart Manufacturing Market Landscape
- 4.1 Market Overview
- 4.2 PEST Analysis
- 4.2.1 North America
- 4.2.2 Europe
- 4.2.3 Asia Pacific
- 4.2.4 Middle East & Africa
- 4.2.5 South America
- 4.3 Ecosystem Analysis
- 4.4 Expert Opinion
5. Smart Manufacturing Market - Key Market Dynamics
- 5.1 Market Drivers
- 5.1.1 Escalating Demand for Smart Machine Vision Systems
- 5.1.2 Countries with Huge Industrial Sector and Implementation of Advanced Techniques
- 5.2 Market Restraints
- 5.2.1 Risks to Data Security and Compatibility Issues
- 5.3 Market Opportunities
- 5.3.1 Surging Adoption of RTLS
- 5.4 Future Trends
- 5.4.1 Growing Use of Robotics in Automation
- 5.4.2 Revolution in Smart Factories
- 5.5 Impact Analysis of Drivers and Restraints
6. Smart Manufacturing Market - Global Analysis
- 6.1 Smart Manufacturing Market Overview
- 6.2 Smart Manufacturing Market Revenue and Forecast to 2028 (US$ Billion)
- 6.3 Market Positioning - Five Key Players
7. Smart Manufacturing Market Analysis - By End User
- 7.1 Overview
- 7.2 Smart Manufacturing Market Breakdown, By End User (2020 and 2028)
- 7.3 Discrete Industry
- 7.3.1 Overview
- 7.3.2 Discrete Industry: Smart Manufacturing Market Revenue and Forecast to 2028 (US$ Million)
- 7.3.2.1 Defense
- 7.3.2.1.1 Overview
- 7.3.2.1.2 Defense Market Revenue and Forecast to 2028 (US$ Million)
- 7.3.2.2 Medical Devices
- 7.3.2.2.1 Overview
- 7.3.2.2.2 Medical Devices Market Revenue and Forecast to 2028 (US$ Million)
- 7.3.2.3 Automotive
- 7.3.2.3.1 Overview
- 7.3.2.3.2 Automotive Market Revenue and Forecast to 2028 (US$ Million)
- 7.3.2.4 Semiconductors and Electronics
- 7.3.2.4.1 Overview
- 7.3.2.4.2 Semiconductors and Electronics Market Revenue and Forecast to 2028 (US$ Million)
- 7.3.2.5 Machine Manufacturing
- 7.3.2.5.1 Overview
- 7.3.2.5.2 Machine Manufacturing Market Revenue and Forecast to 2028 (US$ Million)
- 7.3.2.6 Aerospace
- 7.3.2.6.1 Overview
- 7.3.2.6.2 Aerospace Market Revenue and Forecast to 2028 (US$ Million)
- 7.3.2.7 Others
- 7.3.2.7.1 Overview
- 7.3.2.7.2 Others Market Revenue and Forecast to 2028 (US$ Million)
- 7.3.2.1 Defense
- 7.4 Process Industry
- 7.4.1 Overview
- 7.4.2 Process Industry: Smart Manufacturing Market Revenue and Forecast to 2028 (US$ Million)
- 7.4.2.1 Pulp and Paper
- 7.4.2.1.1 Overview
- 7.4.2.1.2 Pulp and Paper Market Revenue and Forecast to 2028 (US$ Million)
- 7.4.2.2 Metals and Mining
- 7.4.2.2.1 Overview
- 7.4.2.2.2 Metals and Mining Market Revenue and Forecast to 2028 (US$ Million)
- 7.4.2.3 Pharmaceuticals
- 7.4.2.3.1 Overview
- 7.4.2.3.2 Pharmaceuticals Market Revenue and Forecast to 2028 (US$ Million)
- 7.4.2.4 Oil and Gas
- 7.4.2.4.1 Overview
- 7.4.2.4.2 Oil and Gas Market Revenue and Forecast to 2028 (US$ Million)
- 7.4.2.5 Energy and Power
- 7.4.2.5.1 Overview
- 7.4.2.5.2 Energy and Power Market Revenue and Forecast to 2028 (US$ Million)
- 7.4.2.6 Chemicals
- 7.4.2.6.1 Overview
- 7.4.2.6.2 Chemicals Market Revenue and Forecast to 2028 (US$ Million)
- 7.4.2.7 Food and Beverages
- 7.4.2.7.1 Overview
- 7.4.2.7.2 Food and Beverages Market Revenue and Forecast to 2028 (US$ Million)
- 7.4.2.8 Others
- 7.4.2.8.1 Overview
- 7.4.2.8.2 Others Market Revenue and Forecast to 2028 (US$ Million)
- 7.4.2.1 Pulp and Paper
8. Smart Manufacturing Market Analysis - By Component
- 8.1 Overview
- 8.2 Smart Manufacturing Market Breakdown, By Component (2020 and 2028)
- 8.3 Hardware
- 8.3.1 Overview
- 8.3.2 Hardware: Smart Manufacturing Market Revenue and Forecast to 2028 (US$ Million)
- 8.3.2.1 Sensors
- 8.3.2.1.1 Overview
- 8.3.2.1.2 Sensors Market Revenue and Forecast to 2028 (US$ Million)
- 8.3.2.2 RTLS
- 8.3.2.2.1 Overview
- 8.3.2.2.2 RTLS Market Revenue and Forecast to 2028 (US$ Million)
- 8.3.2.3 Robotics
- 8.3.2.3.1 Overview
- 8.3.2.3.2 Robotics Market Revenue and Forecast to 2028 (US$ Million)
- 8.3.2.4 Industrial Machine Vision
- 8.3.2.4.1 Overview
- 8.3.2.4.2 Industrial Machine Vision Market Revenue and Forecast to 2028 (US$ Million)
- 8.3.2.5 Warehouse Management System
- 8.3.2.5.1 Overview
- 8.3.2.5.2 Warehouse Management System Market Revenue and Forecast to 2028 (US$ Million)
- 8.3.2.6 Human-Machine Interface
- 8.3.2.6.1 Overview
- 8.3.2.6.2 Human-Machine Interface Market Revenue and Forecast to 2028 (US$ Million)
- 8.3.2.7 Industrial Communication
- 8.3.2.7.1 Overview
- 8.3.2.7.2 Industrial Communication Market Revenue and Forecast to 2028 (US$ Million)
- 8.3.2.8 Industrial 3D printing
- 8.3.2.8.1 Overview
- 8.3.2.8.2 Industrial 3D Printing Market Revenue and Forecast to 2028 (US$ Million)
- 8.3.2.9 IIoT
- 8.3.2.9.1 Overview
- 8.3.2.9.2 IIoT Market Revenue and Forecast to 2028 (US$ Million)
- 8.3.2.1 Sensors
- 8.4 Software
- 8.4.1 Overview
- 8.4.2 Software: Smart Manufacturing Market Revenue and Forecast to 2028 (US$ Million)
- 8.4.2.1 Enterprise Manufacturing Intelligence
- 8.4.2.1.1 Overview
- 8.4.2.1.2 Enterprise Manufacturing Intelligence Market Revenue and Forecast to 2028 (US$ Million)
- 8.4.2.2 Plant Asset Management Market
- 8.4.2.2.1 Overview
- 8.4.2.2.2 Plant Asset Management Market Revenue and Forecast to 2028 (US$ Million)
- 8.4.2.3 Digital Twin
- 8.4.2.3.1 Overview
- 8.4.2.3.2 Digital Twin Market Revenue and Forecast to 2028 (US$ Million)
- 8.4.2.4 AI in manufacturing
- 8.4.2.4.1 Overview
- 8.4.2.4.2 AI in manufacturing Market Revenue and Forecast to 2028 (US$ Million)
- 8.4.2.5 Others
- 8.4.2.5.1 Overview
- 8.4.2.5.2 Others Market Revenue and Forecast to 2028 (US$ Million)
- 8.4.2.1 Enterprise Manufacturing Intelligence
9. Smart manufacturing Market - Geographic Analysis
- 9.1 Overview
- 9.2 North America: Smart Manufacturing Market
- 9.2.1 North America: Smart Manufacturing Market - Revenue and Forecast to 2028 (US$ Million)
- 9.2.2 North America: Smart Manufacturing Market, by End User
- 9.2.3 North America: Smart Manufacturing Market, by Component
- 9.2.4 North America: Smart Manufacturing Market, by Key Country
- 9.2.4.1 US: Smart Manufacturing Market - Revenue and Forecast to 2028 (US$ Million)
- 9.2.4.1.1 US: Smart Manufacturing Market, by End User
- 9.2.4.1.1.1 US: Smart Manufacturing Market, By Discrete Industry
- 9.2.4.1.1.2 US: Smart Manufacturing Market, By Process Industry
- 9.2.4.1.2 US: Smart Manufacturing Market, by Component
- 9.2.4.2 Canada: Smart Manufacturing Market - Revenue and Forecast to 2028 (US$ Million)
- 9.2.4.2.1 Canada: Smart Manufacturing Market, by End User
- 9.2.4.2.1.1 Canada: Smart Manufacturing Market, By Discrete Industry
- 9.2.4.2.1.2 Canada: Smart Manufacturing Market, By Process Industry
- 9.2.4.2.2 Canada: Smart Manufacturing Market, by Component
- 9.2.4.3 Mexico: Smart Manufacturing Market - Revenue and Forecast to 2028 (US$ Million)
- 9.2.4.3.1 Mexico: Smart Manufacturing Market, by End User
- 9.2.4.3.1.1 Mexico: Smart Manufacturing Market, By Discrete Industry
- 9.2.4.3.1.2 Mexico: Smart Manufacturing Market, By Process Industry
- 9.2.4.3.2 Mexico: Smart Manufacturing Market, by Component
- 9.2.4.1 US: Smart Manufacturing Market - Revenue and Forecast to 2028 (US$ Million)
- 9.3 Europe: Smart Manufacturing Market
- 9.3.1 Europe: Smart Manufacturing Market - Revenue and Forecast to 2028 (US$ Million)
- 9.3.2 Europe: Smart Manufacturing Market, by End User
- 9.3.2.1.1.1 Europe: Smart Manufacturing Market, By Discrete Industry
- 9.3.2.1.1.2 Europe: Smart Manufacturing Market, By Process Industry
- 9.3.3 Europe: Smart Manufacturing Market, by Component
- 9.3.4 Europe: Smart Manufacturing Market, by Key Country
- 9.3.4.1 France: Smart Manufacturing Market - Revenue and Forecast to 2028 (US$ Million)
- 9.3.4.1.1 France: Smart Manufacturing Market, by End User
- 9.3.4.1.1.1 France: Smart Manufacturing Market, By Discrete Industry
- 9.3.4.1.1.2 France: Smart Manufacturing Market, By Process Industry
- 9.3.4.1.2 France: Smart Manufacturing Market, by Component
- 9.3.4.2 Germany: Smart Manufacturing Market - Revenue and Forecast to 2028 (US$ Million)
- 9.3.4.2.1 Germany: Smart Manufacturing Market, by End User
- 9.3.4.2.1.1 Germany: Smart Manufacturing Market, By Discrete Industry
- 9.3.4.2.1.2 Germany: Smart Manufacturing Market, By Process Industry
- 9.3.4.2.2 Germany: Smart Manufacturing Market, by Component
- 9.3.4.3 Italy: Smart Manufacturing Market - Revenue and Forecast to 2028 (US$ Million)
- 9.3.4.3.1 Italy: Smart Manufacturing Market, by End User
- 9.3.4.3.1.1 Italy: Smart Manufacturing Market, By Discrete Industry
- 9.3.4.3.1.2 Italy: Smart Manufacturing Market, By Process Industry
- 9.3.4.3.2 Italy: Smart Manufacturing Market, by Component
- 9.3.4.4 UK: Smart Manufacturing Market - Revenue and Forecast to 2028 (US$ Million)
- 9.3.4.4.1 UK: Smart Manufacturing Market, by End User
- 9.3.4.4.1.1 UK: Smart Manufacturing Market, By Discrete Industry
- 9.3.4.4.1.2 UK: Smart Manufacturing Market, By Process Industry
- 9.3.4.4.2 UK: Smart Manufacturing Market, by Component
- 9.3.4.5 Russia: Smart Manufacturing Market - Revenue and Forecast to 2028 (US$ Million)
- 9.3.4.5.1 Russia: Smart Manufacturing Market, by End User
- 9.3.4.5.1.1 Russia: Smart Manufacturing Market, By Discrete Industry
- 9.3.4.5.1.2 Russia: Smart Manufacturing Market, By Process Industry
- 9.3.4.5.2 Russia: Smart Manufacturing Market, by Component
- 9.3.4.6 Rest of Europe: Smart Manufacturing Market - Revenue and Forecast to 2028 (US$ Million)
- 9.3.4.6.1 Rest of Europe: Smart Manufacturing Market, by End User
- 9.3.4.6.1.1 Rest of Europe: Smart Manufacturing Market, By Discrete Industry
- 9.3.4.6.1.2 Rest of Europe: Smart Manufacturing Market, By Process Industry
- 9.3.4.6.2 Rest of Europe: Smart Manufacturing Market, by Component
- 9.3.4.1 France: Smart Manufacturing Market - Revenue and Forecast to 2028 (US$ Million)
- 9.4 APAC: Smart Manufacturing Market
- 9.4.1 APAC: Smart Manufacturing Market - Revenue and Forecast to 2028 (US$ Million)
- 9.4.2 APAC: Smart Manufacturing Market, by End User
- 9.4.2.1.1.1 APAC: Smart Manufacturing Market, By Discrete Industry
- 9.4.2.1.1.2 APAC: Smart Manufacturing Market, By Process Industry
- 9.4.3 APAC: Smart Manufacturing Market, by Component
- 9.4.4 APAC: Smart Manufacturing Market, by Key Country
- 9.4.4.1 Australia: Smart Manufacturing Market - Revenue and Forecast to 2028 (US$ Million)
- 9.4.4.1.1 Australia: Smart Manufacturing Market, by End User
- 9.4.4.1.1.1 Australia: Smart Manufacturing Market, By Discrete Industry
- 9.4.4.1.1.2 Australia: Smart Manufacturing Market, By Process Industry
- 9.4.4.1.2 Australia: Smart Manufacturing Market, by Component
- 9.4.4.2 China: Smart Manufacturing Market - Revenue and Forecast to 2028 (US$ Million)
- 9.4.4.2.1 China: Smart Manufacturing Market, by End User
- 9.4.4.2.1.1 China: Smart Manufacturing Market, By Discrete Industry
- 9.4.4.2.1.2 China: Smart Manufacturing Market, By Process Industry
- 9.4.4.2.2 China: Smart Manufacturing Market, by Component
- 9.4.4.3 India: Smart Manufacturing Market - Revenue and Forecast to 2028 (US$ Million)
- 9.4.4.3.1 India: Smart Manufacturing Market, by End User
- 9.4.4.3.1.1 India: Smart Manufacturing Market, By Discrete Industry
- 9.4.4.3.1.2 India: Smart Manufacturing Market, By Process Industry
- 9.4.4.3.2 India: Smart Manufacturing Market, by Component
- 9.4.4.4 Japan: Smart Manufacturing Market - Revenue and Forecast to 2028 (US$ Million)
- 9.4.4.4.1 Japan: Smart Manufacturing Market, by End User
- 9.4.4.4.1.1 Japan: Smart Manufacturing Market, By Discrete Industry
- 9.4.4.4.1.2 Japan: Smart Manufacturing Market, By Process Industry
- 9.4.4.4.2 Japan: Smart Manufacturing Market, by Component
- 9.4.4.5 South Korea: Smart Manufacturing Market - Revenue and Forecast to 2028 (US$ Million)
- 9.4.4.5.1 South Korea: Smart Manufacturing Market, by End User
- 9.4.4.5.1.1 South Korea: Smart Manufacturing Market, By Discrete Industry
- 9.4.4.5.1.2 South Korea: Smart Manufacturing Market, By Process Industry
- 9.4.4.5.2 South Korea: Smart Manufacturing Market, by Component
- 9.4.4.6 Rest of APAC: Smart Manufacturing Market - Revenue and Forecast to 2028 (US$ Million)
- 9.4.4.6.1 Rest of APAC: Smart Manufacturing Market, by End User
- 9.4.4.6.1.1 Rest of APAC: Smart Manufacturing Market, By Discrete Industry
- 9.4.4.6.1.2 Rest of APAC: Smart Manufacturing Market, By Process Industry
- 9.4.4.6.2 Rest of APAC: Smart Manufacturing Market, by Component
- 9.4.4.1 Australia: Smart Manufacturing Market - Revenue and Forecast to 2028 (US$ Million)
- 9.5 MEA: Smart Manufacturing Market
- 9.5.1 MEA: Smart Manufacturing Market - Revenue and Forecast to 2028 (US$ Million)
- 9.5.2 MEA: Smart Manufacturing Market, by End User
- 9.5.2.1.1.1 MEA: Smart Manufacturing Market, By Discrete Industry
- 9.5.2.1.1.2 MEA: Smart Manufacturing Market, By Process Industry
- 9.5.3 MEA: Smart Manufacturing Market, by Component
- 9.5.4 MEA: Smart Manufacturing Market, by Key Country
- 9.5.4.1 Saudi Arabia: Smart Manufacturing Market - Revenue and Forecast to 2028 (US$ Million)
- 9.5.4.1.1 Saudi Arabia: Smart Manufacturing Market, by End User
- 9.5.4.1.1.1 Saudi Arabia: Smart Manufacturing Market, By Discrete Industry
- 9.5.4.1.1.2 Saudi Arabia: Smart Manufacturing Market, By Process Industry
- 9.5.4.1.2 Saudi Arabia: Smart Manufacturing Market, by Component
- 9.5.4.2 UAE: Smart Manufacturing Market - Revenue and Forecast to 2028 (US$ Million)
- 9.5.4.2.1 UAE: Smart Manufacturing Market, by End User
- 9.5.4.2.1.1 UAE: Smart Manufacturing Market, By Discrete Industry
- 9.5.4.2.1.2 UAE: Smart Manufacturing Market, By Process Industry
- 9.5.4.2.2 UAE: Smart Manufacturing Market, by Component
- 9.5.4.3 South Africa: Smart Manufacturing Market - Revenue and Forecast to 2028 (US$ Million)
- 9.5.4.3.1 South Africa: Smart Manufacturing Market, by End User
- 9.5.4.3.1.1 South Africa: Smart Manufacturing Market, By Discrete Industry
- 9.5.4.3.1.2 South Africa: Smart Manufacturing Market, By Process Industry
- 9.5.4.3.2 South Africa: Smart Manufacturing Market, by Component
- 9.5.4.4 Rest of MEA: Smart Manufacturing Market - Revenue and Forecast to 2028 (US$ Million)
- 9.5.4.4.1 Rest of MEA: Smart Manufacturing Market, by End User
- 9.5.4.4.1.1 Rest of MEA: Smart Manufacturing Market, By Discrete Industry
- 9.5.4.4.1.2 Rest of MEA: Smart Manufacturing Market, By Process Industry
- 9.5.4.4.2 Rest of MEA: Smart Manufacturing Market, by Component
- 9.5.4.1 Saudi Arabia: Smart Manufacturing Market - Revenue and Forecast to 2028 (US$ Million)
- 9.6 SAM: Smart Manufacturing Market
- 9.6.1 SAM: Smart Manufacturing Market - Revenue and Forecast to 2028 (US$ Million)
- 9.6.2 SAM: Smart Manufacturing Market, by End User
- 9.6.2.1.1.1 SAM: Smart Manufacturing Market, By Discrete Industry
- 9.6.2.1.1.2 SAM: Smart Manufacturing Market, By Process Industry
- 9.6.3 SAM: Smart Manufacturing Market, by Component
- 9.6.4 SAM: Smart Manufacturing Market, by Key Country
- 9.6.4.1 Brazil: Smart Manufacturing Market - Revenue and Forecast to 2028 (US$ Million)
- 9.6.4.1.1 Brazil: Smart Manufacturing Market, by End User
- 9.6.4.1.1.1 Brazil: Smart Manufacturing Market, By Discrete Industry
- 9.6.4.1.1.2 Brazil: Smart Manufacturing Market, By Process Industry
- 9.6.4.1.2 Brazil: Smart Manufacturing Market, by Component
- 9.6.4.2 Argentina: Smart Manufacturing Market - Revenue and Forecast to 2028 (US$ Million)
- 9.6.4.2.1 Argentina: Smart Manufacturing Market, by End User
- 9.6.4.2.1.1 Argentina: Smart Manufacturing Market, By Discrete Industry
- 9.6.4.2.1.2 Argentina: Smart Manufacturing Market, By Process Industry
- 9.6.4.2.2 Argentina: Smart Manufacturing Market, by Component
- 9.6.4.3 Rest of SAM: Smart Manufacturing Market - Revenue and Forecast to 2028 (US$ Million)
- 9.6.4.3.1 Rest of SAM: Smart Manufacturing Market, by End User
- 9.6.4.3.1.1 Rest of SAM: Smart Manufacturing Market, By Discrete Industry
- 9.6.4.3.1.2 Rest of SAM: Smart Manufacturing Market, By Process Industry
- 9.6.4.3.2 Rest of SAM: Smart Manufacturing Market, by Component
- 9.6.4.1 Brazil: Smart Manufacturing Market - Revenue and Forecast to 2028 (US$ Million)
10. Smart Manufacturing Market- COVID-19 Impact Analysis
- 10.1 Overview
- 10.1.1 North America: Impact Assessment of COVID-19 Pandemic
- 10.1.2 Europe: Impact Assessment of COVID-19 Pandemic
- 10.1.3 Asia Pacific: Impact Assessment of COVID-19 Pandemic
- 10.1.4 MEA: Impact Assessment of COVID-19 Pandemic
- 10.1.5 SAM: Impact Assessment of COVID-19 Pandemic
11. Industry Landscape
- 11.1 Overview
- 11.2 Market Initiative
- 11.3 New Product Development
- 11.4 Merger and Acquisition
12. Company Profiles
- 12.1 Yokogawa Electric Corporation
- 12.1.1 Key Facts
- 12.1.2 Business Description
- 12.1.3 Products and Services
- 12.1.4 Financial Overview
- 12.1.5 SWOT Analysis
- 12.1.6 Key Developments
- 12.2 Cisco Systems, Inc.
- 12.2.1 Key Facts
- 12.2.2 Business Description
- 12.2.3 Products and Services
- 12.2.4 Financial Overview
- 12.2.5 SWOT Analysis
- 12.2.6 Key Developments
- 12.3 Honeywell International Inc.
- 12.3.1 Key Facts
- 12.3.2 Business Description
- 12.3.3 Products and Services
- 12.3.4 Financial Overview
- 12.3.5 SWOT Analysis
- 12.3.6 Key Developments
- 12.4 3D Systems, Inc.
- 12.4.1 Key Facts
- 12.4.2 Business Description
- 12.4.3 Products and Services
- 12.4.4 Financial Overview
- 12.4.5 SWOT Analysis
- 12.4.6 Key Developments
- 12.5 Daifuku Co., Ltd.
- 12.5.1 Key Facts
- 12.5.2 Business Description
- 12.5.3 Products and Services
- 12.5.4 Financial Overview
- 12.5.5 SWOT Analysis
- 12.5.6 Key Developments
- 12.6 GENERAL ELECTRIC
- 12.6.1 Key Facts
- 12.6.2 Business Description
- 12.6.3 Products and Services
- 12.6.4 Financial Overview
- 12.6.5 SWOT Analysis
- 12.6.6 Key Developments
- 12.7 IBM Corporation
- 12.7.1 Key Facts
- 12.7.2 Business Description
- 12.7.3 Products and Services
- 12.7.4 Financial Overview
- 12.7.5 SWOT Analysis
- 12.7.6 Key Developments
- 12.8 Oracle Corporation
- 12.8.1 Key Facts
- 12.8.2 Business Description
- 12.8.3 Products and Services
- 12.8.4 Financial Overview
- 12.8.5 SWOT Analysis
- 12.8.6 Key Developments
- 12.9 Siemens AG
- 12.9.1 Key Facts
- 12.9.2 Business Description
- 12.9.3 Products and Services
- 12.9.4 Financial Overview
- 12.9.5 SWOT Analysis
- 12.9.6 Key Developments
- 12.10 Schneider Electric SE
- 12.10.1 Key Facts
- 12.10.2 Business Description
- 12.10.3 Products and Services
- 12.10.4 Financial Overview
- 12.10.5 SWOT Analysis
- 12.10.6 Key Developments
13. Appendix
- 13.1 About The Insight Partners
- 13.2 Word Index