|
|
市場調査レポート
商品コード
1400912
水圧破砕用フルードエンドの世界市場:市場規模・シェア・動向・予測、成長分析 (2023年~2028年)Fracking Fluid End Market Size, Share, Trend, Dynamics, Forecast, & Growth Analysis- 2023-2028 |
||||||
|
|
|||||||
|
|||||||


| 水圧破砕用フルードエンドの世界市場:市場規模・シェア・動向・予測、成長分析 (2023年~2028年) |
|
出版日: 2023年10月25日
発行: Stratview Research
ページ情報: 英文 151 Pages
納期: 即日から翌営業日
|

- 全表示
- 概要
- 目次
世界の水圧破砕用フルードエンドの市場規模は、長期的に4.2%のCAGRが見込まれ、2028年には7億3,470万米ドルに達します。
石油・天然ガスの生産に使われる水圧破砕法は、破砕液を坑井に送り込むために破砕ポンプを使用します。各々の水圧破砕フリートは複数の水圧破砕ポンプを使用します。通常、1フリートあたり18~20台の破砕ポンプが使用されます。これらのポンプは、パワーエンドとフルードエンド (流体端) という2つの主要コンポーネントで構成されています。
坑井への流体の高圧注入を担当するこれらのフルードエンドは、水圧ポンプにとって不可欠な部分であるだけでなく、圧力ポンプ市場にとっても不可欠なコンポーネントです。フルードエンドの寿命は、再生水、高度な化学薬品とスリックウォーターの使用、およびそれを通して圧送される水圧砂の品質によって減少します。ステンレス鋼製流体端は、炭素鋼製流体端 (100~500ポンピング時間) に比べ、1,000~5,000ポンピング時間と長寿命です。この事実により、流体端市場は、ポンプ総コストの30%しか占めていないにもかかわらず、メーカーに魅力的な機会を提供しています。
2020年は石油・ガス業界にとって2つの大きな挫折をもたらしました:ロシアとサウジアラビアの価格戦争とCOVID-19です。ロシアとサウジアラビアの原油減産に関する意見の相違により、原油価格は30%以上急落し、1バレル当たり30米ドルを下回りました。原油価格が1バレルあたり40米ドルを下回ると採算がとれなくなるため、原油価格の下落は米国のシェール産業に大きな影響を与えます。市場規模が大きい水圧破砕用フルードエンド市場もこうした動向とは無縁ではなく、2020年には35%以上の大幅な減少が見られました。
しかし、原油価格はパンデミックからの回復とともに再び回復基調にあります。最近の地政学的状況の変化は、需給力学に影響を与えました。その結果、原油・天然ガス価格が急騰しました。EIAの予測 (2023年6月) によると、2023年の平均原油価格は1バレル当たり79.5ドルで安定し、2024年には83.5ドルに達すると予測されています。
石油需要の増加は破砕活動の急増につながり、フルードエンドの需要増加を促進し、北米における破砕ステージ数の増加とともに市場成長を促進すると予想されます。
当レポートでは、世界の水圧破砕用フルードエンド市場について分析し、市場の基本構造や主な促進・抑制要因、全体的な市場規模の動向見通し、セグメント別・地域別の詳細動向、競合情勢、主要企業のプロファイルなどを調査しております。
目次
第1章 エグゼクティブサマリー:市場の鳥瞰図
第2章 市場環境分析:市場力学に影響を与える要因の検討
- サプライチェーン分析 (バリューチェーン全体の主要企業/材料の特定)
- PEST分析 (市場の需要に直接的・間接的に影響を与えるすべての要因のリスト)
- 業界のライフサイクル分析 (市場の現在・将来のライフサイクル段階)
- 主要な動向 (市場力学を形成する主要な業界・市場の動向)
- 市場促進要因 (促進要因とその短期的および長期的な影響の調査)
- 市場の課題 (普及・成長を阻害する要因の調査)
第3章 水圧破砕用フルードエンド市場の評価 (単位:100万米ドル・1,000台、2017年~2028年)
- 水圧破砕用フルードエンド市場の動向と予測 (単位:100万米ドル・1,000台)
- 市場予測シナリオ分析 (悲観的・現実的・楽観的な市場予測)
第4章 水圧破砕用フルードエンド市場:セグメント別分析 (単位:100万米ドル・1,000台、2017年~2028年)
- 材料の種類別の分析
- 炭素鋼:地域別の動向と予測 (単位:100万米ドル・1,000台)
- ステンレス鋼:地域別の動向と予測 (単位:100万米ドル・1,000台)
- エンドユーザーの種類別の分析
- OE:地域別の動向と予測 (単位:100万米ドル・1,000台)
- アフターマーケット:地域別の動向と予測 (単位:100万米ドル・1,000台)
- デザインの種類別の分析
- 五連式:地域別の動向と予測 (単位:100万米ドル・1,000台)
- 三連式:地域別の動向と予測 (単位:100万米ドル・1,000台)
- 馬力 (HP) の種類別の分析
- 2,000~2,500馬力:地域別の動向と予測 (単位:100万米ドル・1,000台)
- 2,500馬力以上:地域別の動向と予測 (単位:100万米ドル・1,000台)
- 地域別の分析
- 北米の水圧破砕用フルードエンド市場:国別分析
- 欧州の水圧破砕用フルードエンド市場:国別分析
- アジア太平洋の水圧破砕用フルードエンド市場:国別分析
- その他の地域 (ROW) の水圧破砕用フルードエンド市場:国別分析
第5章 競合分析
- 競合の程度 (市場再編に基づく競合の現段階)
- 競合情勢 (重要指標に基づく主要企業のベンチマーク)
- 市場シェア分析 (主要企業と各社のシェア)
- 製品ポートフォリオのマッピング (各種の市場カテゴリーにおける製品の存在感のマッピング)
- 地理的存在 (地理的存在を地図に表示)
- 製品開発の主要ターゲット領域 (開発中の業界の焦点を理解する)
- 企業合併・買収 (M&A)、合弁事業 (JV)、事業協力、戦略提携など (すべての主要なM&A・JVのマッピング)
- ポーターのファイブフォース分析 (競合情勢全体の鳥瞰図)
第6章 戦略的成長機会
- 市場の求心力の分析
- 市場の求心力:材料別
- 市場の求心力:エンドユーザーの種類別
- 市場の求心力:デザインの種類別
- 市場の求心力:馬力別
- 市場の求心力:地域別
- 市場の求心力:国別
- 新たな動向 (将来の市場力学を形成する可能性のある主要な動向)
- 重要な戦略的影響 (変化する市場力学とその重要な影響)
- 主要成功要因 (KSF) (企業のビジネス獲得に役立つ可能性のある、一部の要因の特定)
第7章 主要企業のプロファイル (アルファベット順)
- Caterpillar Inc.
- Dragon Products Ltd.
- Forum Energy Technologies, Inc.
- GD Energy Products, LLC
- Halliburton
- Kerr Pumps
- ST9 Gas+Oil
- TechnipFMC plc
- VP Sales & Manufacturing
- VULCAN Industrial Holdings
第8章 付録
The Fracking Fluid End Market will experience a promising CAGR of 4.2% in the long term to reach $734.7 Million by 2028.
Hydraulic fracturing, the technique used for the production of oil and natural gas, uses frac pumps to transmit the fracking fluid into the wellbore. Each frac fleet uses several frac pumps. Typically, 18-20 frac pumps are used per frac fleet. These pumps consist of two major components, the power end and the fluid end.
Responsible for the high-pressure injection of the fluid into the well, these fluid ends are not only an essential part of the frac pumps but are also an indispensable component of the pressure pumping market. The lifespan of a fluid end decreases with the use of recycled water, advanced chemicals & slickwater, and the quality of frac sand pumped through it. Stainless steel fluid ends offer a longer lifespan, ranging from 1,000 to 5,000 pumping hours, compared to carbon steel fluid ends (100 to 500 pumping hours). Due to this fact, the fluid ends market offers attractive opportunities to manufacturers despite accounting for ~30% only of the total pump's cost.
The year 2020 brought up two major setbacks for the oil & gas industry: The price war between Russia and Saudi Arabia and COVID-19. The disagreement between Russia and Saudi Arabia on the reduction of oil production resulted in a more than 30% plunge in oil prices to below US$ 30 per barrel. The decline in oil prices has a major impact on the American shale industry as fracking becomes unprofitable at oil prices less than US$ 40 per barrel. The market for fracking fluid end, a sizeable market, was not immune to these trends and saw a significant decrease of more than 35% in 2020.
However, the price of crude oil is again back on track with the recovery from the pandemic. Recent changes in geopolitical conditions affected the supply demand dynamics. As a result, there was a spike in the price of crude oil and natural gas. According to EIA projections (June 2023), the average oil price is expected to stabilize at $79.5 per barrel in 2023 and is forecast to reach $83.5 per barrel in 2024.
Increasing oil demand is expected to lead to a surge in fracking activities, driving higher demand for fluid ends and propelling market growth alongside the rising number of frac stages in North America.
Segment Analysis
By Material Type
The fracking fluid end market is segmented into carbon steel and stainless steel. Stainless steel is likely to maintain its dominance in the market during the forecast period and is also likely to grow at a higher rate during the same period in the wake of its corrosion-resistant property and longer pumping hours as compared to carbon fluid end.
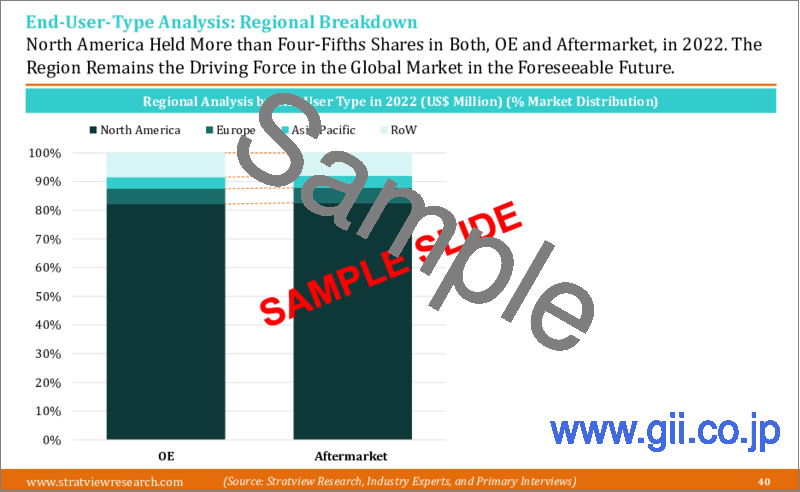
By End-User Type
The market is segmented into OE and aftermarket. Aftermarket not only governed the fracking fluid end market in 2022 but is also estimated to remain the fastest-growing end-user type during the forecast period. The lifespan of fluid ends gets shorter with the harsher fracking environment, a larger volume of proppant used, and rising pumping pressure resulting in increasing replacement of fluid ends in existing frac pumps. While the power end lasts for two years, fluid ends need to be replaced three to four times per year (approx.).
By Horsepower Type
The market is segmented into 2000-2500 HP and above 2500 HP. In 2022, fluid ends compatible with frac pumps of horsepower between 2000-2500 held a major share of the market. The above 2500 horsepower segment is expected to grow at a higher rate during the forecast period, driven by the gradual shift in demand towards higher horsepower pumps to reduce the number of assets on the site while extending the parts' life. For example, 11 units of 5,000 HP fracking pumps can do the job of 20 units of 2,500 HP frac pumps.
Regional Analysis
In terms of regions, North America is projected to remain the largest market during the forecast period primarily because of the presence of high technically recoverable reserves of shale oil & gas and the presence of major fluid end manufacturers in the region. The rise in the number of hydraulic frac stages in North America has resulted in a notable increase in high hydraulic pressure (HHP) requirements at well sites, subsequently driving the demand for fluid ends. Asia-Pacific is expected to witness the highest growth in the market during the forecast period, mainly driven by China. The country has increased its investments in the exploration and production of oil & natural gas, using the hydraulic fracking technique.
Key Players
The market is fairly consolidated with the presence of a handful of regional and global players. Most of the major players compete on some of the governing factors including price, product offerings, regional presence, etc. The following are the key players in the fracking fluid end market.
GD Energy Products, LLC
Caterpillar, Inc.
TechnipFMC plc
Kerr Pumps
Forum Energy Technologies, Inc.
Research Methodology
This report provides market intelligence in the most comprehensive way. The report structure has been kept such that it offers maximum business value. It provides critical insights into the market dynamics and will enable strategic decision-making for the existing market players as well as those willing to enter the market.
The fracking fluid end market is segmented into the following categories-
By Material Type
Carbon Steel
Stainless Steel
By End-User Type
OE
Aftermarket
By Design Type
Quintuplex
Triplex
By Horsepower Type
2000-2500 HP
Above 2500 HP
By Region
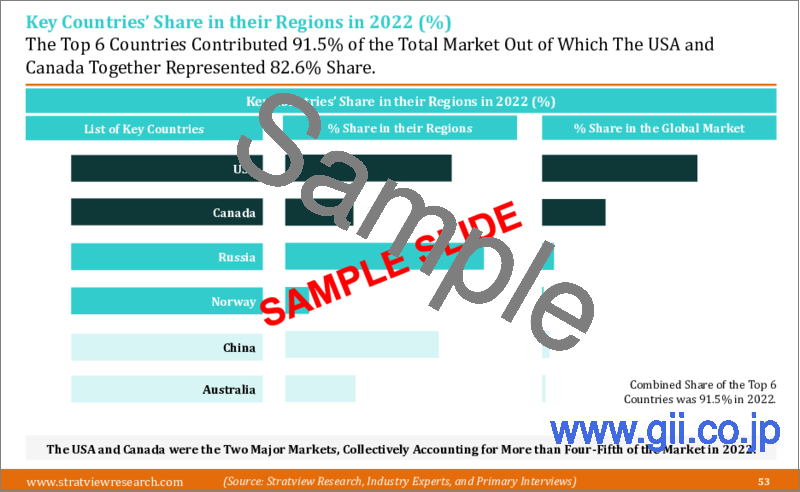
North America (Country Analysis: The USA and Canada)
Europe (Country Analysis: Russia, Norway, and Rest of Europe)
Asia-Pacific (Country Analysis: China, Australia, and Rest of Asia-Pacific)
Rest of the World (Country Analysis: The Middle East, Latin America, and Others)
Table of Contents
- Report Scope
- Report Objectives
- Research Methodology
- Market Segmentation
- Secondary Research
- Key Information Gathered from Secondary Research
- Primary Research
- Key Information Gathered from Primary Research
- Breakdown of Primary Interviews by Region, Designation, and Value Chain Node
- Data Analysis and Triangulation
1. Executive Summary: A Bird's Eye View of the Market
2. Market Environment Analysis: Study of Factors Affecting the Market Dynamics
- 2.1. Supply Chain Analysis (Identification of Key Players/Materials across the Value Chain)
- 2.2. PEST Analysis (List of All Factors Directly or Indirectly Affecting the Market Demand)
- 2.3. Industry Life Cycle Analysis (Current and Future Lifecycle Stage of the Market)
- 2.4. Key Trends (Key Industry as well as Market Trends Shaping the Market Dynamics)
- 2.5. Market Drivers (Study of Drivers and their Short- and Long-Term Impacts)
- 2.6. Market Challenges (Study of Factors Hindrance the Adoption/Growth)
3. Fracking Fluid End Market Assessment (2017-2028) (US$ Million & Thousand Units)
- 3.1. Fracking Fluid End Market Trend and Forecast (US$ Million & Thousand Units)
- 3.2. Market Forecast Scenario Analysis (Pessimistic, Most Likely, and Optimistic Market Forecast)
4. Fracking Fluid End Market Segments' Analysis (2017-2028) (US$ Million & Thousand Units)
- 4.1. Material-Type Analysis
- 4.1.1. Carbon Steel: Regional Trend and Forecast (US$ Million & Thousand Units)
- 4.1.2. Stainless Steel: Regional Trend and Forecast (US$ Million & Thousand Units)
- 4.2. End-User-Type Analysis
- 4.2.1. OE: Regional Trend and Forecast (US$ Million & Thousand Units)
- 4.2.2. Aftermarket: Regional Trend and Forecast (US$ Million & Thousand Units)
- 4.3. Design-Type Analysis
- 4.3.1. Quintuplex: Regional Trend and Forecast (US$ Million & Thousand Units)
- 4.3.2. Triplex: Regional Trend and Forecast (US$ Million & Thousand Units)
- 4.4. Horsepower-Type Analysis
- 4.4.1. 2000-2500 HP: Regional Trend and Forecast (US$ Million & Thousand Units)
- 4.4.2. Above 2500 HP: Regional Trend and Forecast (US$ Million & Thousand Units)
- 4.5. Regional Analysis
- 4.5.1. North American Fracking Fluid End Market: Country Analysis
- 4.5.1.1. The USA's Fracking Fluid End Market T&F (US$ Million & Thousand Units)
- 4.5.1.2. Canadian Fracking Fluid End Market T&F (US$ Million & Thousand Units)
- 4.5.2. European Fracking Fluid End Market: Country Analysis
- 4.5.2.1. Russian Fracking Fluid End Market T&F (US$ Million & Thousand Units)
- 4.5.2.2. Norwegian Fracking Fluid End Market T&F (US$ Million & Thousand Units)
- 4.5.2.3. Rest of the European Fracking Fluid End Market T&F (US$ Million & Thousand Units)
- 4.5.3. Asia-Pacific's Fracking Fluid End Market: Country Analysis
- 4.5.3.1. Chinese Fracking Fluid End Market T&F (US$ Million & Thousand Units)
- 4.5.3.2. Australian Fracking Fluid End Market T&F (US$ Million & Thousand Units)
- 4.5.3.3. Rest of the Asia-Pacific's Fracking Fluid End Market T&F (US$ Million & Thousand Units)
- 4.5.4. Rest of the World's (RoW) Fracking Fluid End Market: Country Analysis
- 4.5.4.1. The Middle Eastern Fracking Fluid End Market T&F (US$ Million & Thousand Units)
- 4.5.4.2. Latin American Fracking Fluid End Market T&F (US$ Million & Thousand Units)
- 4.5.4.3. Other Fracking Fluid End Market T&F (US$ Million & Thousand Units)
- 4.5.1. North American Fracking Fluid End Market: Country Analysis
5. Competitive Analysis
- 5.1. Degree of Competition (Current Stage of Competition based on Market Consolidation)
- 5.2. Competitive Landscape (Benchmarking of Key Players in Crucial Parameters)
- 5.3. Market Share Analysis (Key Players and their Respective Shares)
- 5.4. Product Portfolio Mapping (Map their Presence in Different Market Categories)
- 5.5. Geographical Presence (Map their Geographical Presence)
- 5.6. Key Target Areas for Product Developments (Understand the Industry Focus while Developments)
- 5.7. M&As, JVs, Collaborations, Strategic Alliances, etc. (Map All the Major M&As and JVs)
- 5.8. Porter's Five Forces Analysis (A Bird's Eye View of the Overall Competitive Landscape)
6. Strategic Growth Opportunities
- 6.1. Market Attractiveness Analysis
- 6.1.1. Market Attractiveness by Material Type
- 6.1.2. Market Attractiveness by End-User Type
- 6.1.3. Market Attractiveness by Design Type
- 6.1.4. Market Attractiveness by Horsepower Type
- 6.1.5. Market Attractiveness by Region
- 6.1.6. Market Attractiveness by Country
- 6.2. Emerging Trends (Key Trends that May Shape the Market Dynamics in the Future)
- 6.3. Key Strategic Implications (Changing Market Dynamics and their Key Implications)
- 6.4. Key Success Factors (KSFs) (Identifying Some Factors that May Help Companies to Gain Business)
7. Company Profile of Key Players (Alphabetically Arranged)
- 7.1. Caterpillar Inc.
- 7.2. Dragon Products Ltd.
- 7.3. Forum Energy Technologies, Inc.
- 7.4. GD Energy Products, LLC
- 7.5. Halliburton
- 7.6. Kerr Pumps
- 7.7. ST9 Gas + Oil
- 7.8. TechnipFMC plc
- 7.9. VP Sales & Manufacturing
- 7.10. VULCAN Industrial Holdings
8. Appendix
- 8.1. Disclaimer
- 8.2. Copyright
- 8.3. Abbreviation
- 8.4. Currency Exchange
- 8.5. Market Number
