|
|
市場調査レポート
商品コード
1494903
EaaS(Energy as a Service)市場の2030年までの予測: サービスタイプ別、エンドユーザー別、地域別の世界分析Energy as a Service Market Forecasts to 2030 - Global Analysis By Service Type, End User and By Geography |
||||||
|
|||||||
カスタマイズ可能
|
|||||||


| EaaS(Energy as a Service)市場の2030年までの予測: サービスタイプ別、エンドユーザー別、地域別の世界分析 |
|
出版日: 2024年06月06日
発行: Stratistics Market Research Consulting
ページ情報: 英文 200+ Pages
納期: 2~3営業日
|

全表示
- 概要
- 図表
- 目次
Stratistics MRCによると、EaaS(Energy as a Service)の世界市場は2024年に815億米ドルを占め、予測期間中のCAGRは12.3%で成長し、2030年には1,636億米ドルに達すると予測されています。
EaaS(Energy as a Service)とは、エネルギー製品をそのまま販売するのではなく、エネルギーサービスをサブスクリプションベースのソリューションとして顧客に提供するビジネスモデルです。EaaSには、エネルギー供給、効率改善、再生可能エネルギー統合など、さまざまなサービスが含まれます。EaaSは、エネルギー利用の最適化、コスト削減、環境への影響の軽減を目指すと同時に、進化するエネルギーニーズに対応する柔軟性と拡張性を提供します。
IEAによると、世界の電力需要は2023年には緩やかに増加したが、2026年までは年平均3.4%増と成長が加速する見通しです。
持続可能性への関心の高まり
環境への関心が高まり、気候変動を緩和するための規制が厳しくなる中、企業は持続可能なエネルギー・ソリューションを優先するようになっています。EaaSは、再生可能エネルギー源の統合を促進し、エネルギー消費を最適化し、カーボンフットプリントを削減することで、持続可能性の目標を達成する道筋を提供します。これは企業の持続可能性イニシアティブに合致し、業務効率と競合を強化しながら環境課題に対処する戦略的アプローチとしてEaaSの採用を推進しています。
導入の複雑さ
EaaSソリューションの導入には、エネルギー・プロバイダー、テクノロジー・ベンダー、エンドユーザーなど、さまざまな利害関係者の調整が必要な場合が多く、これは難しい課題です。さらに、特定のエネルギー・ニーズを満たすためのソリューションのカスタマイズや、規制要件への対応が、さらなる複雑さを増しています。これらの導入課題を克服するには、多大な専門知識、リソース、時間が必要となるため、EaaSの導入が遅れる可能性があります。
柔軟性と拡張性
EaaSモデルは、企業や業界特有のエネルギーニーズに合わせてカスタマイズできる、適応性の高いソリューションを提供します。需要の変動や要件の変化に応じてサービスを増減できるため、顧客は費用対効果が高く、カスタマイズされたエネルギー・ソリューションを利用できます。この柔軟性は、顧客満足度を高めるだけでなく、長期的な関係を育み、EaaSプロバイダーがより幅広い市場シェアを獲得することを可能にします。
データのプライバシーとセキュリティへの懸念
EaaSは、機密性の高いエネルギー消費データの収集と分析を伴う。データ漏洩、不正アクセス、情報の悪用などのリスクが高まる。独自のエネルギー・データが流出する可能性は、EaaSプロバイダーと顧客の双方にとって、競合上の不利、金銭的損失、風評被害につながる可能性があります。さらに、GDPRやCCPAなどの厳格な規制要件により、強固なデータ保護対策が必要となり、コンプライアンスコストと複雑性が増大します。
COVID-19の影響:
COVID-19の流行は、サプライチェーンを混乱させ、プロジェクトを遅らせ、エネルギー効率と持続可能性イニシアティブへの投資を減少させることで、EaaS(Energy as a Service)市場に影響を与えています。封鎖措置と経済の不確実性により、商業・産業部門からの需要は減少しました。しかし、回復への努力と、レジリエンス(回復力)とコスト削減への再注力が相まって、パンデミック後の市場回復を促進すると予想されます。
予測期間中、エネルギー供給サービス分野が最大になる見込み
エネルギー供給サービス分野は、予測期間中、EaaS(Energy as a Service)市場で最大規模になると予測されます。この優位性は、様々な産業において信頼性が高く持続可能なエネルギー源に対する需要が増加していることに起因しています。エネルギー供給サービスには、電力、天然ガス、再生可能エネルギーの供給が含まれ、企業や家庭の多様なエネルギーニーズに対応しています。さらに、再生可能エネルギー技術の進歩や有利な政府政策が、このセグメントの成長を後押ししています。
予測期間中にCAGRが最も高くなると予測されるのは商業部門です。
予測期間中、EaaS(Energy as a Service)市場で最も高い成長率を示すと予測されるのは商業部門です。この成長の原動力は、エネルギー効率と持続可能性に関する企業の意識の高まりです。オフィスビル、小売店、ホスピタリティ施設などの商業施設では、運用コストの削減、環境性能の向上、規制要件の遵守を目的としたEaaS(Energy as a Service)・ソリューションの導入が増加しており、これが同分野の急拡大の原動力となっています。
最大のシェアを占める地域:
予測期間中、EaaS(Energy as a Service)市場では北米が最大の市場シェアを占めると予想されます。この優位性は、同地域のエネルギー効率重視の姿勢、支持的な規制枠組み、先進エネルギー技術の普及など、いくつかの要因によるものです。さらに、再生可能エネルギー・プロジェクトへの投資の増加や、老朽化したインフラの近代化への取り組みが、市場の成長をさらに後押ししています。さらに、持続可能性と二酸化炭素排出量削減への注目が高まっていることも、同地域におけるenergy-as-a-serviceソリューションの需要を後押ししています。
CAGRが最も高い地域:
アジア太平洋地域は、人口急増、急速な都市化、工業化の進展によりエネルギー需要が増加しており、EaaS(Energy as a Service)市場の急成長が予測されます。さらに、中国やインドなどの各国政府は、環境問題に対処し持続可能な目標を達成するため、エネルギー効率と再生可能エネルギーの導入を推進しています。こうした取り組みが、支援政策やインフラ投資と相まって、同地域におけるEaaS(Energy as a Service)市場の急速な拡大を促す環境を作り出しています。
無料のカスタマイズサービス:
本レポートをご購読のお客様には、以下の無料カスタマイズオプションのいずれかをご利用いただけます:
- 企業プロファイル
- 追加市場プレイヤーの包括的プロファイリング(3社まで)
- 主要企業のSWOT分析(3社まで)
- 地域セグメンテーション
- 顧客の関心に応じた主要国の市場推計・予測・CAGR(注:フィージビリティチェックによる)
- 競合ベンチマーキング
- 製品ポートフォリオ、地理的プレゼンス、戦略的提携に基づく主要企業のベンチマーキング
目次
第1章 エグゼクティブサマリー
第2章 序文
- 概要
- ステークホルダー
- 調査範囲
- 調査手法
- データマイニング
- データ分析
- データ検証
- 調査アプローチ
- 調査情報源
- 1次調査情報源
- 2次調査情報源
- 前提条件
第3章 市場動向分析
- 促進要因
- 抑制要因
- 機会
- 脅威
- エンドユーザー分析
- 新興市場
- COVID-19の影響
第4章 ポーターのファイブフォース分析
- 供給企業の交渉力
- 買い手の交渉力
- 代替品の脅威
- 新規参入業者の脅威
- 競争企業間の敵対関係
第5章 世界のEaaS(Energy as a Service)市場:サービスタイプ別
- エネルギー供給サービス
- 電力供給
- 天然ガス供給
- 再生可能エネルギー供給
- エネルギー効率サービス
- エネルギー監査とコンサルティング
- エネルギー管理ソフトウェア
- ビルエネルギー管理システム(BEMS)
- 運用・保守サービス
- 設備保全
- パフォーマンスの監視と最適化
第6章 世界のEaaS(Energy as a Service)市場:エンドユーザー別
- 産業部門
- 製造業
- 鉱業
- 建設
- その他の産業部門
- 商業部門
- オフィスビル
- 小売店
- ホスピタリティ業界
- その他の商業部門
- 公的機関
- 住宅部門
第7章 世界のEaaS(Energy as a Service)市場:地域別
- 北米
- 米国
- カナダ
- メキシコ
- 欧州
- ドイツ
- 英国
- イタリア
- フランス
- スペイン
- その他欧州
- アジア太平洋地域
- 日本
- 中国
- インド
- オーストラリア
- ニュージーランド
- 韓国
- その他アジア太平洋地域
- 南米
- アルゼンチン
- ブラジル
- チリ
- その他南米
- 中東・アフリカ
- サウジアラビア
- アラブ首長国連邦
- カタール
- 南アフリカ
- その他中東とアフリカ
第8章 主な発展
- 契約、パートナーシップ、コラボレーション、合弁事業
- 買収と合併
- 新製品発売
- 事業拡大
- その他の主要戦略
第9章 企業プロファイリング
- Siemens AG
- Johnson Controls International plc
- Honeywell International Inc.
- Schneider Electric SE
- General Electric Company(GE)
- ENGIE SA
- Enel X
- Ameresco, Inc.
- Centrica plc
- Trane Technologies plc
- Veolia
- WGL Energy Services
- Constellation Energy
- Engie Impact
- NRG Energy, Inc.
- Edison Energy
- SmartWatt
- Sparkfund
- Noresco
- Clearway Energy Group
List of Tables
- Table 1 Global Energy as a Service Market Outlook, By Region (2022-2030) ($MN)
- Table 2 Global Energy as a Service Market Outlook, By Service Type (2022-2030) ($MN)
- Table 3 Global Energy as a Service Market Outlook, By Energy Supply Services (2022-2030) ($MN)
- Table 4 Global Energy as a Service Market Outlook, By Electricity Supply (2022-2030) ($MN)
- Table 5 Global Energy as a Service Market Outlook, By Natural Gas Supply (2022-2030) ($MN)
- Table 6 Global Energy as a Service Market Outlook, By Renewable Energy Supply (2022-2030) ($MN)
- Table 7 Global Energy as a Service Market Outlook, By Energy Efficiency Services (2022-2030) ($MN)
- Table 8 Global Energy as a Service Market Outlook, By Energy Auditing and Consulting (2022-2030) ($MN)
- Table 9 Global Energy as a Service Market Outlook, By Energy Management Software (2022-2030) ($MN)
- Table 10 Global Energy as a Service Market Outlook, By Building Energy Management Systems (BEMS) (2022-2030) ($MN)
- Table 11 Global Energy as a Service Market Outlook, By Operation and Maintenance Services (2022-2030) ($MN)
- Table 12 Global Energy as a Service Market Outlook, By Equipment Maintenance (2022-2030) ($MN)
- Table 13 Global Energy as a Service Market Outlook, By Performance Monitoring and Optimization (2022-2030) ($MN)
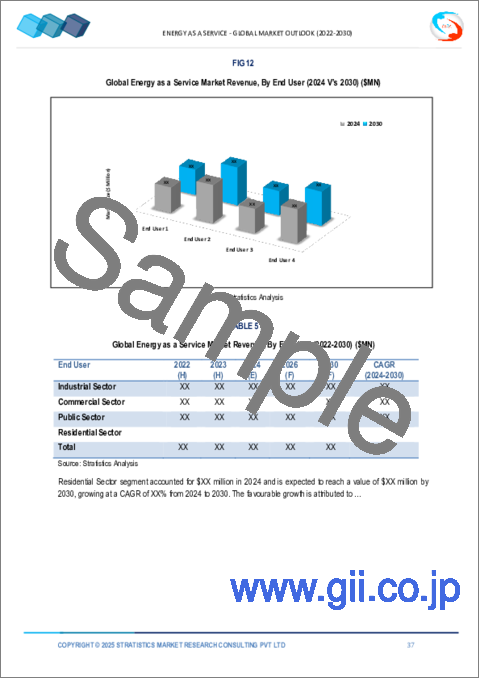
- Table 14 Global Energy as a Service Market Outlook, By End User (2022-2030) ($MN)
- Table 15 Global Energy as a Service Market Outlook, By Industrial Sector (2022-2030) ($MN)
- Table 16 Global Energy as a Service Market Outlook, By Manufacturing (2022-2030) ($MN)
- Table 17 Global Energy as a Service Market Outlook, By Mining (2022-2030) ($MN)
- Table 18 Global Energy as a Service Market Outlook, By Construction (2022-2030) ($MN)
- Table 19 Global Energy as a Service Market Outlook, By Other Industrial Sector (2022-2030) ($MN)
- Table 20 Global Energy as a Service Market Outlook, By Commercial Sector (2022-2030) ($MN)
- Table 21 Global Energy as a Service Market Outlook, By Office Buildings (2022-2030) ($MN)
- Table 22 Global Energy as a Service Market Outlook, By Retail Stores (2022-2030) ($MN)
- Table 23 Global Energy as a Service Market Outlook, By Hospitality Industry (2022-2030) ($MN)
- Table 24 Global Energy as a Service Market Outlook, By Other Commercial Sector (2022-2030) ($MN)
- Table 25 Global Energy as a Service Market Outlook, By Public Sector (2022-2030) ($MN)
- Table 26 Global Energy as a Service Market Outlook, By Residential Sector (2022-2030) ($MN)
Note: Tables for North America, Europe, APAC, South America, and Middle East & Africa Regions are also represented in the same manner as above.
According to Stratistics MRC, the Global Energy as a Service Market is accounted for $81.5 billion in 2024 and is expected to reach $163.6 billion by 2030 growing at a CAGR of 12.3% during the forecast period. Energy as a Service (EaaS) is a business model where energy services are provided to customers as a subscription-based solution rather than selling energy products outright. It encompasses a range of services, including energy supply, efficiency improvements, and renewable energy integration. EaaS aims to optimize energy usage, reduce costs, and mitigate environmental impact while providing flexibility and scalability to meet evolving energy needs.
According to the IEA, global electricity demand rose moderately in 2023 but is set to grow faster through 2026, at an average of 3.4% annually.
Market Dynamics:
Driver:
Increasing focus on sustainability
With rising environmental concerns and stringent regulations to mitigate climate change, businesses are prioritizing sustainable energy solutions. EaaS offers a pathway to achieving sustainability goals by facilitating the integration of renewable energy sources, optimizing energy consumption, and reducing carbon footprints. This aligns with corporate sustainability initiatives, driving the adoption of EaaS as a strategic approach to address environmental challenges while enhancing operational efficiency and competitiveness.
Restraint:
Complexity of implementation
Implementing EaaS solutions often involves coordinating various stakeholders, including energy providers, technology vendors, and end-users, which can be challenging. Additionally, customization of solutions to meet specific energy needs and navigating regulatory requirements add further complexity. Overcoming these implementation challenges requires significant expertise, resources, and time, potentially slowing down EaaS adoption.
Opportunity:
Flexibility and scalability
EaaS models offer adaptable solutions that can be tailored to meet the unique energy needs of businesses and industries. The ability to scale services up or down based on demand fluctuations and evolving requirements provides customers with cost-effective and customized energy solutions. This flexibility not only enhances customer satisfaction but also fosters long-term relationships and enables EaaS providers to capture a broader market share.
Threat:
Data privacy and security concerns
EaaS involves the collection and analysis of sensitive energy consumption data. There are heightened risks of data breaches, unauthorized access, and misuse of information. The potential exposure of proprietary energy data can lead to competitive disadvantages, financial losses, and reputational damage for both EaaS providers and customers. Additionally, stringent regulatory requirements, such as GDPR and CCPA, necessitate robust data protection measures, increasing compliance costs and complexity.
Covid-19 Impact:
The COVID-19 pandemic has affected the energy as a service market by disrupting supply chains, delaying projects, and reducing investments in energy efficiency and sustainability initiatives. Lockdown measures and economic uncertainties have led to decreased demand from the commercial and industrial sectors. However, recovery efforts, coupled with a renewed focus on resilience and cost savings, are expected to drive a market rebound post-pandemic.
The energy supply services segment is expected to be the largest during the forecast period
The energy supply services segment is projected to emerge as the largest in the energy as a service market during the forecast period. This dominance is attributed to the increasing demand for reliable and sustainable energy sources across various industries. Energy supply services encompass electricity, natural gas, and renewable energy supply, catering to the diverse energy needs of businesses and households. Moreover, advancements in renewable energy technologies and favorable government policies drive the growth of this segment.
The commercial sector segment is expected to have the highest CAGR during the forecast period
The commercial sector segment is forecasted to exhibit the highest growth rate in the energy as a service market during the projected period. This growth is fueled by increasing awareness among businesses about energy efficiency and sustainability. Commercial entities, including office buildings, retail stores, and hospitality establishments, are increasingly adopting energy as a service solutions to reduce operational costs, enhance environmental performance, and comply with regulatory requirements, thus driving the segment's rapid expansion.
Region with largest share:
North America is anticipated to hold the largest market share in the energy as a service market during the forecast period. This dominance is attributed to several factors, including the region's strong emphasis on energy efficiency, supportive regulatory frameworks, and the widespread adoption of advanced energy technologies. Additionally, increasing investments in renewable energy projects and initiatives to modernize aging infrastructure further bolster market growth. Moreover, a growing focus on sustainability and reducing carbon emissions drives demand for energy-as-a service solutions in the region.
Region with highest CAGR:
The Asia Pacific region foresees rapid growth in the energy as a service market owing to the region's burgeoning population, rapid urbanization, and increasing industrialization, which drive up energy demand. Additionally, governments in countries like China and India are promoting energy efficiency and renewable energy adoption to address environmental concerns and meet sustainability goals. These initiatives, combined with supportive policies and investments in infrastructure, create a conducive environment for the rapid expansion of the energy as a service market in the region.
Key players in the market
Some of the key players in Energy as a Service Market include Siemens AG, Johnson Controls International plc, Honeywell International Inc., Schneider Electric SE, General Electric Company (GE), ENGIE SA, Enel X, Ameresco, Inc., Centrica plc, Trane Technologies plc, Veolia, WGL Energy Services, Constellation Energy, Engie Impact, NRG Energy, Inc., Edison Energy, SmartWatt, Sparkfund, Noresco and Clearway Energy Group.
Key Developments:
In April 2024, Siemens and Mercedes-Benz Transform Future of Sustainable Factory Planning with Digital Energy Twin. Under a strategic partnership between Siemens and Mercedes-Benz AG, the companies have co-created a Digital Energy Twin to improve the integration of energy efficiency and sustainability measures in factory designs and upgrades.
In February 2024, Schneider Electric, the leader in the digital transformation of energy management and automation, today announced that it has committed to invest in a portfolio of Texas-based clean energy projects utilizing a Tax Credit Transfer Agreement (TCTA) for solar and battery storage systems developed, built, and operated by ENGIE North America (ENGIE).
In January 2024, Honeywell and NXP(R) Semiconductors N.V. announced at CES 2024 that they have signed a Memorandum of Understanding (MOU) to help optimise the way commercial buildings sense and securely control energy consumption.
Service Types Covered:
- Energy Supply Services
- Energy Efficiency Services
- Operation and Maintenance Services
End Users Covered:
- Industrial Sector
- Commercial Sector
- Public Sector
- Residential Sector
Regions Covered:
- North America
- US
- Canada
- Mexico
- Europe
- Germany
- UK
- Italy
- France
- Spain
- Rest of Europe
- Asia Pacific
- Japan
- China
- India
- Australia
- New Zealand
- South Korea
- Rest of Asia Pacific
- South America
- Argentina
- Brazil
- Chile
- Rest of South America
- Middle East & Africa
- Saudi Arabia
- UAE
- Qatar
- South Africa
- Rest of Middle East & Africa
What our report offers:
- Market share assessments for the regional and country-level segments
- Strategic recommendations for the new entrants
- Covers Market data for the years 2022, 2023, 2024, 2026, and 2030
- Market Trends (Drivers, Constraints, Opportunities, Threats, Challenges, Investment Opportunities, and recommendations)
- Strategic recommendations in key business segments based on the market estimations
- Competitive landscaping mapping the key common trends
- Company profiling with detailed strategies, financials, and recent developments
- Supply chain trends mapping the latest technological advancements
Free Customization Offerings:
All the customers of this report will be entitled to receive one of the following free customization options:
- Company Profiling
- Comprehensive profiling of additional market players (up to 3)
- SWOT Analysis of key players (up to 3)
- Regional Segmentation
- Market estimations, Forecasts and CAGR of any prominent country as per the client's interest (Note: Depends on feasibility check)
- Competitive Benchmarking
- Benchmarking of key players based on product portfolio, geographical presence, and strategic alliances
Table of Contents
1 Executive Summary
2 Preface
- 2.1 Abstract
- 2.2 Stake Holders
- 2.3 Research Scope
- 2.4 Research Methodology
- 2.4.1 Data Mining
- 2.4.2 Data Analysis
- 2.4.3 Data Validation
- 2.4.4 Research Approach
- 2.5 Research Sources
- 2.5.1 Primary Research Sources
- 2.5.2 Secondary Research Sources
- 2.5.3 Assumptions
3 Market Trend Analysis
- 3.1 Introduction
- 3.2 Drivers
- 3.3 Restraints
- 3.4 Opportunities
- 3.5 Threats
- 3.6 End User Analysis
- 3.7 Emerging Markets
- 3.8 Impact of Covid-19
4 Porters Five Force Analysis
- 4.1 Bargaining power of suppliers
- 4.2 Bargaining power of buyers
- 4.3 Threat of substitutes
- 4.4 Threat of new entrants
- 4.5 Competitive rivalry
5 Global Energy as a Service Market, By Service Type
- 5.1 Introduction
- 5.2 Energy Supply Services
- 5.2.1 Electricity Supply
- 5.2.2 Natural Gas Supply
- 5.2.3 Renewable Energy Supply
- 5.3 Energy Efficiency Services
- 5.3.1 Energy Auditing and Consulting
- 5.3.2 Energy Management Software
- 5.3.3 Building Energy Management Systems (BEMS)
- 5.4 Operation and Maintenance Services
- 5.4.1 Equipment Maintenance
- 5.4.2 Performance Monitoring and Optimization
6 Global Energy as a Service Market, By End User
- 6.1 Introduction
- 6.2 Industrial Sector
- 6.2.1 Manufacturing
- 6.2.2 Mining
- 6.2.3 Construction
- 6.2.4 Other Industrial Sector
- 6.3 Commercial Sector
- 6.3.1 Office Buildings
- 6.3.2 Retail Stores
- 6.3.3 Hospitality Industry
- 6.3.4 Other Commercial Sector
- 6.4 Public Sector
- 6.5 Residential Sector
7 Global Energy as a Service Market, By Geography
- 7.1 Introduction
- 7.2 North America
- 7.2.1 US
- 7.2.2 Canada
- 7.2.3 Mexico
- 7.3 Europe
- 7.3.1 Germany
- 7.3.2 UK
- 7.3.3 Italy
- 7.3.4 France
- 7.3.5 Spain
- 7.3.6 Rest of Europe
- 7.4 Asia Pacific
- 7.4.1 Japan
- 7.4.2 China
- 7.4.3 India
- 7.4.4 Australia
- 7.4.5 New Zealand
- 7.4.6 South Korea
- 7.4.7 Rest of Asia Pacific
- 7.5 South America
- 7.5.1 Argentina
- 7.5.2 Brazil
- 7.5.3 Chile
- 7.5.4 Rest of South America
- 7.6 Middle East & Africa
- 7.6.1 Saudi Arabia
- 7.6.2 UAE
- 7.6.3 Qatar
- 7.6.4 South Africa
- 7.6.5 Rest of Middle East & Africa
8 Key Developments
- 8.1 Agreements, Partnerships, Collaborations and Joint Ventures
- 8.2 Acquisitions & Mergers
- 8.3 New Product Launch
- 8.4 Expansions
- 8.5 Other Key Strategies
9 Company Profiling
- 9.1 Siemens AG
- 9.2 Johnson Controls International plc
- 9.3 Honeywell International Inc.
- 9.4 Schneider Electric SE
- 9.5 General Electric Company (GE)
- 9.6 ENGIE SA
- 9.7 Enel X
- 9.8 Ameresco, Inc.
- 9.9 Centrica plc
- 9.10 Trane Technologies plc
- 9.11 Veolia
- 9.12 WGL Energy Services
- 9.13 Constellation Energy
- 9.14 Engie Impact
- 9.15 NRG Energy, Inc.
- 9.16 Edison Energy
- 9.17 SmartWatt
- 9.18 Sparkfund
- 9.19 Noresco
- 9.20 Clearway Energy Group
