|
|
市場調査レポート
商品コード
1476372
FDC(異常検出・分類)の2030年までの市場予測:異常タイプ、コンポーネント、技術、用途、エンドユーザー、地域別の世界分析Fault Detection and Classification Market Forecasts to 2030 - Global Analysis By Fault Type, Component, Technology, Application, End User and By Geography |
||||||
|
|||||||
カスタマイズ可能
|
|||||||

| FDC(異常検出・分類)の2030年までの市場予測:異常タイプ、コンポーネント、技術、用途、エンドユーザー、地域別の世界分析 |
|
出版日: 2024年05月05日
発行: Stratistics Market Research Consulting
ページ情報: 英文 200+ Pages
納期: 2~3営業日
|

全表示
- 概要
- 図表
- 目次
Stratistics MRCによると、FDC(異常検出・分類)の世界市場は2023年に48億米ドルを占め、予測期間中にCAGR 10.9%で成長し、2030年には100億米ドルに達すると予測されています。
FDC(異常検出・分類)は、エンジニアリング、製造、データ分析など様々な分野で使用される技術や手法の集合であり、システムやプロセスにおける異常や故障を特定・分類します。主な目的は、システムを継続的に監視し、正常動作からの逸脱を検出し、これらの逸脱をその特性に基づいて異なる故障カテゴリーに分類することです。
複雑化する産業プロセス
機械学習、人工知能、ビッグデータ解析のような先進技術は、故障を特定する精度とスピードを高めるために統合されつつあります。この市場動向は、予知保全と事前リスク管理へのシフトを反映しており、産業界がダウンタイムを最小限に抑え、業務効率を改善し、製品品質を確保することを可能にし、最終的にFDC(異常検出・分類)分野の成長を促進しています。そのため、同市場は産業プロセスにおける複雑さの急増を目の当たりにしています。
データプライバシーとセキュリティへの懸念
FDCシステムは、ハッキング、マルウェア、データ操作などのサイバーセキュリティの脅威にさらされやすいです。ソフトウェアやネットワーク・インフラの脆弱性が悪用されると、データの完全性や機密性が損なわれる可能性があります。これらのシステムは、産業プロセス、機器の性能、運用指標に関連する機密データを扱うことが多いです。不正アクセスやデータ漏洩を防ぐためには、このようなデータの安全な取り扱い、保存、送信を保証することが不可欠です。したがって、これらが市場の成長を抑制する要因となっています。
センサー技術の進歩
同市場では、センサー技術が大きく進歩しています。これには、リアルタイムのデータ解析のためのAIアルゴリズムの統合、ウェーブレット変換のような高度な信号処理技術の使用、感度と精度を高めたスマートセンサーの開発などが含まれます。さらに、さまざまなソースからのデータを組み合わせて、より包括的なFDC(異常検出・分類)機能を実現するマルチセンサー・フュージョンシステムへの動向もあります。
熟練した専門家の不足
市場は、熟練した専門家の不足による大きな課題を経験しています。この不足は、業界全体におけるこれらのシステムの効率的な導入と活用を妨げています。故障検出のためのデータ解析と解釈には複雑な専門知識が必要だが、現在の市場にはそれが不足しています。その結果、企業は業務を最適化し、高い信頼性と生産性を維持する上で障害に直面しています。
COVID-19の影響:
COVID-19の大流行は、FDC(異常検出・分類)市場に大きな影響を与えました。産業が混乱と操業低下に直面する中、ソリューションに対する需要は変動しました。当初は、予算の制約とプロジェクトの遅れにより減速しました。しかし、産業が遠隔操作に適応するにつれて、業務の継続性と効率性を確保するためのAI主導型システムの採用が急増しました。このシフトは技術革新を加速させ、より堅牢で適応性の高いソリューションの開発につながった。
予測期間中、表面欠陥セグメントが最大になる見込み
表面欠陥セグメントは予測期間中最大となる見込みです。これらの欠陥は、傷やへこみから亀裂や変色に至るまで、潜在的な製品の不具合や品質問題の指標となります。欠陥検出・分類システム市場では、表面欠陥を正確に識別・分類し、製品品質や業務効率の向上につなげることができるコンピュータビジョンや機械学習アルゴリズムのような先進技術への需要が高まっています。
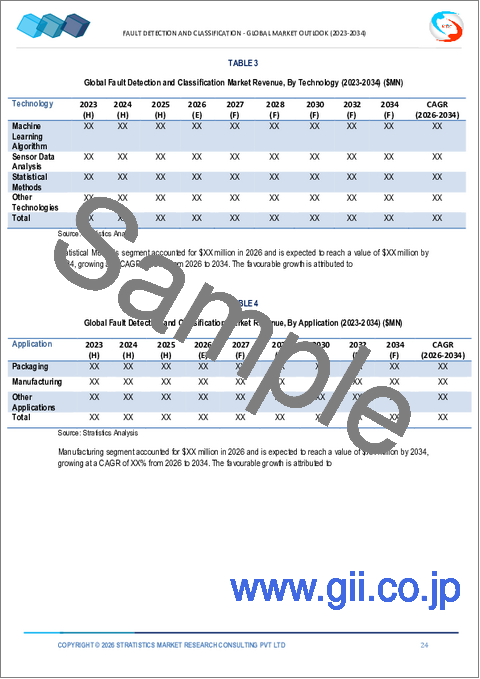
統計的手法セグメントは予測期間中最も高いCAGRが見込まれる
統計的手法分野は、様々な産業で高度な分析ツールの採用が増加していることを背景に、予測期間中のCAGRが最も高くなると予想されます。これらの手法は、複雑なシステムにおける障害を検出・分類する効率的な方法を提供し、タイムリーな介入と保守を保証します。機械学習とデータ分析の進歩により、統計技術はより洗練され、FDC(異常検出・分類)プロセスの精度と信頼性を高めています。
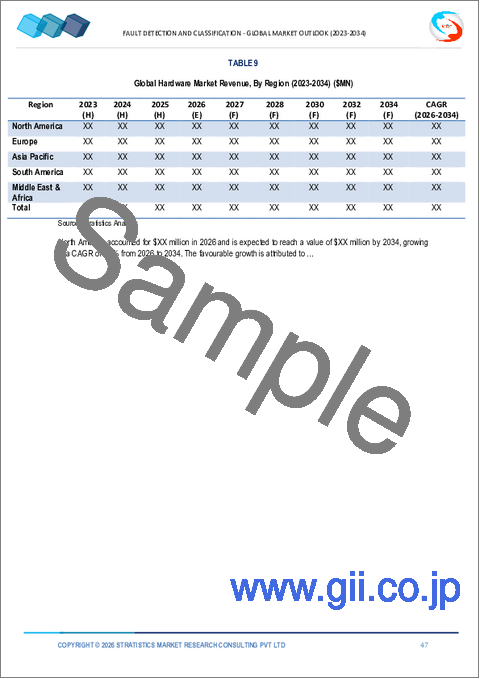
最大のシェアを占める地域
北米は、自動化技術の進歩と効率的な産業プロセスに対する需要の増加により、予測期間中最大の市場シェアを占めると予測されます。主なプレーヤーは、故障検出精度を高め、ダウンタイムを削減するために、洗練されたアルゴリズムとAIを搭載したソリューションの開発に注力しています。製造業、エネルギー、自動車などの産業がシステムの主要な採用者であり、市場拡大にさらに拍車をかけています。
CAGRが最も高い地域:
アジア太平洋地域は、工業化の進展、技術の進歩、効率的な製造プロセスの必要性など、さまざまな要因によって、予測期間中に最も高いCAGRを維持すると予測されます。同市場は、センサー技術、データ分析アルゴリズム、機械学習機能の進歩から恩恵を受けています。これらの進歩により、システムはより堅牢で、正確で、幅広い製造プロセスに適応できるようになった。
無料のカスタマイズサービス:
本レポートをご購読のお客様には、以下の無料カスタマイズオプションのいずれかをご利用いただけます:
- 企業プロファイル
- 追加市場プレイヤーの包括的プロファイリング(3社まで)
- 主要企業のSWOT分析(3社まで)
- 地域セグメンテーション
- 顧客の関心に応じた主要国の市場推計・予測・CAGR(注:フィージビリティチェックによる)
- 競合ベンチマーキング
- 製品ポートフォリオ、地理的プレゼンス、戦略的提携に基づく主要企業のベンチマーキング
目次
第1章 エグゼクティブサマリー
第2章 序文
- 概要
- ステークホルダー
- 調査範囲
- 調査手法
- データマイニング
- データ分析
- データ検証
- 調査アプローチ
- 調査情報源
- 1次調査情報源
- 2次調査情報源
- 前提条件
第3章 市場動向分析
- 促進要因
- 抑制要因
- 機会
- 脅威
- 技術分析
- 用途分析
- エンドユーザー分析
- 新興市場
- COVID-19の影響
第4章 ポーターのファイブフォース分析
- 供給企業の交渉力
- 買い手の交渉力
- 代替品の脅威
- 新規参入業者の脅威
- 競争企業間の敵対関係
第5章 世界のFDC(異常検出・分類)市場:異常タイプ別
- 汚染欠陥
- プロセスの変動性
- 次元の断層
- 表面欠陥
- その他の異常タイプ
第6章 世界のFDC(異常検出・分類)市場:コンポーネント別
- ハードウェア
- 通信インターフェース
- アクチュエータ
- センサー
- 検出器
- 制御ユニット
- ソフトウェア
- サービス
第7章 世界のFDC(異常検出・分類)市場:技術別
- 機械学習アルゴリズム
- センサーデータ分析
- 統計的手法
- その他の技術
第8章 世界のFDC(異常検出・分類)市場:用途別
- パッケージ
- 容器
- グレーディング
- ラベル検証
- 製造業
- 製造検査
- 組み立て検証
- 欠陥検出
- その他の用途
第9章 世界のFDC(異常検出・分類)市場:エンドユーザー別
- 金属・機械
- 医薬品
- 自動車
- 電子・半導体
- 食品
- その他のエンドユーザー
第10章 世界のFDC(異常検出・分類)市場:地域別
- 北米
- 米国
- カナダ
- メキシコ
- 欧州
- ドイツ
- 英国
- イタリア
- フランス
- スペイン
- その他欧州
- アジア太平洋地域
- 日本
- 中国
- インド
- オーストラリア
- ニュージーランド
- 韓国
- その他アジア太平洋地域
- 南米
- アルゼンチン
- ブラジル
- チリ
- その他南米
- 中東・アフリカ
- サウジアラビア
- アラブ首長国連邦
- カタール
- 南アフリカ
- その他中東とアフリカ
第11章 主な発展
- 契約、パートナーシップ、コラボレーション、合弁事業
- 買収と合併
- 新製品発売
- 事業拡大
- その他の主要戦略
第12章 企業プロファイリング
- Teledyne Technologies
- OMRON Corporation
- Microsoft
- Keyence Corporation
- Applied Materials, Inc.
- Synopsys, Inc.
- Cognex Corporation
- Nikon Corporation
- KLA Corporation
- Amazon Web Services, Inc.
- Tokyo Electron Limited
- Siemens
- Datalogic
- BeyondMinds
- Qualitas Technologies.
- Elunic AG
- DNV Group AS
- EinnoSys Technologies Inc.
List of Tables
- Table 1 Global Fault Detection and Classification Market Outlook, By Region (2021-2030) ($MN)
- Table 2 Global Fault Detection and Classification Market Outlook, By Fault Type (2021-2030) ($MN)
- Table 3 Global Fault Detection and Classification Market Outlook, By Contamination Faults (2021-2030) ($MN)
- Table 4 Global Fault Detection and Classification Market Outlook, By Process Variability (2021-2030) ($MN)
- Table 5 Global Fault Detection and Classification Market Outlook, By Dimensional Fault (2021-2030) ($MN)
- Table 6 Global Fault Detection and Classification Market Outlook, By Surface Defects (2021-2030) ($MN)
- Table 7 Global Fault Detection and Classification Market Outlook, By Other Fault Types (2021-2030) ($MN)
- Table 8 Global Fault Detection and Classification Market Outlook, By Component (2021-2030) ($MN)
- Table 9 Global Fault Detection and Classification Market Outlook, By Hardware (2021-2030) ($MN)
- Table 10 Global Fault Detection and Classification Market Outlook, By Communication Interfaces (2021-2030) ($MN)
- Table 11 Global Fault Detection and Classification Market Outlook, By Actuators (2021-2030) ($MN)
- Table 12 Global Fault Detection and Classification Market Outlook, By Sensors (2021-2030) ($MN)
- Table 13 Global Fault Detection and Classification Market Outlook, By Detectors (2021-2030) ($MN)
- Table 14 Global Fault Detection and Classification Market Outlook, By Control Units (2021-2030) ($MN)
- Table 15 Global Fault Detection and Classification Market Outlook, By Software (2021-2030) ($MN)
- Table 16 Global Fault Detection and Classification Market Outlook, By Services (2021-2030) ($MN)
- Table 17 Global Fault Detection and Classification Market Outlook, By Technology (2021-2030) ($MN)
- Table 18 Global Fault Detection and Classification Market Outlook, By Machine Learning Algorithm (2021-2030) ($MN)
- Table 19 Global Fault Detection and Classification Market Outlook, By Sensor Data Analysis (2021-2030) ($MN)
- Table 20 Global Fault Detection and Classification Market Outlook, By Statistical Methods (2021-2030) ($MN)
- Table 21 Global Fault Detection and Classification Market Outlook, By Other Technologies (2021-2030) ($MN)
- Table 22 Global Fault Detection and Classification Market Outlook, By Application (2021-2030) ($MN)
- Table 23 Global Fault Detection and Classification Market Outlook, By Packaging (2021-2030) ($MN)
- Table 24 Global Fault Detection and Classification Market Outlook, By Container (2021-2030) ($MN)
- Table 25 Global Fault Detection and Classification Market Outlook, By Grading (2021-2030) ($MN)
- Table 26 Global Fault Detection and Classification Market Outlook, By Label Validation (2021-2030) ($MN)
- Table 27 Global Fault Detection and Classification Market Outlook, By Manufacturing (2021-2030) ($MN)
- Table 28 Global Fault Detection and Classification Market Outlook, By Fabrication Inspection (2021-2030) ($MN)
- Table 29 Global Fault Detection and Classification Market Outlook, By Assembly Verification (2021-2030) ($MN)
- Table 30 Global Fault Detection and Classification Market Outlook, By Flaw Detection (2021-2030) ($MN)
- Table 31 Global Fault Detection and Classification Market Outlook, By Other Applications (2021-2030) ($MN)
- Table 32 Global Fault Detection and Classification Market Outlook, By End User (2021-2030) ($MN)
- Table 33 Global Fault Detection and Classification Market Outlook, By Metals & Machinery (2021-2030) ($MN)
- Table 34 Global Fault Detection and Classification Market Outlook, By Pharmaceuticals (2021-2030) ($MN)
- Table 35 Global Fault Detection and Classification Market Outlook, By Automotive (2021-2030) ($MN)
- Table 36 Global Fault Detection and Classification Market Outlook, By Electronic and Semiconductor (2021-2030) ($MN)
- Table 37 Global Fault Detection and Classification Market Outlook, By Food (2021-2030) ($MN)
- Table 38 Global Fault Detection and Classification Market Outlook, By Other End Users (2021-2030) ($MN)
Note: Tables for North America, Europe, APAC, South America, and Middle East & Africa Regions are also represented in the same manner as above.
According to Stratistics MRC, the Global Fault Detection and Classification Market is accounted for $4.8 billion in 2023 and is expected to reach $10.0 billion by 2030 growing at a CAGR of 10.9% during the forecast period. Fault Detection and Classification (FDC) is a set of techniques and methodologies used in various fields, such as engineering, manufacturing, and data analysis, to identify and categorize abnormalities or faults in a system or process. The primary goal is to monitor systems continuously, detect any deviations from normal operation, and classify these deviations into different fault categories based on their characteristics.
Market Dynamics:
Driver:
Increasing complexity in industrial processes
Advanced technologies like machine learning, artificial intelligence, and big data analytics are being integrated to enhance the accuracy and speed of identifying faults. This market trend reflects a shift towards predictive maintenance and proactive risk management, enabling industries to minimize downtime, improve operational efficiency, and ensure product quality, ultimately driving growth in the fault detection and classification sector. Therefore, the market is witnessing a surge in complexity within industrial processes.
Restraint:
Data privacy and security concerns
FDC systems are susceptible to cybersecurity threats such as hacking, malware, and data manipulation. Vulnerabilities in software or network infrastructure can be exploited to compromise the integrity and confidentiality of data. These systems often deal with sensitive data related to industrial processes, equipment performance, and operational metrics. Ensuring the secure handling, storage, and transmission of this data is essential to prevent unauthorized access or data breaches. Hence, these are the factors restraining the growth of the market.
Opportunity:
Advancements in sensor technologies
In the market, sensor technologies have witnessed significant advancements. These include the integration of AI algorithms for real-time data analysis, the use of advanced signal processing techniques like wavelet transforms, and the development of smart sensors with enhanced sensitivity and accuracy. Additionally, there's a trend towards multi-sensor fusion systems that combine data from various sources for more comprehensive fault detection and classification capabilities.
Threat:
Lack of skilled professionals
The market is experiencing a significant challenge due to a shortage of skilled professionals. This scarcity hampers the efficient implementation and utilization of these systems across industries. The complexities involved in analyzing and interpreting data for fault detection require specialized expertise, which is currently lacking in the market. As a result, companies face hurdles in optimizing their operations and maintaining high levels of reliability and productivity.
Covid-19 Impact:
The COVID-19 pandemic significantly impacted the Fault Detection and Classification market. With industries facing disruptions and reduced operations, the demand for solutions fluctuated. Initially, there was a slowdown due to budget constraints and project delays. However, as industries adapted to remote operations, there was a surge in the adoption of AI-driven systems to ensure operational continuity and efficiency. This shift accelerated innovation and led to the development of more robust and adaptable solutions.
The surface defects segment is expected to be the largest during the forecast period
The surface defects segment is expected to be the largest during the forecast period. These defects, ranging from scratches and dents to cracks and discoloration, are indicators of potential product failures or quality issues. In the market for fault detection and classification systems, there is a growing demand for advanced technologies like computer vision and machine learning algorithms that can accurately identify and categorize surface defects, leading to improved product quality and operational efficiency.
The statistical methods segment is expected to have the highest CAGR during the forecast period
The statistical methods segment is expected to have the highest CAGR during the forecast period driven by the increasing adoption of advanced analytics tools across various industries. These methods offer efficient ways to detect and classify faults in complex systems, ensuring timely interventions and maintenance. With advancements in machine learning and data analytics, statistical techniques are becoming more sophisticated, providing enhanced accuracy and reliability in fault detection and classification processes.
Region with largest share:
North America is projected to hold the largest market share during the forecast period driven by advancements in automation technologies and increasing demand for efficient industrial processes. Key players are focusing on developing sophisticated algorithms and AI-powered solutions to enhance fault detection accuracy and reduce downtime. Industries such as manufacturing, energy, and automotive are major adopters of the systems, further fueling market expansion.
Region with highest CAGR:
Asia Pacific is projected to hold the highest CAGR over the forecast period driven by various factors such as increasing industrialization, technological advancements, and the need for efficient manufacturing processes. The market has benefited from advancements in sensor technologies, data analytics algorithms, and machine learning capabilities. These advancements have made systems more robust, accurate, and adaptable to a wide range of manufacturing processes.
Key players in the market
Some of the key players in Fault Detection and Classification market include Teledyne Technologies, OMRON Corporation, Microsoft, Keyence Corporation, Applied Materials, Inc., Synopsys, Inc., Cognex Corporation, Nikon Corporation, KLA Corporation, Amazon Web Services, Inc., Tokyo Electron Limited, Siemens, Datalogic, BeyondMinds, Qualitas Technologies., Elunic AG, DNV Group AS and EinnoSys Technologies Inc.
Key Developments:
In August 2023, Synopsys, Inc. launched Synopsys Software Risk Manager, a powerful new application security posture management (ASPM) solution. Software Risk Manager enables security and development teams to simplify, align and streamline their application security testing across projects, teams and application security testing (AST) tools.
In July 2022, Microsoft collaborated with Birlasoft to Establish Generative AI Centre of Excellence, Shares Rebound After Announcement. Birlasoft will utilize Azure OpenAI Service features for product design, process optimization, quality and defect detection, predictive maintenance, and digital twins for the manufacturing sector.
Fault Types Covered:
- Contamination Faults
- Process Variability
- Dimensional Fault
- Surface Defects
- Other Fault Types
Components Covered:
- Hardware
- Software
- Services
Technologies Covered:
- Machine Learning Algorithm
- Sensor Data Analysis
- Statistical Methods
- Other Technologies
Applications Covered:
- Packaging
- Manufacturing
- Other Applications
End Users Covered:
- Metals & Machinery
- Pharmaceuticals
- Automotive
- Electronic and Semiconductor
- Food
- Other End Users
Regions Covered:
- North America
- US
- Canada
- Mexico
- Europe
- Germany
- UK
- Italy
- France
- Spain
- Rest of Europe
- Asia Pacific
- Japan
- China
- India
- Australia
- New Zealand
- South Korea
- Rest of Asia Pacific
- South America
- Argentina
- Brazil
- Chile
- Rest of South America
- Middle East & Africa
- Saudi Arabia
- UAE
- Qatar
- South Africa
- Rest of Middle East & Africa
What our report offers:
- Market share assessments for the regional and country-level segments
- Strategic recommendations for the new entrants
- Covers Market data for the years 2021, 2022, 2023, 2026, and 2030
- Market Trends (Drivers, Constraints, Opportunities, Threats, Challenges, Investment Opportunities, and recommendations)
- Strategic recommendations in key business segments based on the market estimations
- Competitive landscaping mapping the key common trends
- Company profiling with detailed strategies, financials, and recent developments
- Supply chain trends mapping the latest technological advancements
Free Customization Offerings:
All the customers of this report will be entitled to receive one of the following free customization options:
- Company Profiling
- Comprehensive profiling of additional market players (up to 3)
- SWOT Analysis of key players (up to 3)
- Regional Segmentation
- Market estimations, Forecasts and CAGR of any prominent country as per the client's interest (Note: Depends on feasibility check)
- Competitive Benchmarking
- Benchmarking of key players based on product portfolio, geographical presence, and strategic alliances
Table of Contents
1 Executive Summary
2 Preface
- 2.1 Abstract
- 2.2 Stake Holders
- 2.3 Research Scope
- 2.4 Research Methodology
- 2.4.1 Data Mining
- 2.4.2 Data Analysis
- 2.4.3 Data Validation
- 2.4.4 Research Approach
- 2.5 Research Sources
- 2.5.1 Primary Research Sources
- 2.5.2 Secondary Research Sources
- 2.5.3 Assumptions
3 Market Trend Analysis
- 3.1 Introduction
- 3.2 Drivers
- 3.3 Restraints
- 3.4 Opportunities
- 3.5 Threats
- 3.6 Technology Analysis
- 3.7 Application Analysis
- 3.8 End User Analysis
- 3.9 Emerging Markets
- 3.10 Impact of Covid-19
4 Porters Five Force Analysis
- 4.1 Bargaining power of suppliers
- 4.2 Bargaining power of buyers
- 4.3 Threat of substitutes
- 4.4 Threat of new entrants
- 4.5 Competitive rivalry
5 Global Fault Detection and Classification Market, By Fault Type
- 5.1 Introduction
- 5.2 Contamination Faults
- 5.3 Process Variability
- 5.4 Dimensional Fault
- 5.5 Surface Defects
- 5.6 Other Fault Types
6 Global Fault Detection and Classification Market, By Component
- 6.1 Introduction
- 6.2 Hardware
- 6.2.1 Communication Interfaces
- 6.2.2 Actuators
- 6.2.3 Sensors
- 6.2.4 Detectors
- 6.2.5 Control Units
- 6.3 Software
- 6.4 Services
7 Global Fault Detection and Classification Market, By Technology
- 7.1 Introduction
- 7.2 Machine Learning Algorithm
- 7.3 Sensor Data Analysis
- 7.4 Statistical Methods
- 7.5 Other Technologies
8 Global Fault Detection and Classification Market, By Application
- 8.1 Introduction
- 8.2 Packaging
- 8.2.1 Container
- 8.2.2 Grading
- 8.2.3 Label Validation
- 8.3 Manufacturing
- 8.3.1 Fabrication Inspection
- 8.3.2 Assembly Verification
- 8.3.3 Flaw Detection
- 8.4 Other Applications
9 Global Fault Detection and Classification Market, By End User
- 9.1 Introduction
- 9.2 Metals & Machinery
- 9.3 Pharmaceuticals
- 9.4 Automotive
- 9.5 Electronic and Semiconductor
- 9.6 Food
- 9.7 Other End Users
10 Global Fault Detection and Classification Market, By Geography
- 10.1 Introduction
- 10.2 North America
- 10.2.1 US
- 10.2.2 Canada
- 10.2.3 Mexico
- 10.3 Europe
- 10.3.1 Germany
- 10.3.2 UK
- 10.3.3 Italy
- 10.3.4 France
- 10.3.5 Spain
- 10.3.6 Rest of Europe
- 10.4 Asia Pacific
- 10.4.1 Japan
- 10.4.2 China
- 10.4.3 India
- 10.4.4 Australia
- 10.4.5 New Zealand
- 10.4.6 South Korea
- 10.4.7 Rest of Asia Pacific
- 10.5 South America
- 10.5.1 Argentina
- 10.5.2 Brazil
- 10.5.3 Chile
- 10.5.4 Rest of South America
- 10.6 Middle East & Africa
- 10.6.1 Saudi Arabia
- 10.6.2 UAE
- 10.6.3 Qatar
- 10.6.4 South Africa
- 10.6.5 Rest of Middle East & Africa
11 Key Developments
- 11.1 Agreements, Partnerships, Collaborations and Joint Ventures
- 11.2 Acquisitions & Mergers
- 11.3 New Product Launch
- 11.4 Expansions
- 11.5 Other Key Strategies
12 Company Profiling
- 12.1 Teledyne Technologies
- 12.2 OMRON Corporation
- 12.3 Microsoft
- 12.4 Keyence Corporation
- 12.5 Applied Materials, Inc.
- 12.6 Synopsys, Inc.
- 12.7 Cognex Corporation
- 12.8 Nikon Corporation
- 12.9 KLA Corporation
- 12.10 Amazon Web Services, Inc.
- 12.11 Tokyo Electron Limited
- 12.12 Siemens
- 12.13 Datalogic
- 12.14 BeyondMinds
- 12.15 Qualitas Technologies.
- 12.16 Elunic AG
- 12.17 DNV Group AS
- 12.18 EinnoSys Technologies Inc.
