|
|
市場調査レポート
商品コード
1372015
コンピュータ断層撮影(CT)市場の2030年までの予測:モダリティ別、技術別、用途別、エンドユーザー別、地域別の世界分析Computed Tomography Market Forecasts to 2030 - Global Analysis By Modality, Technology (Low Slice, Mid Slice, High Slice and Cone Beam Computed Tomography ), Application, End User and By Geography |
||||||
|
|
|||||||
カスタマイズ可能
|
|||||||


| コンピュータ断層撮影(CT)市場の2030年までの予測:モダリティ別、技術別、用途別、エンドユーザー別、地域別の世界分析 |
|
出版日: 2023年10月01日
発行: Stratistics Market Research Consulting
ページ情報: 英文 200+ Pages
納期: 2~3営業日
|

- 全表示
- 概要
- 図表
- 目次
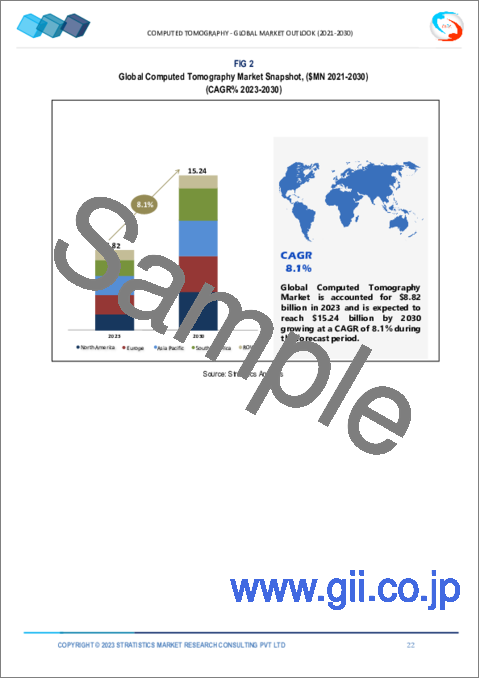
Stratistics MRCによると、世界のコンピュータ断層撮影(CT)市場は2023年に88億2,000万米ドルを占め、予測期間中にCAGR8.1%で成長し、2030年には152億4,000万米ドルに達する見込みです。
コンピュータ断層撮影(CT)は、体内の臓器、動脈、骨、軟部組織などの断面を精細に撮影する医療用画像技術です。従来のX線画像と比較して、より詳細な見通しを得ることができます。CTスキャンは、外科医が困難な手術の計画を立て、指示するために頻繁に使用されます。CTスキャンは、災難やストレスの多い出来事による傷害の重症度を評価する救急現場で最も有用です。
経済協力開発機構(OECD)の2021年の統計によると、米国では2021年に約8,450万件のCTスキャンが実施されました。
慢性疾患の増加
慢性疾患には正確な診断と継続的なモニタリングが頻繁に求められます。がん、心血管疾患、呼吸器疾患、神経学的問題など多くの慢性疾患は、CTスキャンを使用して初めて診断・監視できます。医療用画像診断、特にCTスキャンのような最先端モダリティの頻度と必要性は、慢性疾患の有病率の上昇に対応して高まっています。複雑な画像再構成や後処理機能を備えた高解像度CTスキャンなど、より高度な画像処理技術への需要が高まった結果、市場は拡大しています。
高い初期投資とメンテナンス費用
CT装置の購入と設置に必要な高額な初期投資は、特に経済的に恵まれない地域の小規模ヘルスケア施設にとっては、参入への大きな障壁となり得ます。CT装置の継続的な維持とサービスには、初期投資に加えて高額な費用がかかります。これには、定期的な校正、ハードウェアの修理、ソフトウェアのアップグレードにかかる費用が含まれます。これらの要因は、CT市場の革新性や競合に影響を与えます。さらに、技術的陳腐化の心配や償還金の制限も市場拡大を阻害しています。
ポイントオブケア画像診断に対する需要の増加
ポイントオブケア(Point-of-Care)イメージングでは、救急部、集中治療室、重症患者など、患者のいる場所でCTスキャンを行うことができます。撮影結果を即座に提供できるため、ヘルスケアプロバイダーは患者ケアについてより迅速で十分な情報に基づいた意思決定を行うことができます。患者の転帰を改善し、患者の転院を減らします。また、待ち時間の短縮により、患者の体験も向上します。これにより、CTスキャナーの潜在的な市場は、従来の放射線科以外にも広がっています。
放射線被曝の懸念
放射線リスクに対する認識は、たとえ科学的根拠がなくとも、患者の嗜好や臨床医の意思決定に影響を与えることがあります。放射線への懸念からCT検査を受けることをためらう患者もいます。放射線量を下げるには、画質を維持するためにスキャン時間を長くする必要があることが多いです。このことは、多忙な放射線科のスループットに影響を与え、一定時間内に実施できるスキャン数を減少させる可能性があります。したがって、この懸念が市場の需要を妨げています。
COVID-19の影響
COVID-19パンデミックはヘルスケア業界に大きな影響を与えました。パンデミックの初期段階では、CTスキャンがCOVID-19症例の診断とモニタリングに重要な役割を果たしました。ポータブルまたはモバイルCTスキャナーはパンデミック中に重要性を増しました。また、パンデミックは遠隔医療や遠隔画像診断サービスの導入を加速させました。CTスキャナー市場の企業は、AIを活用した画像解析、感染管理対策の改善、線量の最適化などの先進機能の開拓に注力しました。これにより、流行はコンピュータ断層撮影(CT)市場への投資を増加させました。
予測期間中、ハイスライス(64スライス以上)セグメントが最大になる見込み
ハイスライス(64スライス以上)セグメントは有利な成長が見込まれます。ハイスライスCTスキャナは、スキャン時間の短縮、患者のスループットの向上、放射線量の低減に役立ち、より詳細でアーチファクトの少ない画像を提供します。また、心血管検査のような高度な画像診断にも好まれています。ハイスライスCTはフィルム画像を現像する必要がないため、より短時間で撮影が可能です。また、解像度が向上し、患者の快適性と安全性が向上し、モーションアーチファクトと造影剤投与量が減少します。このように、ハイスライスCTスキャナーの利点は市場の成長を後押しする可能性があります。
予測期間中にCAGRが最も高くなるのは循環器内科分野
循環器分野は、心臓と血管の詳細な画像化により、予測期間中に最も高いCAGR成長が見込まれます。心臓病学におけるCTは、診断、治療計画、経過観察に不可欠な詳細な解剖学的情報を提供します。特に、侵襲的手技の適応とならない患者や、手術や介入前に正確な解剖学的情報を必要とする患者にとって有用です。その評価、査定、構造的介入のためのガイダンスが、このセグメントの需要を押し上げています。
最大のシェアを占める地域
高齢化の進展とヘルスケア支出の増加により、アジア太平洋地域が予測期間中最大の市場シェアを占めると予測されます。同地域の多くの国は経済成長を遂げており、先進医療画像技術への投資拡大につながっています。シンガポール、タイ、マレーシアのような国々は、この地域における医療ツーリズムのハブとなっています。また、マルチスライスCTスキャナやデュアルエナジーCTスキャナなど、先進的なCT技術の採用も増加しています。さらに、慢性疾患の有病率の上昇と医療画像関連企業の増加が、同地域の市場成長を促進しています。
CAGRが最も高い地域:
予測期間中、北米のCAGRが最も高いと予測されています。米国は世界最大かつ最先端の医療画像市場を有します。シーメンスヘルスイニアーズ、GEヘルスケア、フィリップスヘルスケア、東芝メディカルシステムズ、日立製作所などの大手世界企業が北米で強い存在感を示しています。CTスキャナーと関連技術の市場は、高齢化、慢性疾患の増加、この地域の技術進歩などの要因によって、着実な成長を遂げています。
2023年3月、キヤノンメディカルは欧州放射線学会(ECR)で、アキシャルビュー、側面ビュー、APビューの同時プレビューが可能な80/160スライスCTスキャナーの新製品Aquilion Serveを発表しました。
2022年4月、メドトロニックは2つのAccuRhythm(TM)AIアルゴリズムを発表し、今春以降、欧州でクラウドベースのアップデートを通じてLINQ II(TM)挿入型心臓モニター(ICM)に適用します。AccuRhythm AIは、LINQ IIが収集した心拍イベントデータに人工知能(AI)を適用し、医師が受け取る情報の精度を向上させることで、異常な心拍リズムをより適切に診断・治療できるようにします。
無料カスタマイズサービス:
本レポートをご購読のお客様は、以下の無料カスタマイズオプションのいずれかを受けることができます:
- 企業プロファイル
- 追加市場企業の包括的プロファイリング(3社まで)
- 主要企業のSWOT分析(3社まで)
- 地域セグメンテーション
- 顧客の関心に応じた主要国の市場推計・予測・CAGR(注:フィージビリティチェックによる)
- 競合ベンチマーキング
- 製品ポートフォリオ、地理的プレゼンス、戦略的提携に基づく主要企業のベンチマーキング
目次
第1章 エグゼクティブサマリー
第2章 序文
- 概要
- ステークホルダー
- 調査範囲
- 調査手法
- データマイニング
- データ分析
- データ検証
- 調査アプローチ
- 調査ソース
- 1次調査ソース
- 2次調査ソース
- 前提条件
第3章 市場動向分析
- 促進要因
- 抑制要因
- 機会
- 脅威
- 技術分析
- 用途分析
- エンドユーザー分析
- 新興市場
- 新型コロナウイルス感染症(COVID-19)の影響
第4章 ポーターのファイブフォース分析
- 供給企業の交渉力
- 買い手の交渉力
- 代替品の脅威
- 新規参入業者の脅威
- 競争企業間の競合関係
第5章 世界のコンピュータ断層撮影(CT)市場:モダリティ別
- Oアーム
- Cアーム
第6章 世界のコンピュータ断層撮影(CT)市場:技術別
- ロースライス(64スライス以下)
- ミッドスライス(64スライス)
- ハイスライス(64スライス以上)
- コーンビームコンピュータ断層撮影(CT)法(CBCT)
第7章 世界のコンピュータ断層撮影(CT)市場:用途別
- 神経内科
- 整形外科
- 腫瘍学
- 心臓病学
- その他の用途
第8章 世界のコンピュータ断層撮影(CT)市場:エンドユーザー別
- 病院
- 画像診断センター
- 外来手術センター(ASC)
- その他のエンドユーザー
第9章 世界のコンピュータ断層撮影(CT)市場:地域別
- 北米
- 米国
- カナダ
- メキシコ
- 欧州
- ドイツ
- 英国
- イタリア
- フランス
- スペイン
- その他欧州
- アジア太平洋地域
- 日本
- 中国
- インド
- オーストラリア
- ニュージーランド
- 韓国
- その他アジア太平洋地域
- 南米
- アルゼンチン
- ブラジル
- チリ
- その他南米
- 中東とアフリカ
- サウジアラビア
- アラブ首長国連邦
- カタール
- 南アフリカ
- その他中東とアフリカ
第10章 主な発展
- 契約、パートナーシップ、コラボレーション、合弁事業
- 買収と合併
- 新製品の発売
- 事業拡大
- その他の主要戦略
第11章 企業プロファイル
- Siemens Healthineers
- Carestream Health
- Canon Medical Systems Corporation
- Koninklijke Philips NV
- Fujifilm Holdings Corporation
- Stryker Corporation
- GE Healthcare
- Neusoft Medical Systems Co. Ltd
- Shimadzu Corporation
- Planmeca Group(Planmed OY)
- Koning Corporation
- Toshiba Corporation
- Hitachi Limited
- Samsung Electronics Co Limited
- Medtronic PLC
- Accuray Incorporated
- Pointnix Limited
- Epica Medical Innovations
- Imaging Sciences International LLC
- Genoray Co Limited
List of Tables
- Table 1 Global Computed Tomography Market Outlook, By Region (2021-2030) ($MN)
- Table 2 Global Computed Tomography Market Outlook, By Modality (2021-2030) ($MN)
- Table 3 Global Computed Tomography Market Outlook, By O-arms (2021-2030) ($MN)
- Table 4 Global Computed Tomography Market Outlook, By C-arms (2021-2030) ($MN)
- Table 5 Global Computed Tomography Market Outlook, By Technology (2021-2030) ($MN)
- Table 6 Global Computed Tomography Market Outlook, By Low Slice (<64 Slices) (2021-2030) ($MN)
- Table 7 Global Computed Tomography Market Outlook, By Mid Slice (64 Slices) (2021-2030) ($MN)
- Table 8 Global Computed Tomography Market Outlook, By High Slice (>64 Slice) (2021-2030) ($MN)
- Table 9 Global Computed Tomography Market Outlook, By Cone Beam Computed Tomography (CBCT) (2021-2030) ($MN)
- Table 10 Global Computed Tomography Market Outlook, By Application (2021-2030) ($MN)
- Table 11 Global Computed Tomography Market Outlook, By Neurology (2021-2030) ($MN)
- Table 12 Global Computed Tomography Market Outlook, By Orthopaedics (2021-2030) ($MN)
- Table 13 Global Computed Tomography Market Outlook, By Oncology (2021-2030) ($MN)
- Table 14 Global Computed Tomography Market Outlook, By Cardiology (2021-2030) ($MN)
- Table 15 Global Computed Tomography Market Outlook, By Other Applications (2021-2030) ($MN)
- Table 16 Global Computed Tomography Market Outlook, By End User (2021-2030) ($MN)
- Table 17 Global Computed Tomography Market Outlook, By Hospitals (2021-2030) ($MN)
- Table 18 Global Computed Tomography Market Outlook, By Diagnostic Imaging Centers (2021-2030) ($MN)
- Table 19 Global Computed Tomography Market Outlook, By Ambulatory Surgical Centers (ASCs) (2021-2030) ($MN)
- Table 20 Global Computed Tomography Market Outlook, By Other End Users (2021-2030) ($MN)
- Table 21 North America Computed Tomography Market Outlook, By Country (2021-2030) ($MN)
- Table 22 North America Computed Tomography Market Outlook, By Modality (2021-2030) ($MN)
- Table 23 North America Computed Tomography Market Outlook, By O-arms (2021-2030) ($MN)
- Table 24 North America Computed Tomography Market Outlook, By C-arms (2021-2030) ($MN)
- Table 25 North America Computed Tomography Market Outlook, By Technology (2021-2030) ($MN)
- Table 26 North America Computed Tomography Market Outlook, By Low Slice (<64 Slices) (2021-2030) ($MN)
- Table 27 North America Computed Tomography Market Outlook, By Mid Slice (64 Slices) (2021-2030) ($MN)
- Table 28 North America Computed Tomography Market Outlook, By High Slice (>64 Slice) (2021-2030) ($MN)
- Table 29 North America Computed Tomography Market Outlook, By Cone Beam Computed Tomography (CBCT) (2021-2030) ($MN)
- Table 30 North America Computed Tomography Market Outlook, By Application (2021-2030) ($MN)
- Table 31 North America Computed Tomography Market Outlook, By Neurology (2021-2030) ($MN)
- Table 32 North America Computed Tomography Market Outlook, By Orthopaedics (2021-2030) ($MN)
- Table 33 North America Computed Tomography Market Outlook, By Oncology (2021-2030) ($MN)
- Table 34 North America Computed Tomography Market Outlook, By Cardiology (2021-2030) ($MN)
- Table 35 North America Computed Tomography Market Outlook, By Other Applications (2021-2030) ($MN)
- Table 36 North America Computed Tomography Market Outlook, By End User (2021-2030) ($MN)
- Table 37 North America Computed Tomography Market Outlook, By Hospitals (2021-2030) ($MN)
- Table 38 North America Computed Tomography Market Outlook, By Diagnostic Imaging Centers (2021-2030) ($MN)
- Table 39 North America Computed Tomography Market Outlook, By Ambulatory Surgical Centers (ASCs) (2021-2030) ($MN)
- Table 40 North America Computed Tomography Market Outlook, By Other End Users (2021-2030) ($MN)
- Table 41 Europe Computed Tomography Market Outlook, By Country (2021-2030) ($MN)
- Table 42 Europe Computed Tomography Market Outlook, By Modality (2021-2030) ($MN)
- Table 43 Europe Computed Tomography Market Outlook, By O-arms (2021-2030) ($MN)
- Table 44 Europe Computed Tomography Market Outlook, By C-arms (2021-2030) ($MN)
- Table 45 Europe Computed Tomography Market Outlook, By Technology (2021-2030) ($MN)
- Table 46 Europe Computed Tomography Market Outlook, By Low Slice (<64 Slices) (2021-2030) ($MN)
- Table 47 Europe Computed Tomography Market Outlook, By Mid Slice (64 Slices) (2021-2030) ($MN)
- Table 48 Europe Computed Tomography Market Outlook, By High Slice (>64 Slice) (2021-2030) ($MN)
- Table 49 Europe Computed Tomography Market Outlook, By Cone Beam Computed Tomography (CBCT) (2021-2030) ($MN)
- Table 50 Europe Computed Tomography Market Outlook, By Application (2021-2030) ($MN)
- Table 51 Europe Computed Tomography Market Outlook, By Neurology (2021-2030) ($MN)
- Table 52 Europe Computed Tomography Market Outlook, By Orthopaedics (2021-2030) ($MN)
- Table 53 Europe Computed Tomography Market Outlook, By Oncology (2021-2030) ($MN)
- Table 54 Europe Computed Tomography Market Outlook, By Cardiology (2021-2030) ($MN)
- Table 55 Europe Computed Tomography Market Outlook, By Other Applications (2021-2030) ($MN)
- Table 56 Europe Computed Tomography Market Outlook, By End User (2021-2030) ($MN)
- Table 57 Europe Computed Tomography Market Outlook, By Hospitals (2021-2030) ($MN)
- Table 58 Europe Computed Tomography Market Outlook, By Diagnostic Imaging Centers (2021-2030) ($MN)
- Table 59 Europe Computed Tomography Market Outlook, By Ambulatory Surgical Centers (ASCs) (2021-2030) ($MN)
- Table 60 Europe Computed Tomography Market Outlook, By Other End Users (2021-2030) ($MN)
- Table 61 Asia Pacific Computed Tomography Market Outlook, By Country (2021-2030) ($MN)
- Table 62 Asia Pacific Computed Tomography Market Outlook, By Modality (2021-2030) ($MN)
- Table 63 Asia Pacific Computed Tomography Market Outlook, By O-arms (2021-2030) ($MN)
- Table 64 Asia Pacific Computed Tomography Market Outlook, By C-arms (2021-2030) ($MN)
- Table 65 Asia Pacific Computed Tomography Market Outlook, By Technology (2021-2030) ($MN)
- Table 66 Asia Pacific Computed Tomography Market Outlook, By Low Slice (<64 Slices) (2021-2030) ($MN)
- Table 67 Asia Pacific Computed Tomography Market Outlook, By Mid Slice (64 Slices) (2021-2030) ($MN)
- Table 68 Asia Pacific Computed Tomography Market Outlook, By High Slice (>64 Slice) (2021-2030) ($MN)
- Table 69 Asia Pacific Computed Tomography Market Outlook, By Cone Beam Computed Tomography (CBCT) (2021-2030) ($MN)
- Table 70 Asia Pacific Computed Tomography Market Outlook, By Application (2021-2030) ($MN)
- Table 71 Asia Pacific Computed Tomography Market Outlook, By Neurology (2021-2030) ($MN)
- Table 72 Asia Pacific Computed Tomography Market Outlook, By Orthopaedics (2021-2030) ($MN)
- Table 73 Asia Pacific Computed Tomography Market Outlook, By Oncology (2021-2030) ($MN)
- Table 74 Asia Pacific Computed Tomography Market Outlook, By Cardiology (2021-2030) ($MN)
- Table 75 Asia Pacific Computed Tomography Market Outlook, By Other Applications (2021-2030) ($MN)
- Table 76 Asia Pacific Computed Tomography Market Outlook, By End User (2021-2030) ($MN)
- Table 77 Asia Pacific Computed Tomography Market Outlook, By Hospitals (2021-2030) ($MN)
- Table 78 Asia Pacific Computed Tomography Market Outlook, By Diagnostic Imaging Centers (2021-2030) ($MN)
- Table 79 Asia Pacific Computed Tomography Market Outlook, By Ambulatory Surgical Centers (ASCs) (2021-2030) ($MN)
- Table 80 Asia Pacific Computed Tomography Market Outlook, By Other End Users (2021-2030) ($MN)
- Table 81 South America Computed Tomography Market Outlook, By Country (2021-2030) ($MN)
- Table 82 South America Computed Tomography Market Outlook, By Modality (2021-2030) ($MN)
- Table 83 South America Computed Tomography Market Outlook, By O-arms (2021-2030) ($MN)
- Table 84 South America Computed Tomography Market Outlook, By C-arms (2021-2030) ($MN)
- Table 85 South America Computed Tomography Market Outlook, By Technology (2021-2030) ($MN)
- Table 86 South America Computed Tomography Market Outlook, By Low Slice (<64 Slices) (2021-2030) ($MN)
- Table 87 South America Computed Tomography Market Outlook, By Mid Slice (64 Slices) (2021-2030) ($MN)
- Table 88 South America Computed Tomography Market Outlook, By High Slice (>64 Slice) (2021-2030) ($MN)
- Table 89 South America Computed Tomography Market Outlook, By Cone Beam Computed Tomography (CBCT) (2021-2030) ($MN)
- Table 90 South America Computed Tomography Market Outlook, By Application (2021-2030) ($MN)
- Table 91 South America Computed Tomography Market Outlook, By Neurology (2021-2030) ($MN)
- Table 92 South America Computed Tomography Market Outlook, By Orthopaedics (2021-2030) ($MN)
- Table 93 South America Computed Tomography Market Outlook, By Oncology (2021-2030) ($MN)
- Table 94 South America Computed Tomography Market Outlook, By Cardiology (2021-2030) ($MN)
- Table 95 South America Computed Tomography Market Outlook, By Other Applications (2021-2030) ($MN)
- Table 96 South America Computed Tomography Market Outlook, By End User (2021-2030) ($MN)
- Table 97 South America Computed Tomography Market Outlook, By Hospitals (2021-2030) ($MN)
- Table 98 South America Computed Tomography Market Outlook, By Diagnostic Imaging Centers (2021-2030) ($MN)
- Table 99 South America Computed Tomography Market Outlook, By Ambulatory Surgical Centers (ASCs) (2021-2030) ($MN)
- Table 100 South America Computed Tomography Market Outlook, By Other End Users (2021-2030) ($MN)
- Table 101 Middle East & Africa Computed Tomography Market Outlook, By Country (2021-2030) ($MN)
- Table 102 Middle East & Africa Computed Tomography Market Outlook, By Modality (2021-2030) ($MN)
- Table 103 Middle East & Africa Computed Tomography Market Outlook, By O-arms (2021-2030) ($MN)
- Table 104 Middle East & Africa Computed Tomography Market Outlook, By C-arms (2021-2030) ($MN)
- Table 105 Middle East & Africa Computed Tomography Market Outlook, By Technology (2021-2030) ($MN)
- Table 106 Middle East & Africa Computed Tomography Market Outlook, By Low Slice (<64 Slices) (2021-2030) ($MN)
- Table 107 Middle East & Africa Computed Tomography Market Outlook, By Mid Slice (64 Slices) (2021-2030) ($MN)
- Table 108 Middle East & Africa Computed Tomography Market Outlook, By High Slice (>64 Slice) (2021-2030) ($MN)
- Table 109 Middle East & Africa Computed Tomography Market Outlook, By Cone Beam Computed Tomography (CBCT) (2021-2030) ($MN)
- Table 110 Middle East & Africa Computed Tomography Market Outlook, By Application (2021-2030) ($MN)
- Table 111 Middle East & Africa Computed Tomography Market Outlook, By Neurology (2021-2030) ($MN)
- Table 112 Middle East & Africa Computed Tomography Market Outlook, By Orthopaedics (2021-2030) ($MN)
- Table 113 Middle East & Africa Computed Tomography Market Outlook, By Oncology (2021-2030) ($MN)
- Table 114 Middle East & Africa Computed Tomography Market Outlook, By Cardiology (2021-2030) ($MN)
- Table 115 Middle East & Africa Computed Tomography Market Outlook, By Other Applications (2021-2030) ($MN)
- Table 116 Middle East & Africa Computed Tomography Market Outlook, By End User (2021-2030) ($MN)
- Table 117 Middle East & Africa Computed Tomography Market Outlook, By Hospitals (2021-2030) ($MN)
- Table 118 Middle East & Africa Computed Tomography Market Outlook, By Diagnostic Imaging Centers (2021-2030) ($MN)
- Table 119 Middle East & Africa Computed Tomography Market Outlook, By Ambulatory Surgical Centers (ASCs) (2021-2030) ($MN)
- Table 120 Middle East & Africa Computed Tomography Market Outlook, By Other End Users (2021-2030) ($MN)
According to Stratistics MRC, the Global Computed Tomography Market is accounted for $8.82 billion in 2023 and is expected to reach $15.24 billion by 2030 growing at a CAGR of 8.1% during the forecast period. Computed Tomography is a medical imaging technology fine-grained cross-sectional pictures of the internal organs, blood arteries, bones, and soft tissues of the body. Compared to traditional X-ray imaging, it offers a more thorough perspective. CT scans are frequently used by surgeons to plan and direct difficult surgeries. It is most useful in emergency settings assessing the severity of injuries from mishaps or stressful occurrences.
According to Organization for Economic Co-operation and Development (OECD) statistics in 2021, around 84.5 million computed tomography scans were performed in U.S. in 2021.
Market Dynamics:
Driver:
Rising incidence of chronic diseases
Accurate diagnosis and continuous monitoring are frequently required for chronic disorders. Many chronic problems, such as cancer, cardiovascular diseases, respiratory disorders, and neurological issues, may only be diagnosed and monitored with the use of CT scans. The frequency and necessity of medical imaging, particularly cutting-edge modalities like CT scans, is rising in response to the rising prevalence of chronic illnesses. The market is expanding as a result of the increased demand for more advanced imaging technologies, such as high-resolution CT scans with complex image reconstruction and post-processing capabilities.
Restraint:
High initial investment & maintenance costs
The high initial investment required to purchase and install a CT machine can be a substantial barrier to entry for smaller healthcare facilities, especially in economically disadvantaged areas. The constant upkeep and service of CT devices can be expensive in addition to the initial expenditure. This covers costs for regular calibrations, hardware repairs, and software upgrades. These factors have an effect on how innovative and competitive the CT market is. Further impeding the market's expansion are worries about technological obsolescence and limited reimbursements.
Opportunity:
Increasing demand for point-of-care imaging
Point-of-care imaging brings CT scans closer to where patients are located, such as in emergency departments, intensive care units, and critical care settings. It can provide immediate imaging results, allowing healthcare providers to make quicker and more informed decisions about patient care. It improves patient outcomes and reduces patient transfers. It also enhances patient experience by reducing waiting times. This expands the potential market for CT scanners beyond traditional radiology departments.
Threat:
Radiation exposure concerns
The perception of radiation risk, even if not supported by scientific evidence, can influence patient preferences and clinician decision-making. Some patients may be hesitant to undergo CT scans due to concerns about radiation. Lowering radiation dose often requires longer scan times to maintain image quality. This can affect throughput in busy radiology departments, potentially reducing the number of scans that can be performed in a given time period. Therefore, this concern hinders the market demand.
COVID-19 Impact
The COVID-19 pandemic had a significant impact on the healthcare industry. During the initial stages of the pandemic, CT scans played a crucial role in diagnosing and monitoring COVID-19 cases. Portable or mobile CT scanners gained importance during the pandemic. Also, the pandemic accelerated the adoption of telemedicine and teleradiology services. Companies in the CT scanner market focused on developing advanced features like AI-powered image analysis, improved infection control measures, and dose optimization. Thereby, the epidemic raised the investments in Computed Tomography Market.
The high slice (>64 slice) segment is expected to be the largest during the forecast period
The high slice (>64 slice) segment is estimated to have a lucrative growth. A high-slice CT scanner helps reduce scan time, increase patient throughput, reduce radiation doses, and offer images with more detail and fewer artifacts. It is also preferred for advanced imaging, like in cardiovascular exams. High-slice CT is also quicker as no film images need to be developed. Also, it provides improved resolution, improved patient comfort & safety and reduces motion artifacts & contrast dose. Thus, the advantages of high-slice CT scanners may boost the market's growth.
The cardiology segment is expected to have the highest CAGR during the forecast period
The cardiology segment is anticipated to witness the highest CAGR growth during the forecast period, due to its detailed imaging of the heart and blood vessels. CT in cardiology provides detailed anatomical information that is crucial for diagnosis, treatment planning, and follow-up care. It is especially valuable for patients who may not be candidates for invasive procedures or for those who need precise anatomical information prior to surgery or intervention. Its evaluations, assessments and guidance for structural interventions boost the segment demand.
Region with largest share:
Asia Pacific is projected to hold the largest market share during the forecast period owing to the growing aging population and rising healthcare expenditure. Many countries in the region have been experiencing economic growth, leading to greater investments in advanced medical imaging technologies. Countries like Singapore, Thailand, and Malaysia have become medical tourism hubs in the region. Also, the adoption of advanced CT technologies, such as multi-slice and dual-energy CT scanners, has been growing in the region. Further, the rising prevalence of chronic diseases and increasing medical imaging companies are fuelling the market growth in the region.
Region with highest CAGR:
North America is projected to have the highest CAGR over the forecast period. The United States has one of the largest and most advanced medical imaging markets in the world. Major global players like Siemens Healthineers, GE Healthcare, Philips Healthcare, Toshiba Medical Systems and Hitachi, have a strong presence in North America. The market for CT scanners and related technologies has been experiencing steady growth, driven by factors like an aging population, increasing prevalence of chronic diseases, and technological advancements in the region.
Key players in the market:
Some of the key players profiled in the Computed Tomography Market include: Siemens Healthineers, Carestream Health, Canon Medical Systems Corporation, Koninklijke Philips NV, Fujifilm Holdings Corporation, Stryker Corporation, GE Healthcare, Neusoft Medical Systems Co. Ltd, Shimadzu Corporation, Planmeca Group (Planmed OY), Koning Corporation, Toshiba Corporation, Hitachi Limited, Samsung Electronics Co Limited, Medtronic PLC, Accuray Incorporated, Pointnix Limited, Epica Medical Innovations, Imaging Sciences International LLC and Genoray Co Limited.
Key Developments:
In May 2023, Royal Philips, a global leader in health technology, announced the launch of the Philips CT 3500, a new high-throughput CT system targeting the needs of routine radiology and high-volume screening programs.
In March 2023, Canon Medical announced the launch of the new 80/160-slice computed tomography scanner Aquilion Serve at the European Congress of Radiology (ECR), which allows simultaneous previews of axial, lateral and AP views
In April 2022, Medtronic announced two AccuRhythm™ AI algorithms that will be applied to LINQ II™ insertable cardiac monitors (ICM) through cloud-based updates in Europe later this spring. AccuRhythm AI applies artificial intelligence (AI) to heart rhythm event data collected by LINQ II, improving the accuracy of information physicians receive so they can better diagnose and treat abnormal heart rhythms.
Modalities Covered:
- O-arms
- C-arms
Technologies Covered:
- Low Slice (<64 Slices)
- Mid Slice (64 Slices)
- High Slice (>64 Slice)
- Cone Beam Computed Tomography (CBCT)
Applications Covered:
- Neurology
- Orthopaedics
- Oncology
- Cardiology
- Other Applications
End Users Covered:
- Hospitals
- Diagnostic Imaging Centers
- Ambulatory Surgical Centers (ASCs)
- Other End Users
Regions Covered:
- North America
- US
- Canada
- Mexico
- Europe
- Germany
- UK
- Italy
- France
- Spain
- Rest of Europe
- Asia Pacific
- Japan
- China
- India
- Australia
- New Zealand
- South Korea
- Rest of Asia Pacific
- South America
- Argentina
- Brazil
- Chile
- Rest of South America
- Middle East & Africa
- Saudi Arabia
- UAE
- Qatar
- South Africa
- Rest of Middle East & Africa
What our report offers:
- Market share assessments for the regional and country-level segments
- Strategic recommendations for the new entrants
- Covers Market data for the years 2021, 2022, 2023, 2026, and 2030
- Market Trends (Drivers, Constraints, Opportunities, Threats, Challenges, Investment Opportunities, and recommendations)
- Strategic recommendations in key business segments based on the market estimations
- Competitive landscaping mapping the key common trends
- Company profiling with detailed strategies, financials, and recent developments
- Supply chain trends mapping the latest technological advancements
Free Customization Offerings:
All the customers of this report will be entitled to receive one of the following free customization options:
- Company Profiling
- Comprehensive profiling of additional market players (up to 3)
- SWOT Analysis of key players (up to 3)
- Regional Segmentation
- Market estimations, Forecasts and CAGR of any prominent country as per the client's interest (Note: Depends on feasibility check)
- Competitive Benchmarking
- Benchmarking of key players based on product portfolio, geographical presence, and strategic alliances
Table of Contents
1 Executive Summary
2 Preface
- 2.1 Abstract
- 2.2 Stake Holders
- 2.3 Research Scope
- 2.4 Research Methodology
- 2.4.1 Data Mining
- 2.4.2 Data Analysis
- 2.4.3 Data Validation
- 2.4.4 Research Approach
- 2.5 Research Sources
- 2.5.1 Primary Research Sources
- 2.5.2 Secondary Research Sources
- 2.5.3 Assumptions
3 Market Trend Analysis
- 3.1 Introduction
- 3.2 Drivers
- 3.3 Restraints
- 3.4 Opportunities
- 3.5 Threats
- 3.6 Technology Analysis
- 3.7 Application Analysis
- 3.8 End User Analysis
- 3.9 Emerging Markets
- 3.10 Impact of Covid-19
4 Porters Five Force Analysis
- 4.1 Bargaining power of suppliers
- 4.2 Bargaining power of buyers
- 4.3 Threat of substitutes
- 4.4 Threat of new entrants
- 4.5 Competitive rivalry
5 Global Computed Tomography Market, By Modality
- 5.1 Introduction
- 5.2 O-arms
- 5.3 C-arms
6 Global Computed Tomography Market, By Technology
- 6.1 Introduction
- 6.2 Low Slice (<64 Slices)
- 6.3 Mid Slice (64 Slices)
- 6.4 High Slice (>64 Slice)
- 6.5 Cone Beam Computed Tomography (CBCT)
7 Global Computed Tomography Market, By Application
- 7.1 Introduction
- 7.2 Neurology
- 7.3 Orthopaedics
- 7.4 Oncology
- 7.5 Cardiology
- 7.6 Other Applications
8 Global Computed Tomography Market, By End User
- 8.1 Introduction
- 8.2 Hospitals
- 8.3 Diagnostic Imaging Centers
- 8.4 Ambulatory Surgical Centers (ASCs)
- 8.5 Other End Users
9 Global Computed Tomography Market, By Geography
- 9.1 Introduction
- 9.2 North America
- 9.2.1 US
- 9.2.2 Canada
- 9.2.3 Mexico
- 9.3 Europe
- 9.3.1 Germany
- 9.3.2 UK
- 9.3.3 Italy
- 9.3.4 France
- 9.3.5 Spain
- 9.3.6 Rest of Europe
- 9.4 Asia Pacific
- 9.4.1 Japan
- 9.4.2 China
- 9.4.3 India
- 9.4.4 Australia
- 9.4.5 New Zealand
- 9.4.6 South Korea
- 9.4.7 Rest of Asia Pacific
- 9.5 South America
- 9.5.1 Argentina
- 9.5.2 Brazil
- 9.5.3 Chile
- 9.5.4 Rest of South America
- 9.6 Middle East & Africa
- 9.6.1 Saudi Arabia
- 9.6.2 UAE
- 9.6.3 Qatar
- 9.6.4 South Africa
- 9.6.5 Rest of Middle East & Africa
10 Key Developments
- 10.1 Agreements, Partnerships, Collaborations and Joint Ventures
- 10.2 Acquisitions & Mergers
- 10.3 New Product Launch
- 10.4 Expansions
- 10.5 Other Key Strategies
11 Company Profiling
- 11.1 Siemens Healthineers
- 11.2 Carestream Health
- 11.3 Canon Medical Systems Corporation
- 11.4 Koninklijke Philips NV
- 11.5 Fujifilm Holdings Corporation
- 11.6 Stryker Corporation
- 11.7 GE Healthcare
- 11.8 Neusoft Medical Systems Co. Ltd
- 11.9 Shimadzu Corporation
- 11.10 Planmeca Group (Planmed OY)
- 11.11 Koning Corporation
- 11.12 Toshiba Corporation
- 11.13 Hitachi Limited
- 11.14 Samsung Electronics Co Limited
- 11.15 Medtronic PLC
- 11.16 Accuray Incorporated
- 11.17 Pointnix Limited
- 11.18 Epica Medical Innovations
- 11.19 Imaging Sciences International LLC
- 11.20 Genoray Co Limited