|
|
市場調査レポート
商品コード
1371982
脳マッピング機器の世界市場、2030年までの予測:製品タイプ別、エンドユーザー別、地域別の世界分析Brain Mapping Instruments Market Forecasts to 2030 - Global Analysis By Product Type, End User and By Geography |
||||||
|
|
|||||||
|
● お客様のご希望に応じて、既存データの加工や未掲載情報(例:国別セグメント)の追加などの対応が可能です。 詳細はお問い合わせください。 |
|||||||


| 脳マッピング機器の世界市場、2030年までの予測:製品タイプ別、エンドユーザー別、地域別の世界分析 |
|
出版日: 2023年10月01日
発行: Stratistics Market Research Consulting
ページ情報: 英文 200+ Pages
納期: 2~3営業日
|
- 全表示
- 概要
- 図表
- 目次
Stratistics MRCによると、世界の脳マッピング機器市場は2023年に25億米ドルを占め、予測期間中のCAGRは8.1%で成長し、2030年には42億米ドルに達する見込みです。
腫瘍を除去する際に重要な脳領域を検出し保護する最も正確な技術は、脳マッピングです。この手術は、腫瘍が脳の言語部分、運動部分、感覚部分に近い患者に必要な場合があります。医師は、運動、言語、感覚を司る脳の重要な領域への影響を抑えながら、可能な限り脳腫瘍を摘出することができます。
世界保健機関(WHO)による2021年9月の最新情報によると、2021年には全世界で約5,500万人が認知症を患っており、毎年1,000万人近くの症例が報告されています。
神経疾患の増加
対象人口に神経疾患が蔓延していることは、医療機器業界における脳マッピング機器の使用がより急速に拡大し、これらのツールの市場に新たな機会がもたらされる可能性が高いことを意味します。さらに、技術強化の結果、世界的に複数の大手企業による新製品のイントロダクションが増加し、市場成長にプラスの影響を与えると予想されます。
高コスト
MRIスキャナー、EEGシステム、MEG装置などの脳マッピング装置の購入や維持にかかる費用は高額になりがちです。特に資金が限られているヘルスケア施設では、これらの機器の高額なコストが制約となる可能性があります。特に資源が限られている地域では、機器のコストが普及を妨げる可能性があります。
技術開発
脳マッピング機器の市場は、脳イメージングやマッピング技術の開発が進んでいるため、多くの可能性を秘めています。脳活動をより正確にマッピングするために、機能的磁気共鳴画像法(fMRI)、脳波法(EEG)、脳磁図法(MEG)などの新しいイメージング技術が、より高い空間分解能と時間分解能を提供しています。さらに、技術開発により、ヒトの脳をマッピングするための、より複雑で精密な機器が開発されています。これらの技術は、より優れたデータ収集と分析能力、より高画質な画像、他のシステムや装置との通信の向上を提供します。これらの進歩により、科学者や調査者は、脳がどのように働き、神経ネットワークがどのように機能し、関連する病気がどのように機能するのかについて、よりよく理解することができます。
アクセシビリティの問題
特に農村部や低所得国では、すべての場所で脳マッピング機器に等しくアクセスできるわけではないです。ヘルスケア施設や有能な労働者を含むインフラの不足により、脳マッピング機器へのアクセスや利用が制約されることがあります。しかし、こうした技術の一般的な普及を妨げるため、アクセスが制限されると市場の拡大が制限されます。
COVID-19の影響
予期せぬ世界の公衆衛生上の緊急事態であるCOVID-19は、事実上あらゆるビジネスに影響を及ぼしています。例えば、2021年12月にJournal of Alzheimer's Diseasesに掲載された論文によると、COVID-19は呼吸器系に影響を及ぼすだけでなく、神経疾患や神経精神疾患の原因にもなります。それによると、このウイルスは中枢神経系(CNS)に影響を与える可能性があり、COVID-19の症状が治まった後でも認知障害を引き起こす可能性があります。その結果、COVID-19感染者は神経症状が悪化しました。その結果、脳マッピング機器が必要とされ、流行期の市場拡大に大きな影響を与えました。
予測期間中、病院セグメントが最大となる見込み
入院患者の増加や主要市場参入企業による製品発売により、予測期間中、病院セグメントが最大シェアを占めました。また、米国における病院数の増加も市場拡大に拍車をかけています。2021年1月に発表された米国心臓協会(AHA)の数字によると、2021年の米国における投資家所有(営利)の地域病院数は1,228であったのに対し、州および地方自治体の地域病院数は951でした。さらに、脳マッピング機器に対する需要は、膨大な数の病院によって生み出されており、これが市場拡大を促進すると予測されています。
脳波計(EEG)セグメントは予測期間中に最も高いCAGRが見込まれる
てんかんや発作を含む脳の病気を診断するために画像技術を使用するその能力により、脳波計(EEG)セグメントは予測期間を通じて最も高いCAGRを持つと予想されています。さらに、EEGは脳の電気的活動の変化を特定するのに役立つ診断方法です。そのため、さまざまな脳の課題を検出するための迅速な適用プロセスにより、市場拡大が促進されています。
最もシェアの高い地域
米国では神経疾患の罹患率が上昇し、新技術が早期に受け入れられ、ヘルスケアインフラが強化されているため、北米は現在、脳マッピング機器の世界市場で支配的な地位を占めています。例えば、アルツハイマー病協会によると、2021年には65歳以上の米国人でアルツハイマー型認知症の患者は約620万人であり、この数は2050年には1,270万人に増加すると予測されています。さらに、高度に発達したヘルスケアシステムと研究開発への集中は、この地域の最先端技術の導入に有利な環境を提供しています。こうした要素がこの地域の成長を後押ししています。
CAGRが最も高い地域
健康への関心の高まりと最先端技術の採用増加により、アジア太平洋地域は予測期間中に急速なペースで拡大すると予測されています。NCBIの報告によると、この地域では神経疾患の有病率が上昇しており、脳の構造や認知機能の神経画像調査が増加しています。また、脳疾患患者の治療には、エコープラナーイメージング(EPI)などの新しい方法が適応されています。EPIとして知られる高速MRI技術は、非常に短時間でMR画像を取得することができます。その結果、この地域における脳疾患の蔓延と最先端技術の採用が市場拡大に拍車をかけています。
無料のカスタマイズサービス
本レポートをご購読のお客様には、以下の無料カスタマイズオプションのいずれかをご利用いただけます
- 企業プロファイル
- 追加市場企業の包括的プロファイリング(3社まで)
- 主要企業のSWOT分析(3社まで)
- 地域セグメンテーション
- 顧客の関心に応じた主要国の市場推計・予測・CAGR(注:フィージビリティチェックによる)
- 競合ベンチマーキング
- 製品ポートフォリオ、地理的プレゼンス、戦略的提携に基づく主要企業のベンチマーキング
目次
第1章 エグゼクティブサマリー
第2章 序文
- 概要
- ステークホルダー
- 調査範囲
- 調査手法
- データマイニング
- データ分析
- データ検証
- 調査アプローチ
- 調査源
- 1次調査源
- 2次調査源
- 前提条件
第3章 市場動向分析
- 促進要因
- 抑制要因
- 機会
- 脅威
- 製品分析
- エンドユーザー分析
- 新興市場
- 新型コロナウイルス感染症(COVID-19)の影響
第4章 ポーターのファイブフォース分析
- 供給企業の交渉力
- 買い手の交渉力
- 代替品の脅威
- 新規参入業者の脅威
- 競争企業間の敵対関係
第5章 世界の脳マッピング機器市場:製品タイプ別
- 磁気共鳴画像法(MRI)
- 近赤外分光法(NIRS)
- 脳波検査(EEG)
- 陽電子放出断層撮影法(PET)
- コンピュータ断層撮影
- その他の製品タイプ
第6章 世界の脳マッピング機器市場:エンドユーザー別
- 外来センター
- 病院
- その他のエンドユーザー
第7章 世界の脳マッピング機器市場:地域別
- 北米
- 米国
- カナダ
- メキシコ
- 欧州
- ドイツ
- 英国
- イタリア
- フランス
- スペイン
- その他の欧州
- アジア太平洋
- 日本
- 中国
- インド
- オーストラリア
- ニュージーランド
- 韓国
- その他のアジア太平洋
- 南米
- アルゼンチン
- ブラジル
- チリ
- その他の南米
- 中東・アフリカ
- サウジアラビア
- アラブ首長国連邦
- カタール
- 南アフリカ
- その他の中東・アフリカ
第8章 主な発展
- 契約、パートナーシップ、コラボレーション、合弁事業
- 買収と合併
- 新製品の発売
- 事業拡大
- その他の主要戦略
第9章 企業プロファイル
- Advanced Brain Monitoring, Inc
- Artinis Medical Systems
- Canon Medical Systems Corp
- General Electric Company
- Gowerlabs Ltd
- Koninklijke Philips N.V.
- Medtronic
- Natus Medical Incorporated
- Nihon Kohden Corporation
- NIRx Medical Technologies, LLC
- Siemens Healthcare Private Limited
- Soterix Medical Inc
List of Tables
- Table 1 Global Brain Mapping Instruments Market Outlook, By Region (2021-2030) ($MN)
- Table 2 Global Brain Mapping Instruments Market Outlook, By Product Type (2021-2030) ($MN)
- Table 3 Global Brain Mapping Instruments Market Outlook, By Magnetic Resonance Imaging (MRI) (2021-2030) ($MN)
- Table 4 Global Brain Mapping Instruments Market Outlook, By Near-Infrared Spectroscopy (NIRS) (2021-2030) ($MN)
- Table 5 Global Brain Mapping Instruments Market Outlook, By Electroencephalography (EEG) (2021-2030) ($MN)
- Table 6 Global Brain Mapping Instruments Market Outlook, By Positron Emission Tomography (PET) (2021-2030) ($MN)
- Table 7 Global Brain Mapping Instruments Market Outlook, By Computed Tomography (2021-2030) ($MN)
- Table 8 Global Brain Mapping Instruments Market Outlook, By Other Product Types (2021-2030) ($MN)
- Table 9 Global Brain Mapping Instruments Market Outlook, By End User (2021-2030) ($MN)
- Table 10 Global Brain Mapping Instruments Market Outlook, By Ambulatory Centers (2021-2030) ($MN)
- Table 11 Global Brain Mapping Instruments Market Outlook, By Hospitals (2021-2030) ($MN)
- Table 12 Global Brain Mapping Instruments Market Outlook, By Other End Users (2021-2030) ($MN)
- Table 13 North America Brain Mapping Instruments Market Outlook, By Country (2021-2030) ($MN)
- Table 14 North America Brain Mapping Instruments Market Outlook, By Product Type (2021-2030) ($MN)
- Table 15 North America Brain Mapping Instruments Market Outlook, By Magnetic Resonance Imaging (MRI) (2021-2030) ($MN)
- Table 16 North America Brain Mapping Instruments Market Outlook, By Near-Infrared Spectroscopy (NIRS) (2021-2030) ($MN)
- Table 17 North America Brain Mapping Instruments Market Outlook, By Electroencephalography (EEG) (2021-2030) ($MN)
- Table 18 North America Brain Mapping Instruments Market Outlook, By Positron Emission Tomography (PET) (2021-2030) ($MN)
- Table 19 North America Brain Mapping Instruments Market Outlook, By Computed Tomography (2021-2030) ($MN)
- Table 20 North America Brain Mapping Instruments Market Outlook, By Other Product Types (2021-2030) ($MN)
- Table 21 North America Brain Mapping Instruments Market Outlook, By End User (2021-2030) ($MN)
- Table 22 North America Brain Mapping Instruments Market Outlook, By Ambulatory Centers (2021-2030) ($MN)
- Table 23 North America Brain Mapping Instruments Market Outlook, By Hospitals (2021-2030) ($MN)
- Table 24 North America Brain Mapping Instruments Market Outlook, By Other End Users (2021-2030) ($MN)
- Table 25 Europe Brain Mapping Instruments Market Outlook, By Country (2021-2030) ($MN)
- Table 26 Europe Brain Mapping Instruments Market Outlook, By Product Type (2021-2030) ($MN)
- Table 27 Europe Brain Mapping Instruments Market Outlook, By Magnetic Resonance Imaging (MRI) (2021-2030) ($MN)
- Table 28 Europe Brain Mapping Instruments Market Outlook, By Near-Infrared Spectroscopy (NIRS) (2021-2030) ($MN)
- Table 29 Europe Brain Mapping Instruments Market Outlook, By Electroencephalography (EEG) (2021-2030) ($MN)
- Table 30 Europe Brain Mapping Instruments Market Outlook, By Positron Emission Tomography (PET) (2021-2030) ($MN)
- Table 31 Europe Brain Mapping Instruments Market Outlook, By Computed Tomography (2021-2030) ($MN)
- Table 32 Europe Brain Mapping Instruments Market Outlook, By Other Product Types (2021-2030) ($MN)
- Table 33 Europe Brain Mapping Instruments Market Outlook, By End User (2021-2030) ($MN)
- Table 34 Europe Brain Mapping Instruments Market Outlook, By Ambulatory Centers (2021-2030) ($MN)
- Table 35 Europe Brain Mapping Instruments Market Outlook, By Hospitals (2021-2030) ($MN)
- Table 36 Europe Brain Mapping Instruments Market Outlook, By Other End Users (2021-2030) ($MN)
- Table 37 Asia Pacific Brain Mapping Instruments Market Outlook, By Country (2021-2030) ($MN)
- Table 38 Asia Pacific Brain Mapping Instruments Market Outlook, By Product Type (2021-2030) ($MN)
- Table 39 Asia Pacific Brain Mapping Instruments Market Outlook, By Magnetic Resonance Imaging (MRI) (2021-2030) ($MN)
- Table 40 Asia Pacific Brain Mapping Instruments Market Outlook, By Near-Infrared Spectroscopy (NIRS) (2021-2030) ($MN)
- Table 41 Asia Pacific Brain Mapping Instruments Market Outlook, By Electroencephalography (EEG) (2021-2030) ($MN)
- Table 42 Asia Pacific Brain Mapping Instruments Market Outlook, By Positron Emission Tomography (PET) (2021-2030) ($MN)
- Table 43 Asia Pacific Brain Mapping Instruments Market Outlook, By Computed Tomography (2021-2030) ($MN)
- Table 44 Asia Pacific Brain Mapping Instruments Market Outlook, By Other Product Types (2021-2030) ($MN)
- Table 45 Asia Pacific Brain Mapping Instruments Market Outlook, By End User (2021-2030) ($MN)
- Table 46 Asia Pacific Brain Mapping Instruments Market Outlook, By Ambulatory Centers (2021-2030) ($MN)
- Table 47 Asia Pacific Brain Mapping Instruments Market Outlook, By Hospitals (2021-2030) ($MN)
- Table 48 Asia Pacific Brain Mapping Instruments Market Outlook, By Other End Users (2021-2030) ($MN)
- Table 49 South America Brain Mapping Instruments Market Outlook, By Country (2021-2030) ($MN)
- Table 50 South America Brain Mapping Instruments Market Outlook, By Product Type (2021-2030) ($MN)
- Table 51 South America Brain Mapping Instruments Market Outlook, By Magnetic Resonance Imaging (MRI) (2021-2030) ($MN)
- Table 52 South America Brain Mapping Instruments Market Outlook, By Near-Infrared Spectroscopy (NIRS) (2021-2030) ($MN)
- Table 53 South America Brain Mapping Instruments Market Outlook, By Electroencephalography (EEG) (2021-2030) ($MN)
- Table 54 South America Brain Mapping Instruments Market Outlook, By Positron Emission Tomography (PET) (2021-2030) ($MN)
- Table 55 South America Brain Mapping Instruments Market Outlook, By Computed Tomography (2021-2030) ($MN)
- Table 56 South America Brain Mapping Instruments Market Outlook, By Other Product Types (2021-2030) ($MN)
- Table 57 South America Brain Mapping Instruments Market Outlook, By End User (2021-2030) ($MN)
- Table 58 South America Brain Mapping Instruments Market Outlook, By Ambulatory Centers (2021-2030) ($MN)
- Table 59 South America Brain Mapping Instruments Market Outlook, By Hospitals (2021-2030) ($MN)
- Table 60 South America Brain Mapping Instruments Market Outlook, By Other End Users (2021-2030) ($MN)
- Table 61 Middle East & Africa Brain Mapping Instruments Market Outlook, By Country (2021-2030) ($MN)
- Table 62 Middle East & Africa Brain Mapping Instruments Market Outlook, By Product Type (2021-2030) ($MN)
- Table 63 Middle East & Africa Brain Mapping Instruments Market Outlook, By Magnetic Resonance Imaging (MRI) (2021-2030) ($MN)
- Table 64 Middle East & Africa Brain Mapping Instruments Market Outlook, By Near-Infrared Spectroscopy (NIRS) (2021-2030) ($MN)
- Table 65 Middle East & Africa Brain Mapping Instruments Market Outlook, By Electroencephalography (EEG) (2021-2030) ($MN)
- Table 66 Middle East & Africa Brain Mapping Instruments Market Outlook, By Positron Emission Tomography (PET) (2021-2030) ($MN)
- Table 67 Middle East & Africa Brain Mapping Instruments Market Outlook, By Computed Tomography (2021-2030) ($MN)
- Table 68 Middle East & Africa Brain Mapping Instruments Market Outlook, By Other Product Types (2021-2030) ($MN)
- Table 69 Middle East & Africa Brain Mapping Instruments Market Outlook, By End User (2021-2030) ($MN)
- Table 70 Middle East & Africa Brain Mapping Instruments Market Outlook, By Ambulatory Centers (2021-2030) ($MN)
- Table 71 Middle East & Africa Brain Mapping Instruments Market Outlook, By Hospitals (2021-2030) ($MN)
- Table 72 Middle East & Africa Brain Mapping Instruments Market Outlook, By Other End Users (2021-2030) ($MN)
According to Stratistics MRC, the Global Brain Mapping Instruments Market is accounted for $2.5 billion in 2023 and is expected to reach $4.2 billion by 2030 growing at a CAGR of 8.1% during the forecast period. The most accurate technique to detect and safeguard important brain regions while removing a tumor is through brain mapping. This operation may be necessary for patients whose tumors are close to the linguistic, motor, or sensory parts of the brain. Doctors have been able to remove as much of a brain tumor as feasible while limiting the effect on the vital regions of the brain that regulate movement, speech, and the senses.
According to the September 2021 update by the World Health Organization (WHO), about 55 million people worldwide were living with dementia in 2021, and nearly 10 million cases are reported every year.
Market Dynamics:
Driver:
Increase in neurological conditions
The prevalence of neurological disorders among the target population means that the use of brain mapping instruments in the medical device industry is likely to grow more rapidly, opening up new opportunities for the market for these tools. Additionally, the increased introduction of new products by several major players globally as a result of enhanced technology is anticipated to positively affect market growth.
Restraint:
High costs
The cost of purchasing and maintaining brain mapping equipment like MRI scanners, EEG systems, and MEG devices can be high. These instruments' high costs can be a constraint, especially for healthcare facilities with limited funds. The cost of the tools may prevent their widespread use, particularly in areas with limited resources.
Opportunity:
Technological development
The market for brain mapping instruments has a lot of potential due to the ongoing developments in brain imaging and mapping technology. In order to map brain activity more precisely, new imaging techniques, including functional magnetic resonance imaging (fMRI), electroencephalography (EEG), and magnetoencephalography (MEG), offer greater spatial and temporal resolution. Additionally, technology development has produced more complex and precise instruments for mapping the human brain. These technologies provide better data collection and analysis capacities, higher-quality images, and improved communication with other systems and devices. These advancements offer scientists and researchers a better understanding of how the brain works, how neural networks work, and how related illnesses work.
Threat:
Accessibility issues
Not all locations have equal access to brain mapping instruments, particularly rural and low-income nations. The accessibility and availability of brain mapping tools may be constrained by a lack of infrastructure, including healthcare facilities and competent workers. However, as it prevents the general adoption of these technologies, this restricted accessibility limits market expansion.
COVID-19 Impact:
An unexpected global public health emergency, COVID-19, has had an impact on practically every business. For instance, COVID-19 not only affects the respiratory system but also causes neurological and neuropsychiatric diseases, according to an article published in the Journal of Alzheimer's Diseases in December 2021. According to this, the virus may have an impact on the central nervous system (CNS), which could lead to cognitive impairment even after COVID-19 symptoms have subsided. As a result, people with COVID-19 developed worse neurological conditions. As a result, there was a need for brain mapping instruments, which had a major effect on market expansion during the epidemic.
The hospitals segment is expected to be the largest during the forecast period
Due to a rise in hospital admissions and product launches by the major market participants, the hospital segment dominated the largest share over the forecast period. The expansion of the market is also being fueled by the rising number of hospitals in the United States. According to numbers from the American Heart Association (AHA) released in January 2021, there were 1,228 investor-owned (for-profit) community hospitals in the United States in 2021, compared to 951 state and local government community hospitals. Moreover, the demand for brain mapping instruments is generated by the enormous number of hospitals, which is anticipated to fuel market expansion.
The Electroencephalography (EEG) segment is expected to have the highest CAGR during the forecast period
Due to its capabilities of using imaging techniques to diagnose brain illnesses, including epilepsy and seizures, the electroencephalography (EEG) segment is anticipated to have the highest CAGR throughout the projection period. Moreover, it is a method of diagnosis that aids in identifying alterations in the electrical activity of the brain. Therefore, it is promoting market expansion due to its quicker application process for detecting various brain challenges.
Region with largest share:
Due to the rising incidence of neurological illnesses, early acceptance of new technologies, and enhanced healthcare infrastructure in the US, North America currently holds a dominant position in the global market for brain mapping instruments. For instance, according to the Alzheimer's Association, in 2021, there were around 6.2 million Americans 65 and older who had Alzheimer's dementia, and that number is predicted to rise to 12.7 million by the year 2050. Moreover, the highly developed healthcare system and concentration on research and development provide a climate that is favorable to the adoption of cutting-edge technologies in the region. These elements are boosting the region's growth.
Region with highest CAGR:
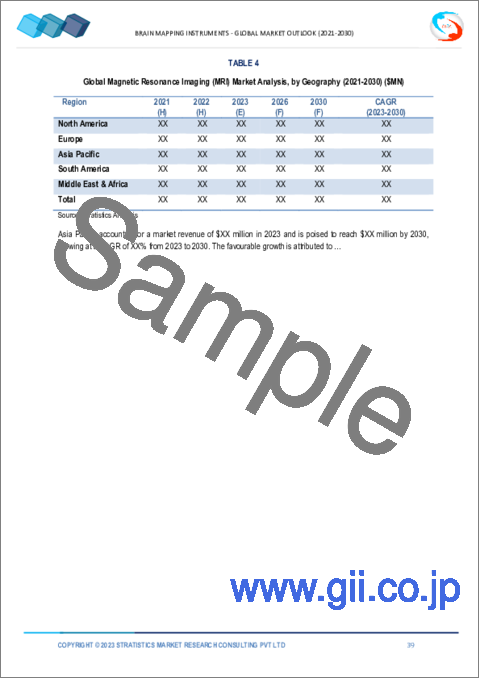
Owing to growing health concerns and increased adoption of cutting-edge technologies, Asia-Pacific is anticipated to expand at a rapid pace over the course of the projected period. The NCBI reports that the rising prevalence of neurological illnesses in the area has led to an increase in neuroimaging investigations of brain structure and cognitive functioning. The treatment of individuals with brain illnesses has also adapted new methods, such as echo-planar imaging (EPI). The rapid MRI technique known as EPI can acquire MR images in a very short amount of time. As a result, the prevalence of brain illnesses and the adoption of cutting-edge technologies in the region have fueled market expansion.
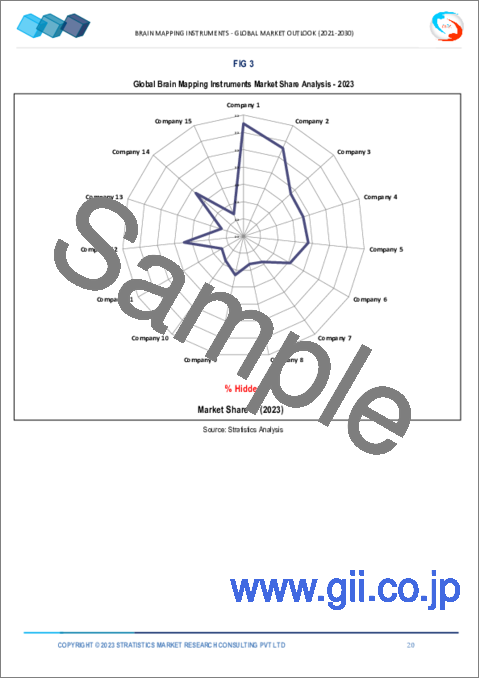
Key players in the market:
Some of the key players in Brain Mapping Instruments market include: Advanced Brain Monitoring, Inc, Artinis Medical Systems, Canon Medical Systems Corp, General Electric Company, Gowerlabs Ltd, Koninklijke Philips N.V., Medtronic, Natus Medical Incorporated, Nihon Kohden Corporation, NIRx Medical Technologies, LLC, Siemens Healthcare Private Limited and Soterix Medical Inc.
Key Developments:
In September 2022, Scientists at the Allen Institute established the Brain Genome Project, a new global partnership to map approximately 200 billion cells in the human brain by type and function.
In March 2022, Kernel, a neurotechnology company, developed a wearable headset device, Kernel Flow, for brain measurement, which is based on time-domain functional near-infrared spectroscopy (TD-fNIRS). The device enables accurate, high-resolution measurement of the brain, and it functions by emitting picosecond pulses of light into tissue and measuring the arrival times of single photons.
Product Types Covered:
- Magnetic Resonance Imaging (MRI)
- Near-Infrared Spectroscopy (NIRS)
- Electroencephalography (EEG)
- Positron Emission Tomography (PET)
- Computed Tomography
- Other Product Types
End Users Covered:
- Ambulatory Centers
- Hospitals
- Other End Users
Regions Covered:
- North America
- US
- Canada
- Mexico
- Europe
- Germany
- UK
- Italy
- France
- Spain
- Rest of Europe
- Asia Pacific
- Japan
- China
- India
- Australia
- New Zealand
- South Korea
- Rest of Asia Pacific
- South America
- Argentina
- Brazil
- Chile
- Rest of South America
- Middle East & Africa
- Saudi Arabia
- UAE
- Qatar
- South Africa
- Rest of Middle East & Africa
What our report offers:
- Market share assessments for the regional and country-level segments
- Strategic recommendations for the new entrants
- Covers Market data for the years 2021, 2022, 2023, 2026, and 2030
- Market Trends (Drivers, Constraints, Opportunities, Threats, Challenges, Investment Opportunities, and recommendations)
- Strategic recommendations in key business segments based on the market estimations
- Competitive landscaping mapping the key common trends
- Company profiling with detailed strategies, financials, and recent developments
- Supply chain trends mapping the latest technological advancements
Free Customization Offerings:
All the customers of this report will be entitled to receive one of the following free customization options:
- Company Profiling
- Comprehensive profiling of additional market players (up to 3)
- SWOT Analysis of key players (up to 3)
- Regional Segmentation
- Market estimations, Forecasts and CAGR of any prominent country as per the client's interest (Note: Depends on feasibility check)
- Competitive Benchmarking
- Benchmarking of key players based on product portfolio, geographical presence, and strategic alliances
Table of Contents
1 Executive Summary
2 Preface
- 2.1 Abstract
- 2.2 Stake Holders
- 2.3 Research Scope
- 2.4 Research Methodology
- 2.4.1 Data Mining
- 2.4.2 Data Analysis
- 2.4.3 Data Validation
- 2.4.4 Research Approach
- 2.5 Research Sources
- 2.5.1 Primary Research Sources
- 2.5.2 Secondary Research Sources
- 2.5.3 Assumptions
3 Market Trend Analysis
- 3.1 Introduction
- 3.2 Drivers
- 3.3 Restraints
- 3.4 Opportunities
- 3.5 Threats
- 3.6 Product Analysis
- 3.7 End User Analysis
- 3.8 Emerging Markets
- 3.9 Impact of Covid-19
4 Porters Five Force Analysis
- 4.1 Bargaining power of suppliers
- 4.2 Bargaining power of buyers
- 4.3 Threat of substitutes
- 4.4 Threat of new entrants
- 4.5 Competitive rivalry
5 Global Brain Mapping Instruments Market, By Product Type
- 5.1 Introduction
- 5.2 Magnetic Resonance Imaging (MRI)
- 5.3 Near-Infrared Spectroscopy (NIRS)
- 5.4 Electroencephalography (EEG)
- 5.5 Positron Emission Tomography (PET)
- 5.6 Computed Tomography
- 5.7 Other Product Types
6 Global Brain Mapping Instruments Market, By End User
- 6.1 Introduction
- 6.2 Ambulatory Centers
- 6.3 Hospitals
- 6.8 Other End Users
7 Global Brain Mapping Instruments Market, By Geography
- 7.1 Introduction
- 7.2 North America
- 7.2.1 US
- 7.2.2 Canada
- 7.2.3 Mexico
- 7.3 Europe
- 7.3.1 Germany
- 7.3.2 UK
- 7.3.3 Italy
- 7.3.4 France
- 7.3.5 Spain
- 7.3.6 Rest of Europe
- 7.4 Asia Pacific
- 7.4.1 Japan
- 7.4.2 China
- 7.4.3 India
- 7.4.4 Australia
- 7.4.5 New Zealand
- 7.4.6 South Korea
- 7.4.7 Rest of Asia Pacific
- 7.5 South America
- 7.5.1 Argentina
- 7.5.2 Brazil
- 7.5.3 Chile
- 7.5.4 Rest of South America
- 7.6 Middle East & Africa
- 7.6.1 Saudi Arabia
- 7.6.2 UAE
- 7.6.3 Qatar
- 7.6.4 South Africa
- 7.6.5 Rest of Middle East & Africa
8 Key Developments
- 8.1 Agreements, Partnerships, Collaborations and Joint Ventures
- 8.2 Acquisitions & Mergers
- 8.3 New Product Launch
- 8.4 Expansions
- 8.5 Other Key Strategies
9 Company Profiling
- 9.1 Advanced Brain Monitoring, Inc
- 9.2 Artinis Medical Systems
- 9.3 Canon Medical Systems Corp
- 9.4 General Electric Company
- 9.5 Gowerlabs Ltd
- 9.6 Koninklijke Philips N.V.
- 9.7 Medtronic
- 9.8 Natus Medical Incorporated
- 9.9 Nihon Kohden Corporation
- 9.10 NIRx Medical Technologies, LLC
- 9.11 Siemens Healthcare Private Limited
- 9.12 Soterix Medical Inc