|
|
市場調査レポート
商品コード
1308659
産業用ガスタービンの2030年までの市場予測-容量別、サイクル別、セクター別、技術別、地域別の世界分析Industrial Gas Turbine Market Forecasts to 2030 - Global Analysis By Capacity, Cycle, Sector, Technology and By Geography |
||||||
|
|
|||||||
カスタマイズ可能
|
|||||||


| 産業用ガスタービンの2030年までの市場予測-容量別、サイクル別、セクター別、技術別、地域別の世界分析 |
|
出版日: 2023年07月01日
発行: Stratistics Market Research Consulting
ページ情報: 英文 175+ Pages
納期: 2~3営業日
|

- 全表示
- 概要
- 図表
- 目次
Stratistics MRCによると、産業用ガスタービンの世界市場は2023年に105億米ドルを占め、予測期間中のCAGRは7.8%で成長し、2030年には177億米ドルに達する見込みです。
産業用ガスタービンは、天然ガスや液体燃料などの燃料から機械エネルギーを生成する燃焼機関の一種です。この機械エネルギーは、一体型発電機の動力源として使用され、発電が行われます。従来のガス焚きや石油焚きの蒸気発電所は、ガスタービンを使ってガスや石油を燃焼させる、より効率的なコンバインドサイクル発電所に取って代わられ、段階的に廃止されています。
国際エネルギー機関(IEA)によると、2021年の世界の電力需要は前年比で6%急増しました。エネルギー使用量の増加に伴い、高度な制御・監視システムは、効率と性能を向上させるために既存のエネルギー・チャネルに広く統合されています。
市場力学:
促進要因
促進要因:新興経済圏の拡大
中国、インド、ブラジル、東南アジア諸国などの新興国における産業センターの台頭と、すべての主要製造部門におけるFDIの増加は、予測期間中、この市場に魅力的な成長の可能性を生み出すと予想されます。FDI奨励制度を通じて企業設立に関心を持つ様々な国際的開発業者が新興経済諸国に注目しています。これは間接的にその国の経済を強化し、工業化を加速させる。投資を誘致し事業拡大を促進するため、米国や多くのアジア諸国などの国々は、製造業の規則や手続きを修正・改革しています。
抑制要因:
天然ガス価格の変動
天然ガス価格は、天然ガス供給を混乱させる可能性のある行動の影響を受ける。地政学的緊張は、ガスの入手可能性と需要に不確実性をもたらす破壊的要素です。その結果、ガス価格の変動が大きくなる可能性があります。米国のガス価格はシェールガス採掘の結果劇的に下落したが、世界の他の地域の価格は比較的高いままです。中東地域の大半の国々は天然ガスを大量に埋蔵しています。政治的・文化的な困難があるため、中東は非常に不安定な地域です。
機会:
自家発電への注目の高まり
製品の設置は、生産品の需要増加を満たすための製造装置の絶え間ない成長によって助けられると思われます。自己調整型発電システムに対する要望の高まりは、ガスタービンの採用を促進すると思われます。世界中の政府が、再生可能エネルギー源をエネルギーミックスに統合するための野心的な戦略を追求しています。再生可能エネルギー発電に対するいくつかの基金や投資が発表され、発電量増加の需要を支えています。
脅威
再生可能エネルギーへのシフト
2017年6月のBP Statistical Review of World Energyによると、世界の天然ガスの総埋蔵量は186兆6,000億立方メートルで、現在の消費率に基づくと55年分です。米国が天然ガスを国際市場に輸出し始めれば、埋蔵量対生産量の比率は劇的に低下します。アジア太平洋の急成長国では石炭の生産量と消費量が大幅に増加しているにもかかわらず、天然ガスの世界の供給量はその半分の期間しか持たないです。太陽光発電所と風力発電所はクリーンなエネルギーを供給します。再生可能エネルギーへの投資は、石炭火力発電施設に影響を与えると予測されています。その結果、産業用ガスタービン市場は、天然ガスの供給源が限られているために困難に直面します。
COVID-19の影響:
COVID-19の世界の影響は前例のない予想外のもので、産業用ガスタービン業界はパンデミックの結果、あらゆる分野でマイナスの需要ショックを経験しています。電力部門は最も深刻な打撃を受けており、操業停止はパンデミックの悪影響をさらに悪化させました。操業停止の結果、人的資源が不足し、電力開発に遅れが生じました。操業停止は、プロジェクトの資金調達の問題だけでなく、サプライチェーンの困難をも生み出しました。
予測期間中、150-300MWセグメントが最大となる見込み:
産業用ガスタービンの世界市場シェアは、150~300MWセグメントが独占しており、予測期間中も最大シェアを維持する見込みです。これらの大容量タービンは主に発電産業で使用され、温室効果ガスの排出削減に役立っています。しかし、発電業界では主に環境上の理由からGHG排出量を削減する傾向が続いているため、この分野では150~300MWが着実に大きな市場シェアを獲得しています。
予測期間中、CAGRが最も高くなると予想されるのはヘビーデューティー・セグメントである:
予測期間中、大型セグメントは最も高いCAGRを示したが、これは製造ユニットの数が増加していることに加え、発展途上国全体に大規模な工業地帯が統合され、適切な商業基盤が形成されたためです。さらに、工業企業の電力需要を賄うための自家発電所の統合が、大型カテゴリーを押し上げると思われます。
最大のシェアを占める地域:
同地域におけるエネルギー需要と天然ガス使用量の増加により、アジア太平洋地域が予測期間を通じて最大の割合を占めると予想されます。同地域では、温室効果ガスの排出を削減する目的で、発電や輸送のためのガス利用が大きく伸びています。さらに、この地域の市場拡大は、急速な工業化、エネルギー需要の増加、クリーン・エネルギー技術に対する需要の高まりなど、さまざまな要因によるものと考えられます。
CAGRが最も高い地域:
アジア太平洋地域は、発電を石炭に大きく依存しているため、予測期間を通じて有利な成長を遂げると予測されます。石炭の燃焼は大気汚染に大きく寄与しています。二酸化炭素の排出を最小限に抑えるための政府の施策が、日本、中国、オーストラリア、韓国、インドなどの国々でのガスタービンの使用につながっています。さらに、中国のガス需要は、2020年の実質336.6BCMから2021年には378.7BCMに増加し、その多くは産業部門と運輸部門によるものです。
主な発展:
2022年10月、GE Gas PowerとNTPCは、GEの9Eガスタービンで天然ガスと混合した水素の混焼を実証するための覚書に調印しました。この協力関係の下、両社はカワ・ガス発電所からのCO2排出を削減する方法を検討し、将来的にはインドにあるNTPCの設備全体に大規模に展開します。
2022年9月、三菱重工業のパワーソリューション・カンパニーである三菱パワーは、インドにおけるガスタービン発電所のCO2排出量削減目標を達成しました。
レポート内容
- 地域レベル、国レベルの市場シェア評価
- 新規参入企業への戦略的提言
- 2021年、2022年、2023年、2026年、2030年の市場データをカバー
- 市場動向(市場促進要因・阻害要因・機会・脅威・課題・投資機会・提言)
- 市場推定に基づく主要ビジネスセグメントにおける戦略的提言
- 主要な共通トレンドをマッピングした競合情勢
- 詳細な戦略、財務、最近の動向を含む企業プロファイル
- 最新の技術的進歩をマッピングしたサプライチェーン動向
無料カスタマイズサービス:
本レポートをご購読のお客様には、以下のいずれかの無料カスタマイズオプションをご提供いたします:
- 企業プロファイル
- 追加市場プレイヤーの包括的プロファイリング(3社まで)
- 主要企業のSWOT分析(3社まで)
- 地域セグメンテーション
- 顧客の関心に応じた主要国の市場推計・予測・CAGR(注:フィージビリティチェックによる)
- 競合ベンチマーキング
- 製品ポートフォリオ、地理的プレゼンス、戦略的提携に基づく主要企業のベンチマーキング
目次
第1章 エグゼクティブサマリー
第2章 序文
- 概要
- ステークホルダー
- 調査範囲
- 調査手法
- データマイニング
- データ分析
- データ検証
- 調査アプローチ
- 調査ソース
- 1次調査ソース
- 2次調査ソース
- 仮定
第3章 市場動向分析
- 促進要因
- 抑制要因
- 機会
- 脅威
- 技術分析
- 新興市場
- 新型コロナウイルス感染症(COVID-19)の影響
第4章 ポーターのファイブフォース分析
- 供給企業の交渉力
- 買い手の交渉力
- 代替品の脅威
- 新規参入業者の脅威
- 競争企業間の敵対関係
第5章 世界の産業用ガスタービン市場:容量別
- 300MW以上
- 150-300MW
- 100-150MW
- 40-100MW
- 30~40MW
- 20~30MW
- 15~20MW
- 10~15MW
- 7.5-10MW
- 5~7.5MW
- 2~5MW
- 1~2MW
第6章 世界の産業用ガスタービン市場:サイクル別
- 複合サイクル
- シンプルサイクル
- その他のサイクル
第7章 世界の産業用ガスタービン市場:セクター別
- 製造業
- 石油ガス
- 電力会社
- その他の分野
第8章 世界の産業用ガスタービン市場:技術別
- エアロデリバティブ
- 軽工業用
- ヘビーデューティ
- その他の技術
第9章 世界の産業用ガスタービン市場:地域別
- 北米
- 米国
- カナダ
- メキシコ
- 欧州
- ドイツ
- 英国
- イタリア
- フランス
- スペイン
- その他欧州
- アジア太平洋地域
- 日本
- 中国
- インド
- オーストラリア
- ニュージーランド
- 韓国
- その他アジア太平洋地域
- 南米
- アルゼンチン
- ブラジル
- チリ
- その他南米
- 中東とアフリカ
- サウジアラビア
- アラブ首長国連邦
- カタール
- 南アフリカ
- その他中東とアフリカ
第10章 主な発展
- 契約、パートナーシップ、コラボレーション、合弁事業
- 買収と合併
- 新製品の発売
- 事業拡大
- その他の主要戦略
第11章 企業プロファイル
- Ansaldo Energia SpA
- Baker Hughes Company
- Bharat Heavy Electricals Limited
- Capstone Green Energy Corporation
- Centrax Industries Ltd
- Cummins Inc
- Doosan Heavy Industries & Construction Co Ltd
- Dresser-Rand Group Inc
- General Electric Company
- Harbin Electric International Company Limited
- Kawasaki Heavy Industries Ltd
- Man Diesel and Turbo SE
- MAN Energy Solutions
- Mitsubishi Heavy Industries Ltd
- Mitsubishi Hitachi Power Systems Ltd.
- MTU Aero Engines AG/Vericor Power Systems LLC
- Nanjing Turbine & Electric Machinery(Group)Co., Ltd
- Niigata Power Systems Co Ltd
- OPRA Turbines BV
- Siemens AG
- Siemens Energy
- Solar Turbines
- Turboden S.p.A.
- UEC-Saturn
- Wartsila Corporation
List of Tables
- Table 1 Global Industrial Gas Turbine Market Outlook, By Region (2021-2030) ($MN)
- Table 2 Global Industrial Gas Turbine Market Outlook, By Capacity (2021-2030) ($MN)
- Table 3 Global Industrial Gas Turbine Market Outlook, By 300+ MW (2021-2030) ($MN)
- Table 4 Global Industrial Gas Turbine Market Outlook, By 150-300 MW (2021-2030) ($MN)
- Table 5 Global Industrial Gas Turbine Market Outlook, By 100-150 MW (2021-2030) ($MN)
- Table 6 Global Industrial Gas Turbine Market Outlook, By 40-100 MW (2021-2030) ($MN)
- Table 7 Global Industrial Gas Turbine Market Outlook, By 30-40 MW (2021-2030) ($MN)
- Table 8 Global Industrial Gas Turbine Market Outlook, By 20-30 MW (2021-2030) ($MN)
- Table 9 Global Industrial Gas Turbine Market Outlook, By 15-20 MW (2021-2030) ($MN)
- Table 10 Global Industrial Gas Turbine Market Outlook, By 10-15 MW (2021-2030) ($MN)
- Table 11 Global Industrial Gas Turbine Market Outlook, By 7.5-10 MW (2021-2030) ($MN)
- Table 12 Global Industrial Gas Turbine Market Outlook, By 5-7.5 MW (2021-2030) ($MN)
- Table 13 Global Industrial Gas Turbine Market Outlook, By 2-5 MW (2021-2030) ($MN)
- Table 14 Global Industrial Gas Turbine Market Outlook, By 1-2 MW (2021-2030) ($MN)
- Table 15 Global Industrial Gas Turbine Market Outlook, By Cycle (2021-2030) ($MN)
- Table 16 Global Industrial Gas Turbine Market Outlook, By Combined Cycle (2021-2030) ($MN)
- Table 17 Global Industrial Gas Turbine Market Outlook, By Simple Cycle (2021-2030) ($MN)
- Table 18 Global Industrial Gas Turbine Market Outlook, By Other Cycles (2021-2030) ($MN)
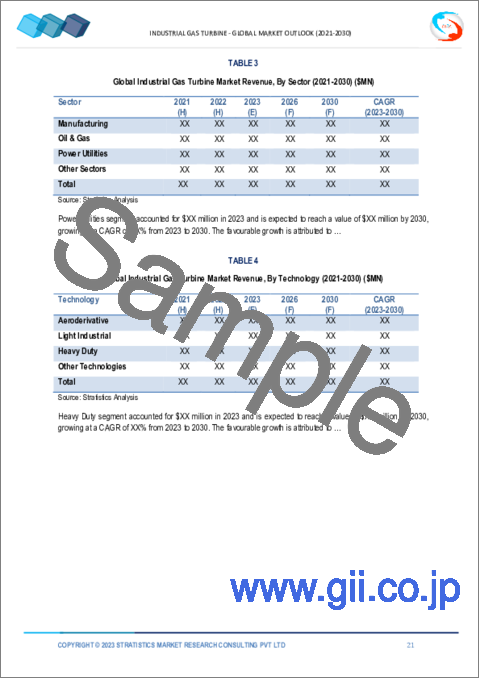
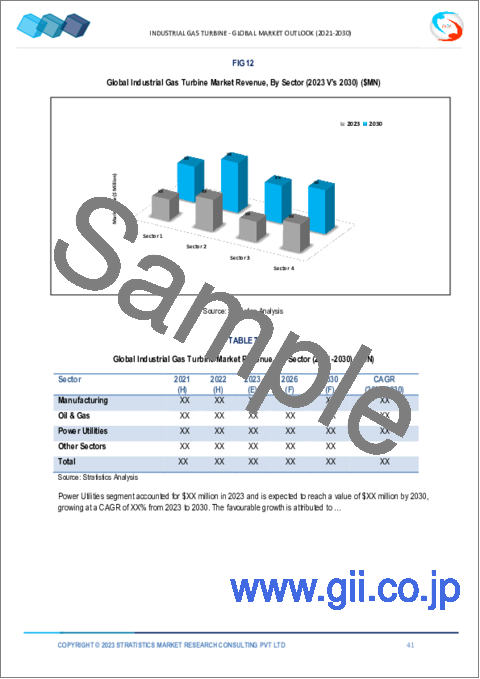
- Table 19 Global Industrial Gas Turbine Market Outlook, By Sector (2021-2030) ($MN)
- Table 20 Global Industrial Gas Turbine Market Outlook, By Manufacturing (2021-2030) ($MN)
- Table 21 Global Industrial Gas Turbine Market Outlook, By Oil & Gas (2021-2030) ($MN)
- Table 22 Global Industrial Gas Turbine Market Outlook, By Power Utilities (2021-2030) ($MN)
- Table 23 Global Industrial Gas Turbine Market Outlook, By Other Sectors (2021-2030) ($MN)
- Table 24 Global Industrial Gas Turbine Market Outlook, By Technology (2021-2030) ($MN)
- Table 25 Global Industrial Gas Turbine Market Outlook, By Aeroderivative (2021-2030) ($MN)
- Table 26 Global Industrial Gas Turbine Market Outlook, By Light Industrial (2021-2030) ($MN)
- Table 27 Global Industrial Gas Turbine Market Outlook, By Heavy Duty (2021-2030) ($MN)
- Table 28 Global Industrial Gas Turbine Market Outlook, By Other Technologies (2021-2030) ($MN)
Note: Tables for North America, Europe, APAC, South America, and Middle East & Africa Regions are also represented in the same manner as above.
According to Stratistics MRC, the Global Industrial Gas Turbine Market is accounted for $10.5 billion in 2023 and is expected to reach $17.7 billion by 2030 growing at a CAGR of 7.8% during the forecast period. An industrial gas turbine is a type of combustion engine that produces mechanical energy from fuels such as natural gas or liquid fuels. This mechanical energy is used to power an integrated generator, which generates electricity. Traditional gas-fired and oil-fired steam power plants have been phased out in exchange for more efficient combined-cycle power plants that use gas turbines to burn gas or oil.
According to the International Energy Agency (IEA), the global electricity demand soared by 6% in 2021 as compared to the previous year. Owing to the higher energy usage, advanced control and monitoring systems are extensively integrated within existing energy channels for enhancing efficiency and performance.
Market Dynamics:
Driver:
Broader scope in emerging economies
The rise of industrial centers and rising FDI in all major manufacturing sectors across emerging nations such as China, India, Brazil, and Southeast Asian countries are expected to generate attractive growth possibilities for this market over the forecast period. Various international developers that are interested in establishing enterprises through FDI incentive schemes are focusing on emerging economies. This will indirectly strengthen the country's economy and accelerate industrialization. To attract investments and promote expansion, countries such as the United States and many Asian countries have modified and reformed their manufacturing rules and procedures.
Restraint:
Natural gas price volatility
Natural gas prices are affected by actions that potentially disrupt the natural gas supply. Geopolitical tensions are a disruptive element that creates uncertainty about gas availability and demand. This may result in increased volatility in gas prices. Gas prices in the United States have dropped dramatically as a result of shale gas extraction, but prices elsewhere in the world remain relatively high. The majority of the countries in the Middle East region have large natural gas reserves. Because of political and cultural difficulties, it is a highly volatile region.
Opportunity:
Increased focus on self-generated power generation
Product installation will be aided by the constant growth of manufacturing units to fulfill the rising demand for produced goods. The growing desire for self-regulating power generation systems will promote the adoption of gas turbines. Governments throughout the world are pursuing ambitious strategies for integrating renewable energy sources into the energy mix. Several funds and investments in renewable energy have been announced, supporting the demand for more power generation.
Threat:
A shift toward renewable energy
According to the June 2017 BP Statistical Review of World Energy, total worldwide natural gas reserves are 186.6 trillion cubic meters, enough to last for 55 years based on present consumption rates. If the United States starts to export natural gas to international markets, the reserve-to-production ratio will decrease dramatically. Despite the fact that coal output and consumption are substantially higher in Asia Pacific's fast-growing nations, the worldwide supply of natural gas is only enough to endure for half the period. Solar and wind power plants provide clean energy. Renewable energy investment is projected to have an impact on coal-fired power facilities. As a result, the market for industrial gas turbines faces difficulty due to limited natural gas sources.
COVID-19 Impact:
COVID-19's global impact has been unprecedented and unexpected, with the industrial gas turbine industry experiencing a negative demand shock across all areas as a result of the pandemic. The power sector is one of the most severely hit, and the lockdowns have only exacerbated the pandemic's negative impact. The lack of human resources as a result of the shutdown has caused delays in power development. The shutdown created supply chain difficulties as well as project funding issues.
The 150-300 MW segment is expected to be the largest during the forecast period:
The 150-300 MW segment dominated the global industrial gas turbine market share and is expected to hold the largest share over the forecast period. These high-capacity turbines are primarily used in the power generation industry and aid in the reduction of GHG emissions. However, as the trend in power generation continues to lower GHG emissions, mostly for environmental reasons, the 150-300 MW has steadily obtained a significant market share in the sector.
The heavy duty segment is expected to have the highest CAGR during the forecast period:
Heavy duty segment commanded the highest CAGR during the projection period due to the increasing number of manufacturing units, together with the integration of large-scale industrial zones throughout developing nations, which resulted in an adequate commercial platform. Additionally, the integration of captive-producing power plants to service the electrical demand of industrial enterprises would boost the heavy-duty category.
Region with largest share:
Due to a rise in energy demand and natural gas usage in the region, the Asia-Pacific region is expected to have the largest proportion throughout the anticipated period. In the region, there has been significant growth in the usage of gas for power generation and transportation, with the aim of reducing greenhouse gas emissions. Furthermore, the region's market expansion may be attributed to various factors, including rapid industrialization, increased energy demand, and rising demand for clean energy technology.
Region with highest CAGR:
The Asia-Pacific region is projected to have lucrative growth throughout the extrapolated period as it heavily relies on coal for power generation. Coal combustion contributes significantly to air pollution. Government measures to minimize carbon emissions have led to the use of gas turbines in nations such as Japan, China, Australia, South Korea, India, and others. Moreover, China's gas demand increased from essentially 336.6 BCM in 2020 to around 378.7 BCM in 2021, with much of the demand coming from the industrial and transportation sectors.
Key players in the market
Some of the key players in Industrial Gas Turbine market include Ansaldo Energia SpA , Baker Hughes Company, Bharat Heavy Electricals Limited, Capstone Green Energy Corporation, Centrax Industries Ltd, Cummins Inc, Doosan Heavy Industries & Construction Co Ltd, Dresser-Rand Group Inc, General Electric Company, Harbin Electric International Company Limited, Kawasaki Heavy Industries Ltd, Man Diesel and Turbo SE, MAN Energy Solutions, Mitsubishi Heavy Industries Ltd, Mitsubishi Hitachi Power Systems Ltd., MTU Aero Engines AG/Vericor Power Systems LLC, Nanjing Turbine & Electric Machinery (Group) Co., Ltd, Niigata Power Systems Co Ltd, OPRA Turbines BV, Siemens AG, Siemens Energy, Solar Turbines, Turboden S.p.A., UEC-Saturn and Wartsila Corporation.
Key Developments:
In October 2022, GE Gas Power and NTPC signed a Memorandum of Understanding (MoU) for the viability of demonstrating hydrogen co-firing mixed with natural gas in GE's 9E gas turbines. Under this collaboration, they will explore the ways to reduce CO2 emissions from the Kawa gas power plant and future deployment at scale across NTPC's installed units in India.
In September 2022, Mitsubishi Power, a power solutions company of Mitsubishi Heavy Industries, Ltd. (MHI), has reached 8,000 total Actual Operating Hours (AOH) for the M701JAC gas turbine. One of Thailand's largest Independent Power Producers (IPPs), Gulf Energy Development Public Company Limited, and Mitsui & Co., Ltd. formed a joint venture, and Gulf Energy Development Public Company Limited installed the subject gas turbine unit for a gas turbine combined cycle power generation system used in that venture.
Capacities Covered:
- 300+ MW
- 150-300 MW
- 100-150 MW
- 40-100 MW
- 30-40 MW
- 20-30 MW
- 15-20 MW
- 10-15 MW
- 7.5-10 MW
- 5-7.5 MW
- 2-5 MW
- 1-2 MW
Cycles Covered:
- Combined Cycle
- Simple Cycle
- Other Cycles
Sectors Covered:
- Manufacturing
- Oil & Gas
- Power Utilities
- Other Sectors
Technologies Covered:
- Aeroderivative
- Light Industrial
- Heavy Duty
- Other Technologies
Regions Covered:
- North America
- US
- Canada
- Mexico
- Europe
- Germany
- UK
- Italy
- France
- Spain
- Rest of Europe
- Asia Pacific
- Japan
- China
- India
- Australia
- New Zealand
- South Korea
- Rest of Asia Pacific
- South America
- Argentina
- Brazil
- Chile
- Rest of South America
- Middle East & Africa
- Saudi Arabia
- UAE
- Qatar
- South Africa
- Rest of Middle East & Africa
What our report offers:
- Market share assessments for the regional and country-level segments
- Strategic recommendations for the new entrants
- Covers Market data for the years 2021, 2022, 2023, 2026, and 2030
- Market Trends (Drivers, Constraints, Opportunities, Threats, Challenges, Investment Opportunities, and recommendations)
- Strategic recommendations in key business segments based on the market estimations
- Competitive landscaping mapping the key common trends
- Company profiling with detailed strategies, financials, and recent developments
- Supply chain trends mapping the latest technological advancements
Free Customization Offerings:
All the customers of this report will be entitled to receive one of the following free customization options:
- Company Profiling
- Comprehensive profiling of additional market players (up to 3)
- SWOT Analysis of key players (up to 3)
- Regional Segmentation
- Market estimations, Forecasts and CAGR of any prominent country as per the client's interest (Note: Depends on feasibility check)
- Competitive Benchmarking
- Benchmarking of key players based on product portfolio, geographical presence, and strategic alliances
Table of Contents
1 Executive Summary
2 Preface
- 2.1 Abstract
- 2.2 Stake Holders
- 2.3 Research Scope
- 2.4 Research Methodology
- 2.4.1 Data Mining
- 2.4.2 Data Analysis
- 2.4.3 Data Validation
- 2.4.4 Research Approach
- 2.5 Research Sources
- 2.5.1 Primary Research Sources
- 2.5.2 Secondary Research Sources
- 2.5.3 Assumptions
3 Market Trend Analysis
- 3.1 Introduction
- 3.2 Drivers
- 3.3 Restraints
- 3.4 Opportunities
- 3.5 Threats
- 3.6 Technology Analysis
- 3.7 Emerging Markets
- 3.8 Impact of Covid-19
4 Porters Five Force Analysis
- 4.1 Bargaining power of suppliers
- 4.2 Bargaining power of buyers
- 4.3 Threat of substitutes
- 4.4 Threat of new entrants
- 4.5 Competitive rivalry
5 Global Industrial Gas Turbine Market, By Capacity
- 5.1 Introduction
- 5.2 300+ MW
- 5.3 150-300 MW
- 5.4 100-150 MW
- 5.5 40-100 MW
- 5.6 30-40 MW
- 5.7 20-30 MW
- 5.8 15-20 MW
- 5.9 10-15 MW
- 5.10 7.5-10 MW
- 5.11 5-7.5 MW
- 5.12 2-5 MW
- 5.13 1-2 MW
6 Global Industrial Gas Turbine Market, By Cycle
- 6.1 Introduction
- 6.2 Combined Cycle
- 6.3 Simple Cycle
- 6.4 Other Cycles
7 Global Industrial Gas Turbine Market, By Sector
- 7.1 Introduction
- 7.2 Manufacturing
- 7.3 Oil & Gas
- 7.4 Power Utilities
- 7.5 Other Sectors
8 Global Industrial Gas Turbine Market, By Technology
- 8.1 Introduction
- 8.2 Aeroderivative
- 8.3 Light Industrial
- 8.4 Heavy Duty
- 8.5 Other Technologies
9 Global Industrial Gas Turbine Market, By Geography
- 9.1 Introduction
- 9.2 North America
- 9.2.1 US
- 9.2.2 Canada
- 9.2.3 Mexico
- 9.3 Europe
- 9.3.1 Germany
- 9.3.2 UK
- 9.3.3 Italy
- 9.3.4 France
- 9.3.5 Spain
- 9.3.6 Rest of Europe
- 9.4 Asia Pacific
- 9.4.1 Japan
- 9.4.2 China
- 9.4.3 India
- 9.4.4 Australia
- 9.4.5 New Zealand
- 9.4.6 South Korea
- 9.4.7 Rest of Asia Pacific
- 9.5 South America
- 9.5.1 Argentina
- 9.5.2 Brazil
- 9.5.3 Chile
- 9.5.4 Rest of South America
- 9.6 Middle East & Africa
- 9.6.1 Saudi Arabia
- 9.6.2 UAE
- 9.6.3 Qatar
- 9.6.4 South Africa
- 9.6.5 Rest of Middle East & Africa
10 Key Developments
- 10.1 Agreements, Partnerships, Collaborations and Joint Ventures
- 10.2 Acquisitions & Mergers
- 10.3 New Product Launch
- 10.4 Expansions
- 10.5 Other Key Strategies
11 Company Profiling
- 11.1 Ansaldo Energia SpA
- 11.2 Baker Hughes Company
- 11.3 Bharat Heavy Electricals Limited
- 11.4 Capstone Green Energy Corporation
- 11.5 Centrax Industries Ltd
- 11.6 Cummins Inc
- 11.7 Doosan Heavy Industries & Construction Co Ltd
- 11.8 Dresser-Rand Group Inc
- 11.9 General Electric Company
- 11.10 Harbin Electric International Company Limited
- 11.11 Kawasaki Heavy Industries Ltd
- 11.12 Man Diesel and Turbo SE
- 11.13 MAN Energy Solutions
- 11.14 Mitsubishi Heavy Industries Ltd
- 11.15 Mitsubishi Hitachi Power Systems Ltd.
- 11.16 MTU Aero Engines AG/Vericor Power Systems LLC
- 11.17 Nanjing Turbine & Electric Machinery (Group) Co., Ltd
- 11.18 Niigata Power Systems Co Ltd
- 11.19 OPRA Turbines BV
- 11.20 Siemens AG
- 11.21 Siemens Energy
- 11.22 Solar Turbines
- 11.23 Turboden S.p.A.
- 11.24 UEC-Saturn
- 11.25 Wartsila Corporation