|
|
市場調査レポート
商品コード
1503416
電気デジタルツイン市場の2030年までの予測: タイプ別、コンポーネントタイプ別、技術別、用途別、エンドユーザー別、地域別の世界分析Electrical Digital Twin Market Forecasts to 2030 - Global Analysis By Type, Component Type, Technology, Application, End User and By Geography |
||||||
|
|||||||
カスタマイズ可能
|
|||||||

| 電気デジタルツイン市場の2030年までの予測: タイプ別、コンポーネントタイプ別、技術別、用途別、エンドユーザー別、地域別の世界分析 |
|
出版日: 2024年06月06日
発行: Stratistics Market Research Consulting
ページ情報: 英文 200+ Pages
納期: 2~3営業日
|

全表示
- 概要
- 図表
- 目次
Stratistics MRCによると、世界の電気デジタルツイン市場は2024年に11億米ドルを占め、予測期間中のCAGRは14.2%で成長し、2030年には26億米ドルに達すると予測されています。
電気デジタルツインは、電気システムを仮想的に表現したもので、実世界をリアルタイムで反映します。センサーやIoTデバイスからのデータを統合し、システム性能のシミュレーション、予測、最適化を行う。このデジタル・レプリカは、システムの動作に関する洞察を提供し、潜在的な問題を特定し、意思決定を促進することで、効率的な監視、分析、メンテナンスを可能にします。先進技術を活用することで、運用効率、信頼性、全体的なシステム管理が強化されます。
国際エネルギー機関(IEA)によると、世界の発電量に占める再生可能エネルギーの割合は、2019年の27%に対し、2020年には29%となった。再生可能エネルギーによる発電量は8%増加し、2021年には8,300TWhに達すると予想されています。
変動する再生可能エネルギーの統合と分散化
変動する再生可能エネルギーの統合と分散化は、市場において極めて重要です。デジタルツインは、再生可能エネルギー資産のリアルタイムモニタリングと最適化を可能にし、その信頼性と効率を高める。分散化は、多様な電源と場所に発電を分散させることで、グリッドの回復力を促進します。これらの技術を組み合わせることで、ユーティリティ企業や発電事業者は、急速に進化するエネルギー環境において、グリッドの変動を管理し、エネルギーフローを最適化し、持続可能性の目標を効果的に達成することができます。
システムの複雑性とデータの可用性
市場は、システムの複雑性とデータの可用性という大きな課題に直面しています。多様なサブシステムを統合し、多数のソースからのリアルタイム・データ・アクセスを確保することがハードルとなっています。正確なシミュレーションと予測分析を実現するには、包括的なデータセットが必要であり、多くの場合、異なるフォーマットやプラットフォームに分散しています。これらの課題を克服するには、デジタルツインエコシステム全体の同期と信頼性を維持するための、強固な統合フレームワークと高度なデータ管理戦略が必要です。
資産パフォーマンス管理の改善
市場における資産パフォーマンス管理(APM)の向上は、高度なアナリティクスとリアルタイムのモニタリングを通じて業務効率を高める。物理資産の仮想レプリカを作成することで、APMは保守スケジュールを最適化し、故障を予測し、ダウンタイムを削減します。最終的に、APMをエレクトリカル・デジタルツインに統合することで、製造業、公益事業、インフラストラクチャなどの業界において、資産の信頼性、寿命、全体的なオペレーションの卓越性が確保されます。
標準化の欠如
市場では、標準化の欠如が大きな課題となっています。この欠如は、異なるプラットフォームやシステム間の相互運用性を複雑にし、シームレスなデータ交換と統合を妨げます。これは互換性の問題につながり、カスタム統合に関連するコストを増加させる。共通のプロトコルとフォーマットを確立し、業界全体でより効果的なコラボレーションを可能にし、オペレーションとメンテナンスプロセスの最適化においてデジタルツインの潜在能力を最大限に発揮できるようにするためには、標準化の取り組みが不可欠です。
COVID-19の影響:
COVID-19の大流行は、業界全体での採用を加速させ、市場に大きな影響を与えました。サプライチェーンやオペレーションの混乱に伴い、企業は遠隔監視や予知保全のためにデジタルツインを利用するようになり、オペレーションの回復力が強化されました。この時期、不確実性の中でリスクを軽減し、資産パフォーマンスを最適化する上で、この技術が果たす役割が浮き彫りになった。企業がデジタルトランスフォーメーションとパンデミック後の回復力を優先させる中、電気デジタルツイン市場は、効率性、コスト削減、事業継続性において実証されたメリットにより、持続的な成長の態勢を整えています。
予測期間中、アクチュエータ分野が最大になる見込み
予測期間中、アクチュエータが最大となる見込み。これらのデバイスは、デジタル命令を物理的な動きに変換し、正確な制御と監視を可能にします。アクチュエータは、製造、エネルギー、輸送などの産業において、予知保全、運用効率、システム最適化の精度を保証します。アクチュエーターの統合はシミュレーションの忠実度を高め、複雑で相互接続されたシステムの性能と信頼性を向上させるための包括的な分析とリアルタイムの調整を可能にします。
予測期間中、プロセス最適化分野のCAGRが最も高くなる見込み
予測期間中、プロセス最適化分野のCAGRが最も高くなると予想されます。電気システムの正確なデジタルレプリカを作成することで、企業は運用を合理化し、メンテナンスの必要性を予測し、リソース配分を最適化することができます。このプロアクティブなアプローチは、ダウンタイムを最小限に抑え、コストを削減し、全体的な生産性を向上させる。高度なアナリティクスとIoTの統合を活用することで、企業は電気インフラの高い信頼性と持続可能性を実現し、進化する市場の需要に効果的に応えることができます。
最大のシェアを占める地域
予測期間中、北米が最大の市場シェアを占めると予測されます。物理的な電気システムのデジタルレプリカにより、製造、エネルギー、公益事業などさまざまな産業でリアルタイムの監視、予知保全、性能最適化が可能になります。スマートグリッドソリューションの採用が進み、運用効率への注目が高まる中、同地域ではシミュレーションモデルを活用して信頼性を向上させ、資産管理戦略全体を改善することで、市場は大幅な成長を遂げる構えです。
CAGRが最も高い地域:
予測期間中、アジア太平洋地域が最も高いCAGRを維持すると予測されます。太陽光や風力などの再生可能エネルギーの導入が進む中、これらのエネルギー源の断続性や変動性を管理するための高度なデジタルソリューションのニーズが高まっています。デジタルツインは、グリッドへの再生可能エネルギーの統合を最適化するのに役立ちます。デジタルトランスフォーメーションとインダストリー4.0を目指した政府の支援政策やイニシアティブは、電気インフラを含む様々なセクターでデジタルツインの採用を加速しています。
無料のカスタマイズサービス
本レポートをご購読のお客様には、以下の無料カスタマイズオプションのいずれかをご利用いただけます:
- 企業プロファイル
- 追加市場プレイヤーの包括的プロファイリング(3社まで)
- 主要企業のSWOT分析(3社まで)
- 地域セグメンテーション
- 顧客の関心に応じた主要国の市場推計・予測・CAGR(注:フィージビリティチェックによる)
- 競合ベンチマーキング
- 製品ポートフォリオ、地理的プレゼンス、戦略的提携に基づく主要企業のベンチマーキング
目次
第1章 エグゼクティブサマリー
第2章 序文
- 概要
- ステークホルダー
- 調査範囲
- 調査手法
- データマイニング
- データ分析
- データ検証
- 調査アプローチ
- 調査情報源
- 1次調査情報源
- 2次調査情報源
- 前提条件
第3章 市場動向分析
- 促進要因
- 抑制要因
- 機会
- 脅威
- 技術分析
- 用途分析
- エンドユーザー分析
- 新興市場
- COVID-19の影響
第4章 ポーターのファイブフォース分析
- 供給企業の交渉力
- 買い手の交渉力
- 代替品の脅威
- 新規参入業者の脅威
- 競争企業間の敵対関係
第5章 世界の電気デジタルツイン市場:タイプ別
- デジタルグリッド
- デジタル風力発電所
- デジタルガス&蒸気発電所
- 分散型エネルギー資源
- デジタル水力発電所
- その他のタイプ
第6章 世界の電気デジタルツイン市場:コンポーネントタイプ別
- センサー
- アクチュエータ
- 制御システム
- 通信モジュール
- ソフトウェアプラットフォーム
第7章 世界の電気デジタルツイン市場:技術別
- クラウドコンピューティングとエッジコンピューティング
- 人工知能
- 拡張現実(AR)
- 機械学習
- その他の技術
第8章 世界の電気デジタルツイン市場:用途別
- 予知保全
- パフォーマンスの最適化
- 資産運用管理
- プロセス最適化
- その他の用途
第9章 世界の電気デジタルツイン市場:エンドユーザー別
- エネルギー・公益事業
- 製造業
- 自動車
- 航空宇宙および防衛
- ヘルスケア
- 小売り
- その他のエンドユーザー
第10章 世界の電気デジタルツイン市場:地域別
- 北米
- 米国
- カナダ
- メキシコ
- 欧州
- ドイツ
- 英国
- イタリア
- フランス
- スペイン
- その他欧州
- アジア太平洋地域
- 日本
- 中国
- インド
- オーストラリア
- ニュージーランド
- 韓国
- その他アジア太平洋地域
- 南米
- アルゼンチン
- ブラジル
- チリ
- その他南米
- 中東・アフリカ
- サウジアラビア
- アラブ首長国連邦
- カタール
- 南アフリカ
- その他中東とアフリカ
第11章 主な発展
- 契約、パートナーシップ、コラボレーション、合弁事業
- 買収と合併
- 新製品発売
- 事業拡大
- その他の主要戦略
第12章 企業プロファイリング
- Siemens AG
- ABB Group
- Schneider Electric SE
- General Electric Company
- IBM Corporation
- Dassault Systemes
- Bentley Systems, Incorporated
- Honeywell International Inc.
- Hitachi, Ltd.
- Rockwell Automation, Inc.
- SAP SE
- Hexagon AB
- ESI Group
- Synopsys, Inc.
- Smart Wires Inc.
- Lanner Group
- Cyient Ltd.
List of Tables
- Table 1 Global Electrical Digital Twin Market Outlook, By Region (2022-2030) ($MN)
- Table 2 Global Electrical Digital Twin Market Outlook, By Type (2022-2030) ($MN)
- Table 3 Global Electrical Digital Twin Market Outlook, By Digital Grid (2022-2030) ($MN)
- Table 4 Global Electrical Digital Twin Market Outlook, By Digital Wind Farm (2022-2030) ($MN)
- Table 5 Global Electrical Digital Twin Market Outlook, By Digital Gas & Steam Power Plant (2022-2030) ($MN)
- Table 6 Global Electrical Digital Twin Market Outlook, By Distributed Energy Resources (2022-2030) ($MN)
- Table 7 Global Electrical Digital Twin Market Outlook, By Digital Hydropower Plant (2022-2030) ($MN)
- Table 8 Global Electrical Digital Twin Market Outlook, By Other Types (2022-2030) ($MN)
- Table 9 Global Electrical Digital Twin Market Outlook, By Component Type (2022-2030) ($MN)
- Table 10 Global Electrical Digital Twin Market Outlook, By Sensors (2022-2030) ($MN)
- Table 11 Global Electrical Digital Twin Market Outlook, By Actuators (2022-2030) ($MN)
- Table 12 Global Electrical Digital Twin Market Outlook, By Control Systems (2022-2030) ($MN)
- Table 13 Global Electrical Digital Twin Market Outlook, By Communication Modules (2022-2030) ($MN)
- Table 14 Global Electrical Digital Twin Market Outlook, By Software Platforms (2022-2030) ($MN)
- Table 15 Global Electrical Digital Twin Market Outlook, By Technology (2022-2030) ($MN)
- Table 16 Global Electrical Digital Twin Market Outlook, By Cloud Computing and Edge Computing (2022-2030) ($MN)
- Table 17 Global Electrical Digital Twin Market Outlook, By Artificial Intelligence (2022-2030) ($MN)
- Table 18 Global Electrical Digital Twin Market Outlook, By Augmented Reality (AR) (2022-2030) ($MN)
- Table 19 Global Electrical Digital Twin Market Outlook, By Machine Learning (2022-2030) ($MN)
- Table 20 Global Electrical Digital Twin Market Outlook, By Other Technologies (2022-2030) ($MN)
- Table 21 Global Electrical Digital Twin Market Outlook, By Application (2022-2030) ($MN)
- Table 22 Global Electrical Digital Twin Market Outlook, By Predictive Maintenance (2022-2030) ($MN)
- Table 23 Global Electrical Digital Twin Market Outlook, By Performance Optimization (2022-2030) ($MN)
- Table 24 Global Electrical Digital Twin Market Outlook, By Asset Management (2022-2030) ($MN)
- Table 25 Global Electrical Digital Twin Market Outlook, By Process Optimization (2022-2030) ($MN)
- Table 26 Global Electrical Digital Twin Market Outlook, By Other Applications (2022-2030) ($MN)
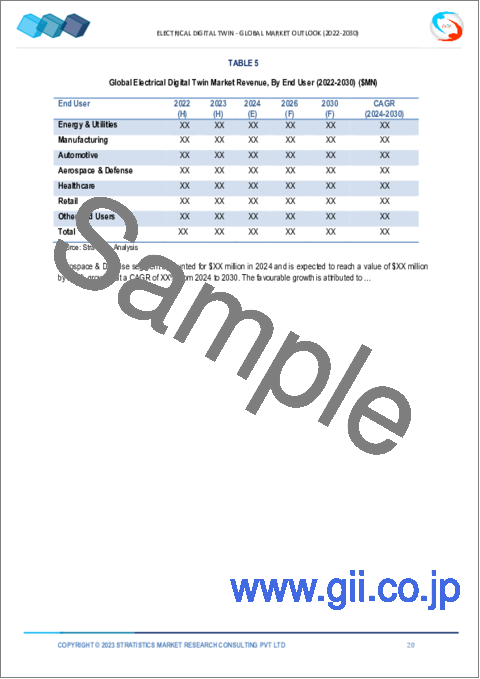
- Table 27 Global Electrical Digital Twin Market Outlook, By End User 2022-2030) ($MN)
- Table 28 Global Electrical Digital Twin Market Outlook, By Energy & Utilities (2022-2030) ($MN)
- Table 29 Global Electrical Digital Twin Market Outlook, By Manufacturing (2022-2030) ($MN)
- Table 30 Global Electrical Digital Twin Market Outlook, By Automotive (2022-2030) ($MN)
- Table 31 Global Electrical Digital Twin Market Outlook, By Aerospace & Defense (2022-2030) ($MN)
- Table 32 Global Electrical Digital Twin Market Outlook, By Healthcare (2022-2030) ($MN)
- Table 33 Global Electrical Digital Twin Market Outlook, By Retail (2022-2030) ($MN)
- Table 34 Global Electrical Digital Twin Market Outlook, By Other End Users (2022-2030) ($MN)
Note: Tables for North America, Europe, APAC, South America, and Middle East & Africa Regions are also represented in the same manner as above.
According to Stratistics MRC, the Global Electrical Digital Twin Market is accounted for $1.1 billion in 2024 and is expected to reach $2.6 billion by 2030 growing at a CAGR of 14.2% during the forecast period. An Electrical Digital Twin is a virtual representation of an electrical system that mirrors its real-world counterpart in real-time. It integrates data from sensors and IoT devices to simulate, predict, and optimize system performance. This digital replica enables efficient monitoring, analysis, and maintenance by providing insights into system behavior, identifying potential issues, and facilitating decision-making. By leveraging advanced technologies, it enhances operational efficiency, reliability, and overall system management.
According to the International Energy Agency, the share of renewable in global electricity generation was 29% in 2020 compared with 27% in 2019. Renewable electricity generation is expected to grow by 8% to reach 8,300 TWh in 2021.
Market Dynamics:
Driver:
Integration of variable renewable energy and decentralization
The integration of variable renewable energy sources and decentralization is pivotal in the market. Digital twins enable real-time monitoring and optimization of renewable energy assets, enhancing their reliability and efficiency. Decentralization facilitates grid resilience by distributing power generation across diverse sources and locations. Together, these technologies empower utilities and operators to manage grid variability, optimize energy flows, and meet sustainability goals effectively in a rapidly evolving energy landscape.
Restraint:
System complexity and data availability
The market faces significant challenges with system complexity and data availability. Integrating diverse subsystems and ensuring real-time data access from numerous sources pose hurdles. Achieving accurate simulations and predictive analytics requires comprehensive data sets, often dispersed across different formats and platforms. Overcoming these challenges demands robust integration frameworks and advanced data management strategies to maintain synchronization and reliability across the digital twin ecosystem.
Opportunity:
Improved asset performance management
Improved asset performance management (APM) in the market enhances operational efficiency through advanced analytics and real-time monitoring. By creating virtual replicas of physical assets, APM optimizes maintenance schedules, predicts failures, and reduces downtime. Ultimately, integrating APM into Electrical Digital Twins ensures robust asset reliability, longevity, and overall operational excellence in industries such as manufacturing, utilities, and infrastructure.
Threat:
Lack of standardization
In the market, a significant challenge lies in the lack of standardization. This absence complicates interoperability between different platforms and systems, hindering seamless data exchange and integration. It leads to compatibility issues and increases costs associated with custom integrations. Standardization efforts are essential to establish common protocols and formats, enabling more effective collaboration across the industry and ensuring that digital twins can deliver their full potential in optimizing operations and maintenance processes.
Covid-19 Impact:
The COVID-19 pandemic significantly influenced the market by accelerating its adoption across industries. With disruptions in supply chains and operations, companies increasingly turned to digital twins for remote monitoring and predictive maintenance, enhancing operational resilience. This period underscored the technology's role in mitigating risks and optimizing asset performance amidst uncertainty. As businesses prioritize digital transformation and resilience post-pandemic, the Electrical Digital Twin market is poised for sustained growth, driven by its proven benefits in efficiency, cost reduction, and operational continuity.
The actuators segment is expected to be the largest during the forecast period
The actuators is expected to be the largest during the forecast period. These devices translate digital instructions into physical movements, enabling precise control and monitoring. Actuators ensure accuracy in predictive maintenance, operational efficiency, and system optimization across industries such as manufacturing, energy, and transportation. Their integration enhances simulation fidelity, enabling comprehensive analysis and real-time adjustments for improved performance and reliability in complex, interconnected systems.
The process optimization segment is expected to have the highest CAGR during the forecast period
The process optimization segment is expected to have the highest CAGR during the forecast period. By creating accurate digital replicas of electrical systems, companies can streamline operations, predict maintenance needs, and optimize resource allocation. This proactive approach minimizes downtime, reduces costs, and improves overall productivity. Leveraging advanced analytics and IoT integration, organizations can achieve higher reliability and sustainability in their electrical infrastructure, meeting evolving market demands effectively.
Region with largest share:
North America is projected to hold the largest market share during the forecast period. These digital replicas of physical electrical systems enable real-time monitoring, predictive maintenance, and performance optimization across various industries such as manufacturing, energy, and utilities. With growing adoption of smart grid solutions and increasing focus on operational efficiency, the market is poised for substantial growth, leveraging simulation models to enhance reliability and improve overall asset management strategies in the region.
Region with highest CAGR:
Asia Pacific is projected to hold the highest CAGR over the forecast period. With the increasing adoption of renewable energy sources like solar and wind, there is a growing need for sophisticated digital solutions to manage the intermittency and variability of these sources. Digital twins can help optimize the integration of renewables into the grid. Supportive government policies and initiatives aimed at digital transformation and Industry 4.0 are accelerating the adoption of digital twins across various sectors, including electrical infrastructure.
Key players in the market
Some of the key players in Electrical Digital Twin market include Siemens AG, ABB Group, Schneider Electric SE, General Electric Company, IBM Corporation, Dassault Systemes, Bentley Systems, Incorporated, Honeywell International Inc., Hitachi, Ltd., Rockwell Automation, Inc., SAP SE., Hexagon AB, ESI Group, Synopsys, Inc., Smart Wires Inc., Lanner Group and Cyient Ltd.
Key Developments:
In October 2023, ABB has signed a partnership with Canadian-based Computer Modelling Group (CMG) - a global simulation technology company that has been involved in carbon capture for over 20 years - to incorporate subsurface modelling into their existing digital twin technology for commercial carbon capture and storage (CCS) operations.
In April 2023, Siemens LDA and Sulzer announce digital collaboration bringing together their respective IoT-platforms and services, BLUE BOX(TM) and SIDRIVE IQ, the two companies are collaborating to deliver an integrated solution that improves equipment reliability and cuts operations costs.
Types Covered:
- Digital Grid
- Digital Wind Farm
- Digital Gas & Steam Power Plant
- Distributed Energy Resources
- Digital Hydropower Plant
- Other Types
Component Types Covered:
- Sensors
- Actuators
- Control Systems
- Communication Modules
- Software Platforms
Technologies Covered:
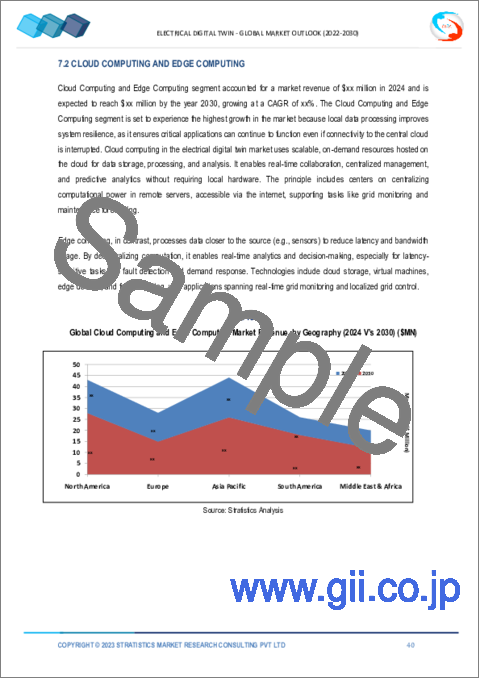
- Cloud Computing and Edge Computing
- Artificial Intelligence
- Augmented Reality (AR)
- Machine Learning
- Other Technologies
Applications Covered:
- Predictive Maintenance
- Performance Optimization
- Asset Management
- Process Optimization
- Other Applications
End Users Covered:
- Energy & Utilities
- Manufacturing
- Automotive
- Aerospace & Defense
- Healthcare
- Retail
- Other End Users
Regions Covered:
- North America
- US
- Canada
- Mexico
- Europe
- Germany
- UK
- Italy
- France
- Spain
- Rest of Europe
- Asia Pacific
- Japan
- China
- India
- Australia
- New Zealand
- South Korea
- Rest of Asia Pacific
- South America
- Argentina
- Brazil
- Chile
- Rest of South America
- Middle East & Africa
- Saudi Arabia
- UAE
- Qatar
- South Africa
- Rest of Middle East & Africa
What our report offers:
- Market share assessments for the regional and country-level segments
- Strategic recommendations for the new entrants
- Covers Market data for the years 2022, 2023, 2024, 2026, and 2030
- Market Trends (Drivers, Constraints, Opportunities, Threats, Challenges, Investment Opportunities, and recommendations)
- Strategic recommendations in key business segments based on the market estimations
- Competitive landscaping mapping the key common trends
- Company profiling with detailed strategies, financials, and recent developments
- Supply chain trends mapping the latest technological advancements
Free Customization Offerings:
All the customers of this report will be entitled to receive one of the following free customization options:
- Company Profiling
- Comprehensive profiling of additional market players (up to 3)
- SWOT Analysis of key players (up to 3)
- Regional Segmentation
- Market estimations, Forecasts and CAGR of any prominent country as per the client's interest (Note: Depends on feasibility check)
- Competitive Benchmarking
- Benchmarking of key players based on product portfolio, geographical presence, and strategic alliances
Table of Contents
1 Executive Summary
2 Preface
- 2.1 Abstract
- 2.2 Stake Holders
- 2.3 Research Scope
- 2.4 Research Methodology
- 2.4.1 Data Mining
- 2.4.2 Data Analysis
- 2.4.3 Data Validation
- 2.4.4 Research Approach
- 2.5 Research Sources
- 2.5.1 Primary Research Sources
- 2.5.2 Secondary Research Sources
- 2.5.3 Assumptions
3 Market Trend Analysis
- 3.1 Introduction
- 3.2 Drivers
- 3.3 Restraints
- 3.4 Opportunities
- 3.5 Threats
- 3.6 Technology Analysis
- 3.7 Application Analysis
- 3.8 End User Analysis
- 3.9 Emerging Markets
- 3.10 Impact of Covid-19
4 Porters Five Force Analysis
- 4.1 Bargaining power of suppliers
- 4.2 Bargaining power of buyers
- 4.3 Threat of substitutes
- 4.4 Threat of new entrants
- 4.5 Competitive rivalry
5 Global Electrical Digital Twin Market, By Type
- 5.1 Introduction
- 5.2 Digital Grid
- 5.3 Digital Wind Farm
- 5.4 Digital Gas & Steam Power Plant
- 5.5 Distributed Energy Resources
- 5.6 Digital Hydropower Plant
- 5.7 Other Types
6 Global Electrical Digital Twin Market, By Component Type
- 6.1 Introduction
- 6.2 Sensors
- 6.3 Actuators
- 6.4 Control Systems
- 6.5 Communication Modules
- 6.6 Software Platforms
7 Global Electrical Digital Twin Market, By Technology
- 7.1 Introduction
- 7.2 Cloud Computing and Edge Computing
- 7.3 Artificial Intelligence
- 7.4 Augmented Reality (AR)
- 7.5 Machine Learning
- 7.6 Other Technologies
8 Global Electrical Digital Twin Market, By Application
- 8.1 Introduction
- 8.2 Predictive Maintenance
- 8.3 Performance Optimization
- 8.4 Asset Management
- 8.5 Process Optimization
- 8.6 Other Applications
9 Global Electrical Digital Twin Market, By End User
- 9.1 Introduction
- 9.2 Energy & Utilities
- 9.3 Manufacturing
- 9.4 Automotive
- 9.5 Aerospace & Defense
- 9.6 Healthcare
- 9.7 Retail
- 9.8 Other End Users
10 Global Electrical Digital Twin Market, By Geography
- 10.1 Introduction
- 10.2 North America
- 10.2.1 US
- 10.2.2 Canada
- 10.2.3 Mexico
- 10.3 Europe
- 10.3.1 Germany
- 10.3.2 UK
- 10.3.3 Italy
- 10.3.4 France
- 10.3.5 Spain
- 10.3.6 Rest of Europe
- 10.4 Asia Pacific
- 10.4.1 Japan
- 10.4.2 China
- 10.4.3 India
- 10.4.4 Australia
- 10.4.5 New Zealand
- 10.4.6 South Korea
- 10.4.7 Rest of Asia Pacific
- 10.5 South America
- 10.5.1 Argentina
- 10.5.2 Brazil
- 10.5.3 Chile
- 10.5.4 Rest of South America
- 10.6 Middle East & Africa
- 10.6.1 Saudi Arabia
- 10.6.2 UAE
- 10.6.3 Qatar
- 10.6.4 South Africa
- 10.6.5 Rest of Middle East & Africa
11 Key Developments
- 11.1 Agreements, Partnerships, Collaborations and Joint Ventures
- 11.2 Acquisitions & Mergers
- 11.3 New Product Launch
- 11.4 Expansions
- 11.5 Other Key Strategies
12 Company Profiling
- 12.1 Siemens AG
- 12.2 ABB Group
- 12.3 Schneider Electric SE
- 12.4 General Electric Company
- 12.5 IBM Corporation
- 12.6 Dassault Systemes
- 12.7 Bentley Systems, Incorporated
- 12.8 Honeywell International Inc.
- 12.9 Hitachi, Ltd.
- 12.10 Rockwell Automation, Inc.
- 12.11 SAP SE
- 12.12 Hexagon AB
- 12.13 ESI Group
- 12.14 Synopsys, Inc.
- 12.15 Smart Wires Inc.
- 12.16 Lanner Group
- 12.17 Cyient Ltd.

