|
|
市場調査レポート
商品コード
1209860
分散型電源の世界市場:2028年までの予測 - 技術別、アプリケーション・エンドユーザー別、地域別の分析Distributed Generation Market Forecasts to 2028 - Global Analysis By Technology, Application End User and By Geography |
||||||
|
|
|||||||
|
● お客様のご希望に応じて、既存データの加工や未掲載情報(例:国別セグメント)の追加などの対応が可能です。 詳細はお問い合わせください。 |
|||||||


| 分散型電源の世界市場:2028年までの予測 - 技術別、アプリケーション・エンドユーザー別、地域別の分析 |
|
出版日: 2023年01月01日
発行: Stratistics Market Research Consulting
ページ情報: 英文 175+ Pages
納期: 2~3営業日
|
- 全表示
- 概要
- 図表
- 目次
Stratistics MRCによると、分散型発電の世界市場は2022年に290億米ドル、2028年には6390億米ドルに達し、予測期間中にCAGR13.5%で成長すると予測されています。
分散型発電は、分散型発電またはオンサイト発電とも呼ばれ、その言葉通り、自家用に電気を作ることを指します。分散型発電は、主にソーラーパネルや風力タービンなど、無公害で環境に優しい方法で発電されます。また、石炭火力発電所や原子力発電所など、大規模な集中型発電設備からの送電網を介したエネルギー伝送は無視されます。商業用、工業用、住宅用など、世界中で電力消費量が急激に増加しているため、分散型発電を推進し、集中型発電の負荷を最小限に抑え、管理することが必要になってきています。
中国太陽光発電産業協会によると、分散型太陽光発電の新規設置容量は前年比125%増の約1,965万kWで、中国の新規設置容量全体の約3分の2を占めています。
市場力学
促進要因
クリーンエネルギー発電の需要拡大
クリーンなエネルギー資源に対する人々の意識が高まるにつれ、市場は拡大しています。環境面への配慮や、従来のエネルギー源と比較して低コストであることから、分散型発電の需要が高まっていることが、この産業を牽引しています。分散型発電は、送電ロスを減らしながら、信頼性の高いクリーンなエネルギーをユーザーに提供することに貢献できます。現在、世界の配電システムは集中型が主流となっています。しかし、主に新興経済諸国によって大きな成長が期待されています。
抑制要因
定期的なメンテナンスとトラブルシューティング
適切な定期メンテナンスが行われないと、分散型発電が正常に機能しない可能性があります。分散型発電の影響としては、短絡レベルの増加、負荷損失の変化、ネットワーク上の電圧プロファイルの変化、電圧過渡の発生、系統分岐での混雑、電力品質と信頼性の低下、ネットワークの保護機能が正常に機能しなくなることが挙げられます。さらに、電圧調整、持続的な停電、高調波、電圧降下が市場の成長を抑制する要因となっています。
機会
再生可能なエネルギー源
世界中の政府は、再生可能エネルギーの導入を促進するために魅力的なインセンティブを考案しており、その結果、成長が加速しています。分散型発電は、さまざまなエネルギー源で構成されていますが、そのほとんどが再生可能エネルギーです。太陽光、風力、燃料電池、水力、バイオガス、バイオマス、地熱などは、すべて再生可能エネルギー源の一例です。分散型発電の世界市場は、主にクリーンエネルギー発電と再生可能エネルギー源に対する需要の高まりにより、予測期間中に高い成長率を示すと予想されています。また、世界各国の政府は、再生可能エネルギーの利用を奨励する魅力的なインセンティブを打ち出しており、これがさらなる成長の原動力となっています。
脅威
高コスト
分散型発電の導入は大きなメリットをもたらしますが、システムのメンテナンスにコストがかかります。中小企業には資金的な制約があり、高価な分散型発電システムを導入することができないです。中小企業の資金力の低さは、予測期間中の市場成長を阻害する可能性があります。
COVID-19の影響
需給ギャップ、原材料調達の混乱、価格変動が、COVID-19の流行期間中、業界の成長を妨げると予想されます。世界各地での資源の不足により、COVID-19の流行は製造業や産業界に悪影響を及ぼしています。国内の様々なセクションで実施される貿易制限のため。業界のトップ企業は市場の先行きを懸念し、この課題に対応するために戦略を練り直しています。
予測期間中、燃料電池セグメントが最大となる見込み
燃料電池は、高効率、低排出ガス、化学エネルギーを電気エネルギーに変換する能力など、さまざまな利点があるため、分散型発電システムでの採用が進んでおり、この分野は有利に成長すると予測されます。さらに、燃料電池には発電以外の利点もあり、エネルギー貯蔵や電力調整にも利用することができます。したがって、これらの点がこの分野の成長を後押ししています。
予測期間中、商業・産業用分野のCAGRが最も高くなると予想されます。
商業・産業用分野は、設備コストの削減と無停電電源装置の需要増により、予測期間中に最も速いCAGRの成長が見込まれています。これは、補助金やインセンティブといった形で、商業・工業分野での再生可能エネルギー源の採用を促進する政府の取り組みが活発化していることに起因しています。さらに、地方における工業化・都市化への政府の取り組みが活発化していることも、この分野の成長を後押ししています。
最もシェアの高い地域
アジア太平洋地域は、再生可能エネルギーの採用が進んでいること、工業化・都市化への投資が増加していること、インフラ整備が急速に進んでいること、再生可能エネルギーやグリーン・クリーンエネルギーの導入を奨励する政府の取り組みが活発化していることから、予測期間中最大の市場シェアを占めると予想されます。また、工業化の進展に伴い、効率的で中断のない電力供給に対する需要が大幅に増加しており、これが同地域の市場成長を後押ししています。
CAGRが最も高い地域
欧州は、エネルギー効率が高いことから、予測期間中のCAGRが最も高いと予測されています。これは、再生可能エネルギーの使用に関する政府の厳しい規範に起因するものです。気候変動や二酸化炭素排出の悪影響に関する意識の高まりにより、クリーンでグリーンなエネルギーへの需要が高まっています。政府は、再生可能エネルギー源に関連する産業用および商業用のエネルギー使用に関して厳しい規制を設けており、これが同地域の市場成長を促進しています。
主な発展
2020年12月、三菱重工業株式会社とデンマークのVestas Wind Systems A/Sは、50/50のMHI Vestas Offshore Wind A/Sの合弁事業を正式に終了する契約を締結しました。
2019年7月、FuelCell Energyは、ドイツ、スペイン、英国、イタリアなどの欧州諸国でサブMW分散型発電システムを再立ち上げする計画に関して報告しました。
2019年6月、Amerescoは、9100万米ドルのコストを伴う10MW分散型エネルギーセキュリティと名付けられたプロジェクトを完了しました。このシステムは、地震や暴風雨に耐える能力を備えています。
当社のレポートが提供するもの
- 地域レベルおよび国レベルセグメントの市場シェア評価
- 新規参入企業への戦略的提言
- 2020年、2021年、2022年、2025年、2028年の市場データを網羅
- 市場動向(市場促進要因・促進要因・機会・脅威・課題・投資機会・提言)を網羅
- 市場推定に基づく、主要ビジネスセグメントにおける戦略的推奨事項
- 主要な共通トレンドをマッピングした競合情勢
- 詳細な戦略、財務、最近の開発状況を含む企業プロファイル
- 最新の技術的進歩をマッピングしたサプライチェーン動向
無料カスタマイズサービス
本レポートをご購読のお客様には、以下のカスタマイズオプションのいずれかを無償でご提供いたします。
- 企業プロファイル
- 追加市場プレイヤーの包括的なプロファイリング(最大3社まで)
- 主要プレイヤーのSWOT分析(3社まで)
- 地域別セグメンテーション
- お客様のご希望に応じた主要国の市場推計・予測・CAGR(注:フィージビリティチェックによります。)
- 競合ベンチマーキング
- 製品ポートフォリオ、地理的プレゼンス、戦略的提携に基づく主要プレイヤーのベンチマーキング
目次
第1章 エグゼクティブサマリー
第2章 序文
- 概要
- ステークホルダー
- 調査範囲
- 調査手法
- データマイニング
- データ分析
- データ検証
- 調査アプローチ
- 調査情報源
- 1次調査情報源
- 2次調査情報源
- 仮定
第3章 市場動向分析
- 促進要因
- 抑制要因
- 機会
- 脅威
- 技術分析
- アプリケーション分析
- エンドユーザー分析
- 新興市場
- COVID-19の影響
第4章 ポーターズファイブフォース分析
- 供給企業の交渉力
- 買い手の交渉力
- 代替品の脅威
- 新規参入業者の脅威
- 競争企業間の敵対関係
第5章 世界の分散型電源市場:技術別
- 小水力
- 燃料電池
- 太陽光発電
- マイクロタービン
- レシプロエンジン
- 風力タービン
- 燃焼タービン
- その他の技術
第6章 世界の分散型電源市場:アプリケーション別
- オフグリッド
- オングリッド
- その他のアプリケーション
第7章 世界の分散型電源市場:エンドユーザー別
- 工業用
- 商業
- 住宅
- その他のエンドユーザー
第8章 世界の分散型電源市場:地域
- 北米
- 米国
- カナダ
- メキシコ
- 欧州
- ドイツ
- 英国
- イタリア
- フランス
- スペイン
- その他欧州
- アジア太平洋地域
- 日本
- 中国
- インド
- オーストラリア
- ニュージーランド
- 韓国
- その他アジア太平洋地域
- 南米
- アルゼンチン
- ブラジル
- チリ
- その他南米
- 中東とアフリカ
- サウジアラビア
- アラブ首長国連邦
- カタール
- 南アフリカ
- その他中東
第9章 主な発展
- 契約、パートナーシップ、コラボレーション、合弁事業
- 買収と合併
- 新製品の発売
- 事業拡大
- その他の主要戦略
第10章 企業プロファイル
- Huawei Technologies Co., Ltd.
- ABB Limited
- Mitsubishi Heavy Industries Ltd.
- Siemens AG
- Schneider Electric
- FuelCell Energy, Inc.
- Canadian Solar Inc.
- Rolls-Royce Power Systems AG
- Toyota Turbine and Systems Inc.
- Caterpillar, Inc.
- Capstone Green Energy Corporation
- Bergey WindPower Company
- SMA Solar Technology AG
- Bloom Energy Corporation
- Vestas Wind Systems A/S
- Emergya Wind Technologies B.V.
- GE Power
- Ansaldo Energia S.p.A.
- Flex Energy Solutions
- Ameresco, Inc.
List of Tables
- Table 1 Global Distributed Generation Market Outlook, By Region (2020-2028) ($MN)
- Table 2 Global Distributed Generation Market Outlook, By Technology (2020-2028) ($MN)
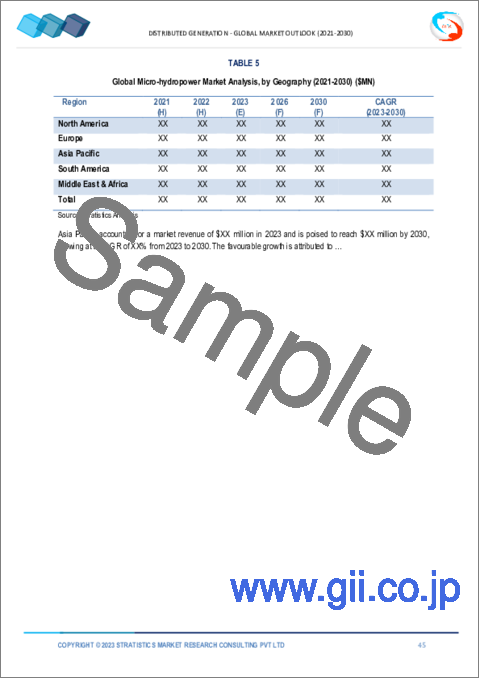
- Table 3 Global Distributed Generation Market Outlook, By Micro-hydropower (2020-2028) ($MN)
- Table 4 Global Distributed Generation Market Outlook, By Fuel Cells (2020-2028) ($MN)
- Table 5 Global Distributed Generation Market Outlook, By Solar PV (2020-2028) ($MN)
- Table 6 Global Distributed Generation Market Outlook, By Micro-Turbines (2020-2028) ($MN)
- Table 7 Global Distributed Generation Market Outlook, By Reciprocating Engines (2020-2028) ($MN)
- Table 8 Global Distributed Generation Market Outlook, By Wind Turbines (2020-2028) ($MN)
- Table 9 Global Distributed Generation Market Outlook, By Combustion Turbines (2020-2028) ($MN)
- Table 10 Global Distributed Generation Market Outlook, By Other Technologies (2020-2028) ($MN)
- Table 11 Global Distributed Generation Market Outlook, By Application (2020-2028) ($MN)
- Table 12 Global Distributed Generation Market Outlook, By Off-Grid (2020-2028) ($MN)
- Table 13 Global Distributed Generation Market Outlook, By On-Grid (2020-2028) ($MN)
- Table 14 Global Distributed Generation Market Outlook, By Other Applications (2020-2028) ($MN)
- Table 15 Global Distributed Generation Market Outlook, By End User (2020-2028) ($MN)
- Table 16 Global Distributed Generation Market Outlook, By Industrial (2020-2028) ($MN)
- Table 17 Global Distributed Generation Market Outlook, By Commercial (2020-2028) ($MN)
- Table 18 Global Distributed Generation Market Outlook, By Residential (2020-2028) ($MN)
- Table 19 Global Distributed Generation Market Outlook, By Other End Users (2020-2028) ($MN)
- Table 20 North America Distributed Generation Market Outlook, By Country (2020-2028) ($MN)
- Table 21 North America Distributed Generation Market Outlook, By Technology (2020-2028) ($MN)
- Table 22 North America Distributed Generation Market Outlook, By Micro-hydropower (2020-2028) ($MN)
- Table 23 North America Distributed Generation Market Outlook, By Fuel Cells (2020-2028) ($MN)
- Table 24 North America Distributed Generation Market Outlook, By Solar PV (2020-2028) ($MN)
- Table 25 North America Distributed Generation Market Outlook, By Micro-Turbines (2020-2028) ($MN)
- Table 26 North America Distributed Generation Market Outlook, By Reciprocating Engines (2020-2028) ($MN)
- Table 27 North America Distributed Generation Market Outlook, By Wind Turbines (2020-2028) ($MN)
- Table 28 North America Distributed Generation Market Outlook, By Combustion Turbines (2020-2028) ($MN)
- Table 29 North America Distributed Generation Market Outlook, By Other Technologies (2020-2028) ($MN)
- Table 30 North America Distributed Generation Market Outlook, By Application (2020-2028) ($MN)
- Table 31 North America Distributed Generation Market Outlook, By Off-Grid (2020-2028) ($MN)
- Table 32 North America Distributed Generation Market Outlook, By On-Grid (2020-2028) ($MN)
- Table 33 North America Distributed Generation Market Outlook, By Other Applications (2020-2028) ($MN)
- Table 34 North America Distributed Generation Market Outlook, By End User (2020-2028) ($MN)
- Table 35 North America Distributed Generation Market Outlook, By Industrial (2020-2028) ($MN)
- Table 36 North America Distributed Generation Market Outlook, By Commercial (2020-2028) ($MN)
- Table 37 North America Distributed Generation Market Outlook, By Residential (2020-2028) ($MN)
- Table 38 North America Distributed Generation Market Outlook, By Other End Users (2020-2028) ($MN)
- Table 39 Europe Distributed Generation Market Outlook, By Country (2020-2028) ($MN)
- Table 40 Europe Distributed Generation Market Outlook, By Technology (2020-2028) ($MN)
- Table 41 Europe Distributed Generation Market Outlook, By Micro-hydropower (2020-2028) ($MN)
- Table 42 Europe Distributed Generation Market Outlook, By Fuel Cells (2020-2028) ($MN)
- Table 43 Europe Distributed Generation Market Outlook, By Solar PV (2020-2028) ($MN)
- Table 44 Europe Distributed Generation Market Outlook, By Micro-Turbines (2020-2028) ($MN)
- Table 45 Europe Distributed Generation Market Outlook, By Reciprocating Engines (2020-2028) ($MN)
- Table 46 Europe Distributed Generation Market Outlook, By Wind Turbines (2020-2028) ($MN)
- Table 47 Europe Distributed Generation Market Outlook, By Combustion Turbines (2020-2028) ($MN)
- Table 48 Europe Distributed Generation Market Outlook, By Other Technologies (2020-2028) ($MN)
- Table 49 Europe Distributed Generation Market Outlook, By Application (2020-2028) ($MN)
- Table 50 Europe Distributed Generation Market Outlook, By Off-Grid (2020-2028) ($MN)
- Table 51 Europe Distributed Generation Market Outlook, By On-Grid (2020-2028) ($MN)
- Table 52 Europe Distributed Generation Market Outlook, By Other Applications (2020-2028) ($MN)
- Table 53 Europe Distributed Generation Market Outlook, By End User (2020-2028) ($MN)
- Table 54 Europe Distributed Generation Market Outlook, By Industrial (2020-2028) ($MN)
- Table 55 Europe Distributed Generation Market Outlook, By Commercial (2020-2028) ($MN)
- Table 56 Europe Distributed Generation Market Outlook, By Residential (2020-2028) ($MN)
- Table 57 Europe Distributed Generation Market Outlook, By Other End Users (2020-2028) ($MN)
- Table 58 Asia Pacific Distributed Generation Market Outlook, By Country (2020-2028) ($MN)
- Table 59 Asia Pacific Distributed Generation Market Outlook, By Technology (2020-2028) ($MN)
- Table 60 Asia Pacific Distributed Generation Market Outlook, By Micro-hydropower (2020-2028) ($MN)
- Table 61 Asia Pacific Distributed Generation Market Outlook, By Fuel Cells (2020-2028) ($MN)
- Table 62 Asia Pacific Distributed Generation Market Outlook, By Solar PV (2020-2028) ($MN)
- Table 63 Asia Pacific Distributed Generation Market Outlook, By Micro-Turbines (2020-2028) ($MN)
- Table 64 Asia Pacific Distributed Generation Market Outlook, By Reciprocating Engines (2020-2028) ($MN)
- Table 65 Asia Pacific Distributed Generation Market Outlook, By Wind Turbines (2020-2028) ($MN)
- Table 66 Asia Pacific Distributed Generation Market Outlook, By Combustion Turbines (2020-2028) ($MN)
- Table 67 Asia Pacific Distributed Generation Market Outlook, By Other Technologies (2020-2028) ($MN)
- Table 68 Asia Pacific Distributed Generation Market Outlook, By Application (2020-2028) ($MN)
- Table 69 Asia Pacific Distributed Generation Market Outlook, By Off-Grid (2020-2028) ($MN)
- Table 70 Asia Pacific Distributed Generation Market Outlook, By On-Grid (2020-2028) ($MN)
- Table 71 Asia Pacific Distributed Generation Market Outlook, By Other Applications (2020-2028) ($MN)
- Table 72 Asia Pacific Distributed Generation Market Outlook, By End User (2020-2028) ($MN)
- Table 73 Asia Pacific Distributed Generation Market Outlook, By Industrial (2020-2028) ($MN)
- Table 74 Asia Pacific Distributed Generation Market Outlook, By Commercial (2020-2028) ($MN)
- Table 75 Asia Pacific Distributed Generation Market Outlook, By Residential (2020-2028) ($MN)
- Table 76 Asia Pacific Distributed Generation Market Outlook, By Other End Users (2020-2028) ($MN)
- Table 77 South America Distributed Generation Market Outlook, By Country (2020-2028) ($MN)
- Table 78 South America Distributed Generation Market Outlook, By Technology (2020-2028) ($MN)
- Table 79 South America Distributed Generation Market Outlook, By Micro-hydropower (2020-2028) ($MN)
- Table 80 South America Distributed Generation Market Outlook, By Fuel Cells (2020-2028) ($MN)
- Table 81 South America Distributed Generation Market Outlook, By Solar PV (2020-2028) ($MN)
- Table 82 South America Distributed Generation Market Outlook, By Micro-Turbines (2020-2028) ($MN)
- Table 83 South America Distributed Generation Market Outlook, By Reciprocating Engines (2020-2028) ($MN)
- Table 84 South America Distributed Generation Market Outlook, By Wind Turbines (2020-2028) ($MN)
- Table 85 South America Distributed Generation Market Outlook, By Combustion Turbines (2020-2028) ($MN)
- Table 86 South America Distributed Generation Market Outlook, By Other Technologies (2020-2028) ($MN)
- Table 87 South America Distributed Generation Market Outlook, By Application (2020-2028) ($MN)
- Table 88 South America Distributed Generation Market Outlook, By Off-Grid (2020-2028) ($MN)
- Table 89 South America Distributed Generation Market Outlook, By On-Grid (2020-2028) ($MN)
- Table 90 South America Distributed Generation Market Outlook, By Other Applications (2020-2028) ($MN)
- Table 91 South America Distributed Generation Market Outlook, By End User (2020-2028) ($MN)
- Table 92 South America Distributed Generation Market Outlook, By Industrial (2020-2028) ($MN)
- Table 93 South America Distributed Generation Market Outlook, By Commercial (2020-2028) ($MN)
- Table 94 South America Distributed Generation Market Outlook, By Residential (2020-2028) ($MN)
- Table 95 South America Distributed Generation Market Outlook, By Other End Users (2020-2028) ($MN)
- Table 96 Middle East & Africa Distributed Generation Market Outlook, By Country (2020-2028) ($MN)
- Table 97 Middle East & Africa Distributed Generation Market Outlook, By Technology (2020-2028) ($MN)
- Table 98 Middle East & Africa Distributed Generation Market Outlook, By Micro-hydropower (2020-2028) ($MN)
- Table 99 Middle East & Africa Distributed Generation Market Outlook, By Fuel Cells (2020-2028) ($MN)
- Table 100 Middle East & Africa Distributed Generation Market Outlook, By Solar PV (2020-2028) ($MN)
- Table 101 Middle East & Africa Distributed Generation Market Outlook, By Micro-Turbines (2020-2028) ($MN)
- Table 102 Middle East & Africa Distributed Generation Market Outlook, By Reciprocating Engines (2020-2028) ($MN)
- Table 103 Middle East & Africa Distributed Generation Market Outlook, By Wind Turbines (2020-2028) ($MN)
- Table 104 Middle East & Africa Distributed Generation Market Outlook, By Combustion Turbines (2020-2028) ($MN)
- Table 105 Middle East & Africa Distributed Generation Market Outlook, By Other Technologies (2020-2028) ($MN)
- Table 106 Middle East & Africa Distributed Generation Market Outlook, By Application (2020-2028) ($MN)
- Table 107 Middle East & Africa Distributed Generation Market Outlook, By Off-Grid (2020-2028) ($MN)
- Table 108 Middle East & Africa Distributed Generation Market Outlook, By On-Grid (2020-2028) ($MN)
- Table 109 Middle East & Africa Distributed Generation Market Outlook, By Other Applications (2020-2028) ($MN)
- Table 110 Middle East & Africa Distributed Generation Market Outlook, By End User (2020-2028) ($MN)
- Table 111 Middle East & Africa Distributed Generation Market Outlook, By Industrial (2020-2028) ($MN)
- Table 112 Middle East & Africa Distributed Generation Market Outlook, By Commercial (2020-2028) ($MN)
- Table 113 Middle East & Africa Distributed Generation Market Outlook, By Residential (2020-2028) ($MN)
- Table 114 Middle East & Africa Distributed Generation Market Outlook, By Other End Users (2020-2028) ($MN)
According to Stratistics MRC, the Global Distributed Generation Market is accounted for $29 billion in 2022 and is expected to reach $639 billion by 2028 growing at a CAGR of 13.5% during the forecast period. Distributed generation which is also known as decentralized generation or on-site generation as the term describes refers to the generation of electricity for on-site usage on our own. It is mainly generated through the pollution free and environment friendly ways with the help of solar panels, wind turbines and many other similar methods. It majorly neglects the energy transmission required through the electric grid from a large, centralized power generation facilities such as a coal-fired or nuclear power plant. Since the power consumption across the globe has been drastically increased from commercial, industrial as well as residential applications it is necessary nowadays to encourage distributed generations to minimize and manage the centralized power loads.
According to the China Photovoltaic Industry Association, newly installed distributed solar power capacity climbed 125% year on year to nearly 19.65 million kilowatts, accounting to roughly two thirds of china's total newly added solar power capacity.
Market Dynamics:
Driver:
Growing demand for clean energy generation
The market is growing as people become more aware of clean energy resources. The industry is being driven by the rising demand for a distributed generation due to environmental benefits and the lower cost compared to traditional energy generation. Decentralized generating can assist in delivering reliable and clean energy to users while decreasing transmission losses. The centralized system currently dominates the global electricity distribution system. However, it is expected that there would be significant growth, owing primarily to developed economies.
Restraint:
Regular maintenance and troubleshooting
The lack of proper and regular maintenance may result in improper functioning of the distributed generation. The effects of distributed generation are short circuit levels are increased, load losses change, voltage profiles change along the network, voltage transients will appear, congestions can appear in system branches, power quality and reliability may be affected and the networks protections may not function properly. Furthermore, voltage regulation, sustained interruptions, harmonics, voltage sags are the factors restraining the growth of the market.
Opportunity:
Renewable sources of energy
Governments all around the world have devised enticing incentives to encourage the adoption of renewable energy sources, hence accelerating growth. Distributed generation is made up of a variety of energy sources, most of which are renewable. Solar, wind, fuel cells, hydro, biogas, biomass, and geothermal power are all examples of renewable energy sources. The global distributed generation market is projected to grow at a high rate during the forecast period, mainly due to the growing demand for clean energy generation and renewable sources of energy. Governments around the world have developed attractive incentives, rewarding the use of renewable sources of energy, which further drives the growth.
Threat:
High cost
The adoption of the distributed generation may offer huge advantages but there is a cost associated with the maintenance of the systems. The small and medium sector enterprises have financial limitations that restrict them to adopt the advanced and expensive distributed generation systems. The low financial capabilities of the SMEs may hamper the market growth during the forecast period.
COVID-19 Impact
The demand-supply gap, disruptions in raw material procurement, and price volatility are expected to hamper the growth of the industry during the COVID-19 pandemic. Due to a scarcity of resources in various parts of the world, the COVID-19 epidemic has impacted negatively on the manufacturing and industrial industries. Due to trade restrictions implemented in various sections of the country. The industry's top players are concerned about the market's prospects and are rethinking their strategies to meet the challenge.
The fuel cell segment is expected to be the largest during the forecast period
The fuel cell segment is estimated to have a lucrative growth, due to the improved adoption of the fuel cells in the distributed generation system owing to various benefits like high efficiency, lower emissions, and capability of converting chemical energy into electrical energy. Furthermore, as fuel cells have inherent benefits beyond than power generation, they can be used for energy storage and power flow regulation. Hence, these are the aspects driving the segment growth.
The commercial & industrial segment is expected to have the highest CAGR during the forecast period
The commercial & industrial segment is anticipated to witness the fastest CAGR growth during the forecast period, due to the reducing equipment costs and increased demand for the uninterrupted power supply. This is attributed to the increased government initiatives to promote the adoption of the renewable energy sources across the commercial and industrial sectors in the form of subsidies and incentives. Moreover, the increased efforts of the government to industrialize and urbanize the rural regions are supporting the growth of the segment.
Region with highest share:
Asia Pacific is projected to hold the largest market share during the forecast period owing to the increased adoption of renewable energy sources, rising investments in the industrialization and urbanization, rapidly growing infrastructural developments, and increasing government initiatives to encourage the deployment of renewable and green & clean energy sources. Moreover, with the growing industrialization, the demand for the efficient and uninterrupted power supply is growing significantly, which is fueling the growth of the market in region.
Region with highest CAGR:
Europe is projected to have the highest CAGR over the forecast period, owing to its higher energy efficiency. This is attributed to the strict government norms regarding the use of renewable energy. The increased awareness regarding the climate change and negative effects of carbon emission has resulted in the huge demand for the clean and green energy. The government has strict regulations regarding the industrial and commercial use of energy pertaining to the renewable sources, which has enhanced the growth of the market in region.
Key players in the market
Some of the key players profiled in the Distributed Generation Market include Huawei Technologies Co., Ltd., ABB Limited, Mitsubishi Heavy Industries Ltd., Siemens AG, Schneider Electric, FuelCell Energy, Inc., Canadian Solar Inc., Rolls-Royce Power Systems AG, Toyota Turbine and Systems Inc., Caterpillar, Inc., Capstone Green Energy Corporation, Bergey WindPower Company, SMA Solar Technology AG, Bloom Energy Corporation, Vestas Wind Systems A/S, Emergya Wind Technologies B.V., GE Power, Ansaldo Energia S.p.A., Flex Energy Solutions and Ameresco, Inc.
Key Developments:
In December 2020, Mitsubishi Heavy Industries Ltd and Vestas Wind Systems A/S of Denmark signed an agreement that formally ended their 50/50 MHI Vestas Offshore Wind A/S joint venture.
In July 2019, FuelCell Energy reported regarding its plan to re-launch sub-MW distributed generation system in European countries such as Germany, Spain, UK, and Italy.
In June 2019, Ameresco completed its project named 10MW Distributed Energy Security that involved a cost of US$91 million. This system has the capability to withstand seismic and storm conditions.
Technologies Covered:
- Micro-hydropower
- Fuel Cells
- Solar PV
- Micro-Turbines
- Reciprocating Engines
- Wind Turbines
- Combustion Turbines
- Other Technologies
Applications Covered:
- Off-Grid
- On-Grid
- Other Applications
End Users Covered:
- Industrial
- Commercial
- Residential
- Other End Users
Regions Covered:
- North America
- US
- Canada
- Mexico
- Europe
- Germany
- UK
- Italy
- France
- Spain
- Rest of Europe
- Asia Pacific
- Japan
- China
- India
- Australia
- New Zealand
- South Korea
- Rest of Asia Pacific
- South America
- Argentina
- Brazil
- Chile
- Rest of South America
- Middle East & Africa
- Saudi Arabia
- UAE
- Qatar
- South Africa
- Rest of Middle East & Africa
What our report offers:
- Market share assessments for the regional and country-level segments
- Strategic recommendations for the new entrants
- Covers Market data for the years 2020, 2021, 2022, 2025, and 2028
- Market Trends (Drivers, Constraints, Opportunities, Threats, Challenges, Investment Opportunities, and recommendations)
- Strategic recommendations in key business segments based on the market estimations
- Competitive landscaping mapping the key common trends
- Company profiling with detailed strategies, financials, and recent developments
- Supply chain trends mapping the latest technological advancements
Free Customization Offerings:
All the customers of this report will be entitled to receive one of the following free customization options:
- Company Profiling
- Comprehensive profiling of additional market players (up to 3)
- SWOT Analysis of key players (up to 3)
- Regional Segmentation
- Market estimations, Forecasts and CAGR of any prominent country as per the client's interest (Note: Depends on feasibility check)
- Competitive Benchmarking
- Benchmarking of key players based on product portfolio, geographical presence, and strategic alliances
Table of Contents
1 Executive Summary
2 Preface
- 2.1 Abstract
- 2.2 Stake Holders
- 2.3 Research Scope
- 2.4 Research Methodology
- 2.4.1 Data Mining
- 2.4.2 Data Analysis
- 2.4.3 Data Validation
- 2.4.4 Research Approach
- 2.5 Research Sources
- 2.5.1 Primary Research Sources
- 2.5.2 Secondary Research Sources
- 2.5.3 Assumptions
3 Market Trend Analysis
- 3.1 Introduction
- 3.2 Drivers
- 3.3 Restraints
- 3.4 Opportunities
- 3.5 Threats
- 3.6 Technology Analysis
- 3.7 Application Analysis
- 3.8 End User Analysis
- 3.9 Emerging Markets
- 3.10 Impact of Covid-19
4 Porters Five Force Analysis
- 4.1 Bargaining power of suppliers
- 4.2 Bargaining power of buyers
- 4.3 Threat of substitutes
- 4.4 Threat of new entrants
- 4.5 Competitive rivalry
5 Global Distributed Generation Market, By Technology
- 5.1 Introduction
- 5.2 Micro-hydropower
- 5.3 Fuel Cells
- 5.4 Solar PV
- 5.5 Micro-Turbines
- 5.6 Reciprocating Engines
- 5.7 Wind Turbines
- 5.8 Combustion Turbines
- 5.9 Other Technologies
6 Global Distributed Generation Market, By Application
- 6.1 Introduction
- 6.2 Off-Grid
- 6.3 On-Grid
- 6.4 Other Applications
7 Global Distributed Generation Market, By End User
- 7.1 Introduction
- 7.2 Industrial
- 7.3 Commercial
- 7.4 Residential
- 7.5 Other End Users
8 Global Distributed Generation Market, By Geography
- 8.1 Introduction
- 8.2 North America
- 8.2.1 US
- 8.2.2 Canada
- 8.2.3 Mexico
- 8.3 Europe
- 8.3.1 Germany
- 8.3.2 UK
- 8.3.3 Italy
- 8.3.4 France
- 8.3.5 Spain
- 8.3.6 Rest of Europe
- 8.4 Asia Pacific
- 8.4.1 Japan
- 8.4.2 China
- 8.4.3 India
- 8.4.4 Australia
- 8.4.5 New Zealand
- 8.4.6 South Korea
- 8.4.7 Rest of Asia Pacific
- 8.5 South America
- 8.5.1 Argentina
- 8.5.2 Brazil
- 8.5.3 Chile
- 8.5.4 Rest of South America
- 8.6 Middle East & Africa
- 8.6.1 Saudi Arabia
- 8.6.2 UAE
- 8.6.3 Qatar
- 8.6.4 South Africa
- 8.6.5 Rest of Middle East & Africa
9 Key Developments
- 9.1 Agreements, Partnerships, Collaborations and Joint Ventures
- 9.2 Acquisitions & Mergers
- 9.3 New Product Launch
- 9.4 Expansions
- 9.5 Other Key Strategies
10 Company Profiling
- 10.1 Huawei Technologies Co., Ltd.
- 10.2 ABB Limited
- 10.3 Mitsubishi Heavy Industries Ltd.
- 10.4 Siemens AG
- 10.5 Schneider Electric
- 10.6 FuelCell Energy, Inc.
- 10.7 Canadian Solar Inc.
- 10.8 Rolls-Royce Power Systems AG
- 10.9 Toyota Turbine and Systems Inc.
- 10.10 Caterpillar, Inc.
- 10.11 Capstone Green Energy Corporation
- 10.12 Bergey WindPower Company
- 10.13 SMA Solar Technology AG
- 10.14 Bloom Energy Corporation
- 10.15 Vestas Wind Systems A/S
- 10.16 Emergya Wind Technologies B.V.
- 10.17 GE Power
- 10.18 Ansaldo Energia S.p.A.
- 10.19 Flex Energy Solutions
- 10.20 Ameresco, Inc.