
|
市場調査レポート
商品コード
1796407
スマート水管理の世界市場(~2035年):管理タイプ別、サービス別、水道メーター別、提供タイプ別、応用分野別、エンドユーザータイプ別、企業規模別、主要地域別、産業動向、予測Smart Water Management Market Till 2035: Distribution by Type of Management, Services, Water Meter, Type of Offering, Areas of Application, Type of End-user, Company Size, and Key Geographical Regions: Industry Trends and Global Forecasts |
||||||
カスタマイズ可能
|
|||||||
| スマート水管理の世界市場(~2035年):管理タイプ別、サービス別、水道メーター別、提供タイプ別、応用分野別、エンドユーザータイプ別、企業規模別、主要地域別、産業動向、予測 |
|
出版日: 2025年08月22日
発行: Roots Analysis
ページ情報: 英文 192 Pages
納期: 7~10営業日
|

全表示
- 概要
- 目次
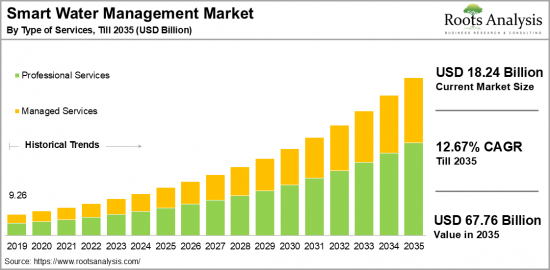
世界のスマート水管理の市場規模は、現在の182億4,000万米ドルから2035年までに677億6,000万米ドルに達すると予測され、2035年までの予測期間にCAGRで12.67%の成長が見込まれます。
スマート水管理市場:成長と動向
スマート水管理は、水資源のモニタリング、制御、保全を強化する最先端技術を組み込んだものです。センサー、メーター、データアナリティクスを利用することで、水管理のリアルタイム分析を容易にし、漏水を特定し、配水効率を高め、水質を保証します。IoT、AI、データアナリティクスの発展は、スマート水管理システムの能力を大幅に向上させ、水資源の保全と管理の方法を変革しています。
持続可能な水資源管理の見通しは、世界の水問題がより緊迫化する中で楽観的です。都市開発の増加、水管理慣行に対する気候変動の影響、持続可能性の重視が、効果的な水管理に向けたスマート技術の採用を促進しています。さらに、先進の計測やSCADAなどの水処理技術の進歩が続いていることに加え、スマート水管理に対する政府の支援が増加していることから、スマート水管理市場は予測期間に拡大する見込みです。
当レポートでは、世界のスマート水管理市場について調査分析し、市場規模の推計と機会の分析、競合情勢、企業プロファイル、メガトレンドなどの情報を提供しています。
目次
セクション1 レポートの概要
第1章 序文
第2章 調査手法
第3章 市場力学
第4章 マクロ経済指標
セクション2 定性的な知見
第5章 エグゼクティブサマリー
第6章 イントロダクション
第7章 規制シナリオ
セクション3 市場の概要
第8章 主要企業の包括的なデータベース
第9章 競合情勢
第10章 ホワイトスペースの分析
第11章 企業の競争力の分析
第12章 スマート水管理市場におけるスタートアップエコシステム
セクション4 企業プロファイル
第13章 企業プロファイル
- 章の概要
- ABB
- Arad Group
- Badger Meter
- Diehl Stiftung
- Evoqua Water Technologies
- GE Digital
- Honeywell
- Hydraulx
- i20 Water
- IBM
- Itron
- Kamstrup
- Ketos
- Landis+Gyr
- Neptune Technology Group
- Oracle
- Radius Synergies International
- Schneider Electric
セクション5 市場動向
第14章 メガトレンドの分析
第15章 アンメットニーズの分析
第16章 特許の分析
第17章 近年の発展
セクション6 市場機会の分析
第18章 世界のスマート水管理市場
第19章 市場機会:管理タイプ別
第20章 市場機会:サービスタイプ別
第21章 市場機会:水道メータータイプ別
第22章 市場機会:提供タイプ別
第23章 市場機会:応用分野別
第24章 市場機会:エンドユーザータイプ別
第25章 北米のスマート水管理市場の機会
第26章 欧州のスマート水管理市場の機会
第27章 アジアのスマート水管理市場の機会
第28章 中東・北アフリカ(MENA)のスマート水管理市場の機会
第29章 ラテンアメリカのスマート水管理市場の機会
第30章 その他の地域のスマート水管理市場の機会
第31章 市場集中の分析:主要企業別
第32章 隣接市場の分析
セクション7 戦略ツール
第33章 勝利の鍵となる戦略
第34章 ポーターのファイブフォース分析
第35章 SWOTの分析
第36章 バリューチェーンの分析
第37章 Rootsの戦略的提言
セクション8 その他の独占的知見
第38章 1次調査からの知見
第39章 レポートの結論
セクション9 付録
Smart Water Management Market Overview
As per Roots Analysis, the global smart water management market size is estimated to grow from USD 18.24 billion in the current year to USD 67.76 billion by 2035, at a CAGR of 12.67% during the forecast period, till 2035.
The opportunity for smart water management market has been distributed across the following segments:
Type of Management
- Advanced Analytics
- Advanced Pressure Management
- Distribution Network Monitoring
- Enterprise Asset Management for Water and Water waste Utilities
- Meter Data Management (MDM) for Water
- Network Monitoring
- Residential Water Efficiency
- SCADA Systems for Water and Wastewater Utilities
- Smart Irrigation Management Systems
- Solution Asset Management
Type of Services
- Managed Services
- Professional Services
Type of Water Meter
- AMI
- AMR
Type of Offering
- Service Outlook
- Solution Outlook
Areas of Application
- Analytics and Data Management
- Leak Detection
- Pressure Control
- Water Management
- Water Quality & Quantity Monitoring
- Water Treatment and Automation
Types of End-Users
- Commercial
- Industrial
- Residential
Company Size
- Large Enterprises
- Small and Medium Enterprises
Geographical Regions
- North America
- US
- Canada
- Mexico
- Other North American countries
- Europe
- Austria
- Belgium
- Denmark
- France
- Germany
- Ireland
- Italy
- Netherlands
- Norway
- Russia
- Spain
- Sweden
- Switzerland
- UK
- Other European countries
- Asia
- China
- India
- Japan
- Singapore
- South Korea
- Other Asian countries
- Latin America
- Brazil
- Chile
- Colombia
- Venezuela
- Other Latin American countries
- Middle East and North Africa
- Egypt
- Iran
- Iraq
- Israel
- Kuwait
- Saudi Arabia
- UAE
- Other MENA countries
- Rest of the World
- Australia
- New Zealand
- Other countries
SMART WATER MANAGEMENT MARKET: GROWTH AND TRENDS
Smart water management incorporates cutting-edge technologies to enhance the monitoring, control, and conservation of water resources. By using sensors, meters, and data analytics, it facilitates real-time analysis for water management, identifies leaks, boosts distribution efficiency, and ensures the quality of water. Developments in the Internet of Things, artificial intelligence, and data analytics are greatly improving the capabilities of smart water management systems, transforming how water resources are preserved and governed.
The outlook for sustainable water resource management is optimistic as global water issues become more pressing. Increasing urban development, the effects of climate change on water management practices, and a rising focus on sustainability are propelling the uptake of smart technologies for effective water management. Additionally, owing to ongoing advancements in water treatment technologies, such as advanced metering and Supervisory Control and Data Acquisition (SCADA), along with growing governmental support for smart water management, the smart water management market is expected to increase during the forecast period.
SMART WATER MANAGEMENT MARKET: KEY SEGMENTS
Market Share by Type of Management
Based on type of management, the global smart water management market is segmented into advanced analytics, advanced pressure management, distribution network monitoring, enterprise asset management for water and wastewater utilities, meter data management (MDM) for water, network monitoring, residential water efficiency, SCADA systems for water and wastewater utilities, smart irrigation management systems, and solution asset management.
According to our estimates, currently, the meter data management (MDM) for water segment captures the majority share of the market. This can be attributed to the rising demand for efficient metering solutions that improve billing accuracy and leak detection capabilities. However, the advanced analytics segment is expected to grow at a relatively higher CAGR during the forecast period. This expansion is linked to the growing need for data-informed decision-making and enhanced operational efficiency within water management.
Market Share by Type of Service
Based on type of service, the smart water management market is segmented into managed services and professional services. According to our estimates, currently, the professional services segment captures the majority of the market. This can be attributed to the importance of professional services such as system integration, consulting, and support for the successful implementation and enhancement of smart water management solutions.
However, the managed services sector is expected to grow at a relatively higher CAGR during the forecast period. This growth is driven by a rising demand for outsourcing water management functions. Utilities are increasingly pursuing this trend to lower operational expenses and enhance service quality through specialized providers.
Market Share by Type of Water Meter
Based on type of water meter, the smart water management market is segmented into AMI and AMR. According to our estimates, currently, AMI segment captures the majority of the market. This can be attributed to the application of these sensors across a wide variety of uses, owing to their capability to deliver real-time data on water usage via two-way communication systems
However, AMR segment is expected to grow at a relatively higher CAGR during the forecast period. This increase is due to a rising demand for effective water management solutions along with the need for real-time monitoring capabilities.
Market Share by Type of Offering
Based on type of offering, the smart water management market is segmented into service outlook, and solution outlook. According to our estimates, currently, the services outlook segment captures the majority of the market. This can be attributed to the increased awareness of water quality, consumer expectations, and advancements in smart water infrastructure technology. Additionally, the growing demand for professional services, such as system integration, consulting, and ongoing support, is further enhancing market growth for smart water management solutions.
Market Share by Areas of Application
Based on areas of application, the smart water management market is segmented into analytics and data management, leak detection, pressure control, water management, water quality & quantity monitoring, water treatment and automation. According to our estimates, currently, the analytics and data management segment captures the majority of the market. This can be attributed to the fact that it equips organizations to gather, analyze, and interpret extensive data, helping them to discern trends and make informed decisions. The increasing dependency on data-driven approaches in water management boosts operational efficiency and resource optimization.
However, the leak detection segment is expected to grow at a relatively higher CAGR during the forecast period. This growth is fueled by the increasing focus on minimizing non-revenue water losses and enhancing operational efficiency within water utilities. The emphasis on leak detection technologies in utilities is vital for promoting water conservation efforts and optimizing resource management.
Market Share by Type of End-User
Based on type of end-user, the smart water management market is segmented into commercial, industrial and residential. According to our estimates, currently, commercial segment captures the majority of the market. This can be attributed to the growing implementation of smart water management solutions by commercial entities, such as offices, hotels, and retail establishments, which aim to optimize water usage, lower operational expenses, and meet sustainability objectives.
However, the industrial segment is expected to grow at a relatively higher CAGR during the forecast period. This growth is fueled by the need for water conservation, process enhancement, and adherence to environmental regulations in water-centric sectors like manufacturing and chemical production.
Market Share by Company Size
Based on company size, the smart water management market is segmented into large and small and medium enterprise. According to our estimates, currently, large enterprise segment captures the majority of the market. However, small and medium enterprise segment is expected to grow at a relatively higher CAGR during the forecast period, owing to their flexibility, innovative approaches, focus on specialized markets, and capacity to adjust to evolving customer needs and market dynamics.
Market Share by Geographical Regions
Based on geographical regions, the smart water management market is segmented into North America, Europe, Asia, Latin America, Middle East and North Africa, and the rest of the world. According to our estimates, currently, North America captures the majority share of the market. This increase can be attributed to the growing government support for the implementation of smart water management solutions through various initiatives and regulations in North America.
Example Players in Smart Water Management Market
- ABB
- Arad Group
- Badger Meter
- Diehl Stiftung
- Evoqua Water Technologies
- GE Digital
- Honeywell
- Hydraulx
- i2O Water
- IBM
- Itron
- Kamstrup
- Ketos
- Landis+Gyr
- Neptune Technology Group
- Oracle
- Radius Synergies International
- Schneider Electric
- SENSUS
- Siemens
- SUEZ
- TaKaDu
- Trimble Water
SMART WATER MANAGEMENT MARKET: RESEARCH COVERAGE
The report on the smart water management market features insights on various sections, including:
- Market Sizing and Opportunity Analysis: An in-depth analysis of the smart water management market, focusing on key market segments, including [A] type of management, [B] type of services, [C] type of water meter, [D] type of offering, [E] areas of application, [F] type of end-user, [G] company size, and [H] key geographical regions.
- Competitive Landscape: A comprehensive analysis of the companies engaged in the smart water management market, based on several relevant parameters, such as [A] year of establishment, [B] company size, [C] location of headquarters and [D] ownership structure.
- Company Profiles: Elaborate profiles of prominent players engaged in the smart water management market, providing details on [A] location of headquarters, [B] company size, [C] company mission, [D] company footprint, [E] management team, [F] contact details, [G] financial information, [H] operating business segments, [I] service / product portfolio, [J] moat analysis, [K] recent developments, and an informed future outlook.
- Megatrends: An evaluation of ongoing megatrends in the smart water management industry.
- Patent Analysis: An insightful analysis of patents filed / granted in the smart water management domain, based on relevant parameters, including [A] type of patent, [B] patent publication year, [C] patent age and [D] leading players.
- Porter's Five Forces Analysis: An analysis of five competitive forces prevailing in the smart water management market, including threats of new entrants, bargaining power of buyers, bargaining power of suppliers, threats of substitute products and rivalry among existing competitors.
- Recent Developments: An overview of the recent developments made in the smart water management market, along with analysis based on relevant parameters, including [A] year of initiative, [B] type of initiative, [C] geographical distribution and [D] most active players.
- SWOT Analysis: An insightful SWOT framework, highlighting the strengths, weaknesses, opportunities and threats in the domain. Additionally, it provides Harvey ball analysis, highlighting the relative impact of each SWOT parameter.
- Value Chain Analysis: A comprehensive analysis of the value chain, providing information on the different phases and stakeholders involved in the smart water management market.
KEY QUESTIONS ANSWERED IN THIS REPORT
- How many companies are currently engaged in smart water management market?
- Which are the leading companies in this market?
- What factors are likely to influence the evolution of this market?
- What is the current and future market size?
- What is the CAGR of this market?
- How is the current and future market opportunity likely to be distributed across key market segments?
REASONS TO BUY THIS REPORT
- The report provides a comprehensive market analysis, offering detailed revenue projections of the overall market and its specific sub-segments. This information is valuable to both established market leaders and emerging entrants.
- Stakeholders can leverage the report to gain a deeper understanding of the competitive dynamics within the market. By analyzing the competitive landscape, businesses can make informed decisions to optimize their market positioning and develop effective go-to-market strategies.
- The report offers stakeholders a comprehensive overview of the market, including key drivers, barriers, opportunities, and challenges. This information empowers stakeholders to stay abreast of market trends and make data-driven decisions to capitalize on growth prospects.
ADDITIONAL BENEFITS
- Complimentary Excel Data Packs for all Analytical Modules in the Report
- 15% Free Content Customization
- Detailed Report Walkthrough Session with Research Team
- Free Updated report if the report is 6-12 months old or older
TABLE OF CONTENTS
SECTION I: REPORT OVERVIEW
1. PREFACE
- 1.1. Introduction
- 1.2. Market Share Insights
- 1.3. Key Market Insights
- 1.4. Report Coverage
- 1.5. Key Questions Answered
- 1.6. Chapter Outlines
2. RESEARCH METHODOLOGY
- 2.1. Chapter Overview
- 2.2. Research Assumptions
- 2.3. Database Building
- 2.3.1. Data Collection
- 2.3.2. Data Validation
- 2.3.3. Data Analysis
- 2.4. Project Methodology
- 2.4.1. Secondary Research
- 2.4.1.1. Annual Reports
- 2.4.1.2. Academic Research Papers
- 2.4.1.3. Company Websites
- 2.4.1.4. Investor Presentations
- 2.4.1.5. Regulatory Filings
- 2.4.1.6. White Papers
- 2.4.1.7. Industry Publications
- 2.4.1.8. Conferences and Seminars
- 2.4.1.9. Government Portals
- 2.4.1.10. Media and Press Releases
- 2.4.1.11. Newsletters
- 2.4.1.12. Industry Databases
- 2.4.1.13. Roots Proprietary Databases
- 2.4.1.14. Paid Databases and Sources
- 2.4.1.15. Social Media Portals
- 2.4.1.16. Other Secondary Sources
- 2.4.2. Primary Research
- 2.4.2.1. Introduction
- 2.4.2.2. Types
- 2.4.2.2.1. Qualitative
- 2.4.2.2.2. Quantitative
- 2.4.2.3. Advantages
- 2.4.2.4. Techniques
- 2.4.2.4.1. Interviews
- 2.4.2.4.2. Surveys
- 2.4.2.4.3. Focus Groups
- 2.4.2.4.4. Observational Research
- 2.4.2.4.5. Social Media Interactions
- 2.4.2.5. Stakeholders
- 2.4.2.5.1. Company Executives (CXOs)
- 2.4.2.5.2. Board of Directors
- 2.4.2.5.3. Company Presidents and Vice Presidents
- 2.4.2.5.4. Key Opinion Leaders
- 2.4.2.5.5. Research and Development Heads
- 2.4.2.5.6. Technical Experts
- 2.4.2.5.7. Subject Matter Experts
- 2.4.2.5.8. Scientists
- 2.4.2.5.9. Doctors and Other Healthcare Providers
- 2.4.2.6. Ethics and Integrity
- 2.4.2.6.1. Research Ethics
- 2.4.2.6.2. Data Integrity
- 2.4.3. Analytical Tools and Databases
- 2.4.1. Secondary Research
3. MARKET DYNAMICS
- 3.1. Forecast Methodology
- 3.1.1. Top-Down Approach
- 3.1.2. Bottom-Up Approach
- 3.1.3. Hybrid Approach
- 3.2. Market Assessment Framework
- 3.2.1. Total Addressable Market (TAM)
- 3.2.2. Serviceable Addressable Market (SAM)
- 3.2.3. Serviceable Obtainable Market (SOM)
- 3.2.4. Currently Acquired Market (CAM)
- 3.3. Forecasting Tools and Techniques
- 3.3.1. Qualitative Forecasting
- 3.3.2. Correlation
- 3.3.3. Regression
- 3.3.4. Time Series Analysis
- 3.3.5. Extrapolation
- 3.3.6. Convergence
- 3.3.7. Forecast Error Analysis
- 3.3.8. Data Visualization
- 3.3.9. Scenario Planning
- 3.3.10. Sensitivity Analysis
- 3.4. Key Considerations
- 3.4.1. Demographics
- 3.4.2. Market Access
- 3.4.3. Reimbursement Scenarios
- 3.4.4. Industry Consolidation
- 3.5. Robust Quality Control
- 3.6. Key Market Segmentations
- 3.7. Limitations
4. MACRO-ECONOMIC INDICATORS
- 4.1. Chapter Overview
- 4.2. Market Dynamics
- 4.2.1. Time Period
- 4.2.1.1. Historical Trends
- 4.2.1.2. Current and Forecasted Estimates
- 4.2.2. Currency Coverage
- 4.2.2.1. Overview of Major Currencies Affecting the Market
- 4.2.2.2. Impact of Currency Fluctuations on the Industry
- 4.2.3. Foreign Exchange Impact
- 4.2.3.1. Evaluation of Foreign Exchange Rates and Their Impact on Market
- 4.2.3.2. Strategies for Mitigating Foreign Exchange Risk
- 4.2.4. Recession
- 4.2.4.1. Historical Analysis of Past Recessions and Lessons Learnt
- 4.2.4.2. Assessment of Current Economic Conditions and Potential Impact on the Market
- 4.2.5. Inflation
- 4.2.5.1. Measurement and Analysis of Inflationary Pressures in the Economy
- 4.2.5.2. Potential Impact of Inflation on the Market Evolution
- 4.2.6. Interest Rates
- 4.2.6.1. Overview of Interest Rates and Their Impact on the Market
- 4.2.6.2. Strategies for Managing Interest Rate Risk
- 4.2.7. Commodity Flow Analysis
- 4.2.7.1. Type of Commodity
- 4.2.7.2. Origins and Destinations
- 4.2.7.3. Values and Weights
- 4.2.7.4. Modes of Transportation
- 4.2.8. Global Trade Dynamics
- 4.2.8.1. Import Scenario
- 4.2.8.2. Export Scenario
- 4.2.9. War Impact Analysis
- 4.2.9.1. Russian-Ukraine War
- 4.2.9.2. Israel-Hamas War
- 4.2.10. COVID Impact / Related Factors
- 4.2.10.1. Global Economic Impact
- 4.2.10.2. Industry-specific Impact
- 4.2.10.3. Government Response and Stimulus Measures
- 4.2.10.4. Future Outlook and Adaptation Strategies
- 4.2.11. Other Indicators
- 4.2.11.1. Fiscal Policy
- 4.2.11.2. Consumer Spending
- 4.2.11.3. Gross Domestic Product (GDP)
- 4.2.11.4. Employment
- 4.2.11.5. Taxes
- 4.2.11.6. R&D Innovation
- 4.2.11.7. Stock Market Performance
- 4.2.11.8. Supply Chain
- 4.2.11.9. Cross-Border Dynamics
- 4.2.1. Time Period
SECTION II: QUALITATIVE INSIGHTS
5. EXECUTIVE SUMMARY
6. INTRODUCTION
- 6.1. Chapter Overview
- 6.2. Overview of Smart Water Management Market
- 6.2.1. Type of Management
- 6.2.2. Type of Services
- 6.2.3. Type of Water Meter
- 6.2.4. Type of Offering
- 6.2.5. Areas of Application
- 6.2.6. Type of End-Users
- 6.3. Future Perspective
7. REGULATORY SCENARIO
SECTION III: MARKET OVERVIEW
8. COMPREHENSIVE DATABASE OF LEADING PLAYERS
9. COMPETITIVE LANDSCAPE
- 9.1. Chapter Overview
- 9.2. Edge Computing: Overall Market Landscape
- 9.2.1. Analysis by Year of Establishment
- 9.2.2. Analysis by Company Size
- 9.2.3. Analysis by Location of Headquarters
- 9.2.4. Analysis by Ownership Structure
10. WHITE SPACE ANALYSIS
11. COMPANY COMPETITIVENESS ANALYSIS
12. STARTUP ECOSYSTEM IN THE SMART WATER MANAGEMENT MARKET
- 12.1. Smart Water Management Market: Market Landscape of Startups
- 12.1.1. Analysis by Year of Establishment
- 12.1.2. Analysis by Company Size
- 12.1.3. Analysis by Company Size and Year of Establishment
- 12.1.4. Analysis by Location of Headquarters
- 12.1.5. Analysis by Company Size and Location of Headquarters
- 12.1.6. Analysis by Ownership Structure
- 12.2. Key Findings
SECTION IV: COMPANY PROFILES
13. COMPANY PROFILES
- 13.1. Chapter Overview
- 13.2. ABB*
- 13.2.1. Company Overview
- 13.2.2. Company Mission
- 13.2.3. Company Footprint
- 13.2.4. Management Team
- 13.2.5. Contact Details
- 13.2.6. Financial Performance
- 13.2.7. Operating Business Segments
- 13.2.8. Service / Product Portfolio (project specific)
- 13.2.9. MOAT Analysis
- 13.2.10. Recent Developments and Future Outlook
- 13.3. Arad Group
- 13.4. Badger Meter
- 13.5. Diehl Stiftung
- 13.6. Evoqua Water Technologies
- 13.7. GE Digital
- 13.8. Honeywell
- 13.9. Hydraulx
- 13.10. i20 Water
- 13.11. IBM
- 13.12. Itron
- 13.13. Kamstrup
- 13.14. Ketos
- 13.15. Landis+Gyr
- 13.16. Neptune Technology Group
- 13.17. Oracle
- 13.18. Radius Synergies International
- 13.19. Schneider Electric
SECTION V: MARKET TRENDS
14. MEGA TRENDS ANALYSIS
15. UNMET NEED ANALYSIS
16. PATENT ANALYSIS
17. RECENT DEVELOPMENTS
- 17.1. Chapter Overview
- 17.2. Recent Funding
- 17.3. Recent Partnerships
- 17.4. Other Recent Initiatives
SECTION VI: MARKET OPPORTUNITY ANALYSIS
18. GLOBAL SMART WATER MANAGEMENT MARKET
- 18.1. Chapter Overview
- 18.2. Key Assumptions and Methodology
- 18.3. Trends Disruption Impacting Market
- 18.4. Demand Side Trends
- 18.5. Supply Side Trends
- 18.6. Global Smart Water Management Market, Historical Trends (Since 2019) and Forecasted Estimates (Till 2035)
- 18.7. Multivariate Scenario Analysis
- 18.7.1. Conservative Scenario
- 18.7.2. Optimistic Scenario
- 18.8. Investment Feasibility Index
- 18.9. Key Market Segmentations
19. MARKET OPPORTUNITIES BASED ON TYPE OF MANAGEMENT
- 19.1. Chapter Overview
- 19.2. Key Assumptions and Methodology
- 19.3. Revenue Shift Analysis
- 19.4. Market Movement Analysis
- 19.5. Penetration-Growth (P-G) Matrix
- 19.6. Smart Water Management Market for Advanced Analytics: Historical Trends (Since 2019) and Forecasted Estimates (Till 2035)
- 19.7. Smart Water Management Market for Advanced Pressure Management: Historical Trends (Since 2019) and Forecasted Estimates (Till 2035)
- 19.8. Smart Water Management Market for Distribution Network Monitoring: Historical Trends (Since 2019) and Forecasted Estimates (Till 2035)
- 19.9. Smart Water Management Market for Enterprise Asset Management for Water and Water waste Utilities: Historical Trends (Since 2019) and Forecasted Estimates (Till 2035)
- 19.10. Smart Water Management Market for Meter Data Management (MDM) for Water Network Monitoring: Historical Trends (Since 2019) and Forecasted Estimates (Till 2035)
- 19.11. Smart Water Management Market for Residential Water Efficiency: Historical Trends (Since 2019) and Forecasted Estimates (Till 2035)
- 19.12. Smart Water Management Market for SCADA Systems for Water and Wastewater Utilities: Historical Trends (Since 2019) and Forecasted Estimates (Till 2035)
- 19.13. Smart Water Management Market for Smart Irrigation Management Systems: Historical Trends (Since 2019) and Forecasted Estimates (Till 2035)
- 19.14. Smart Water Management Market for Solution Asset Management: Historical Trends (Since 2019) and Forecasted Estimates (Till 2035)
- 19.15. Data Triangulation and Validation
- 19.15.1. Secondary Sources
- 19.15.2. Primary Sources
- 19.15.3. Statistical Modeling
20. MARKET OPPORTUNITIES BASED ON TYPE OF SERVICES
- 20.1. Chapter Overview
- 20.2. Key Assumptions and Methodology
- 20.3. Revenue Shift Analysis
- 20.4. Market Movement Analysis
- 20.5. Penetration-Growth (P-G) Matrix
- 20.6. Smart Water Management Market for Managed Services: Historical Trends (Since 2019) and Forecasted Estimates (Till 2035)
- 20.7. Smart Water Management Market for Professional Services: Historical Trends (Since 2019) and Forecasted Estimates (Till 2035)
- 20.8. Data Triangulation and Validation
- 20.8.1. Secondary Sources
- 20.8.2. Primary Sources
- 20.8.3. Statistical Modeling
21. MARKET OPPORTUNITIES BASED ON TYPE OF WATER METER
- 21.1. Chapter Overview
- 21.2. Key Assumptions and Methodology
- 21.3. Revenue Shift Analysis
- 21.4. Market Movement Analysis
- 21.5. Penetration-Growth (P-G) Matrix
- 21.6. Smart Water Management Market for AMI: Historical Trends (Since 2019) and Forecasted Estimates (Till 2035)
- 21.7. Smart Water Management Market for AMR: Historical Trends (Since 2019) and Forecasted Estimates (Till 2035)
- 21.8. Data Triangulation and Validation
- 21.8.1. Secondary Sources
- 21.8.2. Primary Sources
- 21.8.3. Statistical Modeling
22. MARKET OPPORTUNITIES BASED ON TYPE OF OFFERING
- 22.1. Chapter Overview
- 22.2. Key Assumptions and Methodology
- 22.3. Revenue Shift Analysis
- 22.4. Market Movement Analysis
- 22.5. Penetration-Growth (P-G) Matrix
- 22.6. Smart Water Management Market for Service Outlook: Historical Trends (Since 2019) and Forecasted Estimates (Till 2035)
- 22.7. Smart Water Management Market for Solution Outlook: Historical Trends (Since 2019) and Forecasted Estimates (Till 2035)
- 22.8. Data Triangulation and Validation
- 22.8.1. Secondary Sources
- 22.8.2. Primary Sources
- 22.8.3. Statistical Modeling
23. MARKET OPPORTUNITIES BASED ON AREAS OF APPLICATION
- 23.1. Chapter Overview
- 23.2. Key Assumptions and Methodology
- 23.3. Revenue Shift Analysis
- 23.4. Market Movement Analysis
- 23.5. Penetration-Growth (P-G) Matrix
- 23.6. Smart Water Management Market for Analytics and Data Management: Historical Trends (Since 2019) and Forecasted Estimates (Till 2035)
- 23.7. Smart Water Management Market for Leak Detection: Historical Trends (Since 2019) and Forecasted Estimates (Till 2035)
- 23.8. Smart Water Management Market for Pressure Control: Historical Trends (Since 2019) and Forecasted Estimates (Till 2035)
- 23.9. Smart Water Management Market for Water Management: Historical Trends (Since 2019) and Forecasted Estimates (Till 2035)
- 23.10. Smart Water Management Market for Water Quality & Quantity Monitoring: Historical Trends (Since 2019) and Forecasted Estimates (Till 2035)
- 23.11. Smart Water Management Market for Water Treatment & Automation: Historical Trends (Since 2019) and Forecasted Estimates (Till 2035)
- 23.12. Data Triangulation and Validation
- 23.12.1. Secondary Sources
- 23.12.2. Primary Sources
- 23.12.3. Statistical Modeling
24. MARKET OPPORTUNITIES BASED ON TYPE OF END USER
- 24.1. Chapter Overview
- 24.2. Key Assumptions and Methodology
- 24.3. Revenue Shift Analysis
- 24.4. Market Movement Analysis
- 24.5. Penetration-Growth (P-G) Matrix
- 24.6. Smart Water Management Market for Commercial: Historical Trends (Since 2019) and Forecasted Estimates (Till 2035)
- 24.7. Smart Water Management Market for Industrial: Historical Trends (Since 2019) and Forecasted Estimates (Till 2035)
- 24.8. Smart Water Management Market for Residential: Historical Trends (Since 2019) and Forecasted Estimates (Till 2035)
- 24.9. Data Triangulation and Validation
- 24.9.1. Secondary Sources
- 24.9.2. Primary Sources
- 24.9.3. Statistical Modeling
25. MARKET OPPORTUNITIES FOR SMART WATER MANAGEMENT IN NORTH AMERICA
- 25.1. Chapter Overview
- 25.2. Key Assumptions and Methodology
- 25.3. Revenue Shift Analysis
- 25.4. Market Movement Analysis
- 25.5. Penetration-Growth (P-G) Matrix
- 25.6. Smart Water Management Market in North America: Historical Trends (Since 2019) and Forecasted Estimates (Till 2035)
- 25.6.1. Smart Water Management Market in the US: Historical Trends (Since 2019) and Forecasted Estimates (Till 2035)
- 25.6.2. Smart Water Management Market in Canada: Historical Trends (Since 2019) and Forecasted Estimates (Till 2035)
- 25.6.3. Smart Water Management Market in Mexico: Historical Trends (Since 2019) and Forecasted Estimates (Till 2035)
- 25.6.4. Smart Water Management Market in Other North American Countries: Historical Trends (Since 2019) and Forecasted Estimates (Till 2035)
- 25.7. Data Triangulation and Validation
26. MARKET OPPORTUNITIES FOR SMART WATER MANAGEMENT IN EUROPE
- 26.1. Chapter Overview
- 26.2. Key Assumptions and Methodology
- 26.3. Revenue Shift Analysis
- 26.4. Market Movement Analysis
- 26.5. Penetration-Growth (P-G) Matrix
- 26.6. Smart Water Management Market in Europe: Historical Trends (Since 2019) and Forecasted Estimates (Till 2035)
- 26.6.1. Smart Water Management Market in Austria: Historical Trends (Since 2019) and Forecasted Estimates (Till 2035)
- 26.6.2. Smart Water Management Market in Belgium: Historical Trends (Since 2019) and Forecasted Estimates (Till 2035)
- 26.6.3. Smart Water Management Market in Denmark: Historical Trends (Since 2019) and Forecasted Estimates (Till 2035)
- 26.6.4. Smart Water Management Market in France: Historical Trends (Since 2019) and Forecasted Estimates (Till 2035)
- 26.6.5. Smart Water Management Market in Germany: Historical Trends (Since 2019) and Forecasted Estimates (Till 2035)
- 26.6.6. Smart Water Management Market in Ireland: Historical Trends (Since 2019) and Forecasted Estimates (Till 2035)
- 26.6.7. Smart Water Management Market in Italy: Historical Trends (Since 2019) and Forecasted Estimates (Till 2035)
- 26.6.8. Smart Water Management Market in Netherlands: Historical Trends (Since 2019) and Forecasted Estimates (Till 2035)
- 26.6.9. Smart Water Management Market in Norway: Historical Trends (Since 2019) and Forecasted Estimates (Till 2035)
- 26.6.10. Smart Water Management Market in Russia: Historical Trends (Since 2019) and Forecasted Estimates (Till 2035)
- 26.6.11. Smart Water Management Market in Spain: Historical Trends (Since 2019) and Forecasted Estimates (Till 2035)
- 26.6.12. Smart Water Management Market in Sweden: Historical Trends (Since 2019) and Forecasted Estimates (Till 2035)
- 26.6.13. Smart Water Management Market in Sweden: Historical Trends (Since 2019) and Forecasted Estimates (Till 2035)
- 26.6.14. Smart Water Management Market in Switzerland: Historical Trends (Since 2019) and Forecasted Estimates (Till 2035)
- 26.6.15. Smart Water Management Market in the UK: Historical Trends (Since 2019) and Forecasted Estimates (Till 2035)
- 26.6.16. Smart Water Management Market in Other European Countries: Historical Trends (Since 2019) and Forecasted Estimates (Till 2035)
- 26.7. Data Triangulation and Validation
27. MARKET OPPORTUNITIES FOR SMART WATER MANAGEMENT IN ASIA
- 27.1. Chapter Overview
- 27.2. Key Assumptions and Methodology
- 27.3. Revenue Shift Analysis
- 27.4. Market Movement Analysis
- 27.5. Penetration-Growth (P-G) Matrix
- 27.6. Smart Water Management Market in Asia: Historical Trends (Since 2019) and Forecasted Estimates (Till 2035)
- 27.6.1. Smart Water Management Market in China: Historical Trends (Since 2019) and Forecasted Estimates (Till 2035)
- 27.6.2. Smart Water Management Market in India: Historical Trends (Since 2019) and Forecasted Estimates (Till 2035)
- 27.6.3. Smart Water Management Market in Japan: Historical Trends (Since 2019) and Forecasted Estimates (Till 2035)
- 27.6.4. Smart Water Management Market in Singapore: Historical Trends (Since 2019) and Forecasted Estimates (Till 2035)
- 27.6.5. Smart Water Management Market in South Korea: Historical Trends (Since 2019) and Forecasted Estimates (Till 2035)
- 27.6.6. Smart Water Management Market in Other Asian Countries: Historical Trends (Since 2019) and Forecasted Estimates (Till 2035)
- 27.7. Data Triangulation and Validation
28. MARKET OPPORTUNITIES FOR SMART WATER MANAGEMENT IN MIDDLE EAST AND NORTH AFRICA (MENA)
- 28.1. Chapter Overview
- 28.2. Key Assumptions and Methodology
- 28.3. Revenue Shift Analysis
- 28.4. Market Movement Analysis
- 28.5. Penetration-Growth (P-G) Matrix
- 28.6. Smart Water Management Market in Middle East and North Africa (MENA): Historical Trends (Since 2019) and Forecasted Estimates (Till 2035)
- 28.6.1. Smart Water Management Market in Egypt: Historical Trends (Since 2019) and Forecasted Estimates (Till 205)
- 28.6.2. Smart Water Management Market in Iran: Historical Trends (Since 2019) and Forecasted Estimates (Till 2035)
- 28.6.3. Smart Water Management Market in Iraq: Historical Trends (Since 2019) and Forecasted Estimates (Till 2035)
- 28.6.4. Smart Water Management Market in Israel: Historical Trends (Since 2019) and Forecasted Estimates (Till 2035)
- 28.6.5. Smart Water Management Market in Kuwait: Historical Trends (Since 2019) and Forecasted Estimates (Till 2035)
- 28.6.6. Smart Water Management Market in Saudi Arabia: Historical Trends (Since 2019) and Forecasted Estimates (Till 2035)
- 28.6.7. Smart Water Management Market in United Arab Emirates (UAE): Historical Trends (Since 2019) and Forecasted Estimates (Till 2035)
- 28.6.8. Smart Water Management Market in Other MENA Countries: Historical Trends (Since 2019) and Forecasted Estimates (Till 2035)
- 28.7. Data Triangulation and Validation
29. MARKET OPPORTUNITIES FOR SMART WATER MANAGEMENT IN LATIN AMERICA
- 29.1. Chapter Overview
- 29.2. Key Assumptions and Methodology
- 29.3. Revenue Shift Analysis
- 29.4. Market Movement Analysis
- 29.5. Penetration-Growth (P-G) Matrix
- 29.6. Smart Water Management Market in Latin America: Historical Trends (Since 2019) and Forecasted Estimates (Till 2035)
- 29.6.1. Smart Water Management Market in Argentina: Historical Trends (Since 2019) and Forecasted Estimates (Till 2035)
- 29.6.2. Smart Water Management Market in Brazil: Historical Trends (Since 2019) and Forecasted Estimates (Till 2035)
- 29.6.3. Smart Water Management Market in Chile: Historical Trends (Since 2019) and Forecasted Estimates (Till 2035)
- 29.6.4. Smart Water Management Market in Colombia Historical Trends (Since 2019) and Forecasted Estimates (Till 2035)
- 29.6.5. Smart Water Management Market in Venezuela: Historical Trends (Since 2019) and Forecasted Estimates (Till 2035)
- 29.6.6. Smart Water Management Market in Other Latin American Countries: Historical Trends (Since 2019) and Forecasted Estimates (Till 2035)
- 29.7. Data Triangulation and Validation
30. MARKET OPPORTUNITIES FOR SMART WATER MANAGEMENT IN REST OF THE WORLD
- 30.1. Chapter Overview
- 30.2. Key Assumptions and Methodology
- 30.3. Revenue Shift Analysis
- 30.4. Market Movement Analysis
- 30.5. Penetration-Growth (P-G) Matrix
- 30.6. Smart Water Management Market in Rest of the World: Historical Trends (Since 2019) and Forecasted Estimates (Till 2035)
- 30.6.1. Smart Water Management Market in Australia: Historical Trends (Since 2019) and Forecasted Estimates (Till 2035)
- 30.6.2. Smart Water Management Market in New Zealand: Historical Trends (Since 2019) and Forecasted Estimates (Till 2035)
- 30.6.3. Smart Water Management Market in Other Countries
- 30.7. Data Triangulation and Validation
31. MARKET CONCENTRATION ANALYSIS: DISTRIBUTION BY LEADING PLAYERS
- 31.1. Leading Player 1
- 31.2. Leading Player 2
- 31.3. Leading Player 3
- 31.4. Leading Player 4
- 31.5. Leading Player 5
- 31.6. Leading Player 6
- 31.7. Leading Player 7
- 31.8. Leading Player 8
32. ADJACENT MARKET ANALYSIS
SECTION VII: STRATEGIC TOOLS
33. KEY WINNING STRATEGIES
34. PORTER'S FIVE FORCES ANALYSIS
35. SWOT ANALYSIS
36. VALUE CHAIN ANALYSIS
37. ROOTS STRATEGIC RECOMMENDATIONS
- 37.1. Chapter Overview
- 37.2. Key Business-related Strategies
- 37.2.1. Research & Development
- 37.2.2. Product Manufacturing
- 37.2.3. Commercialization / Go-to-Market
- 37.2.4. Sales and Marketing
- 37.3. Key Operations-related Strategies
- 37.3.1. Risk Management
- 37.3.2. Workforce
- 37.3.3. Finance
- 37.3.4. Others
