
|
市場調査レポート
商品コード
1787838
DevOps市場:産業動向・世界の予測 (~2035年):提供区分・展開モデル・ツール・産業・企業規模・地域別DevOps Market Till 2035: Distribution by Type of Offering, Type of Deployment Model, Type of Tools, Type of Industry Vertical, Company Size, and Key Geographical Regions: Industry Trends and Global Forecasts |
||||||
カスタマイズ可能
|
|||||||
| DevOps市場:産業動向・世界の予測 (~2035年):提供区分・展開モデル・ツール・産業・企業規模・地域別 |
|
出版日: 2025年08月11日
発行: Roots Analysis
ページ情報: 英文 188 Pages
納期: 7~10営業日
|

全表示
- 概要
- 目次
DevOps市場:概要
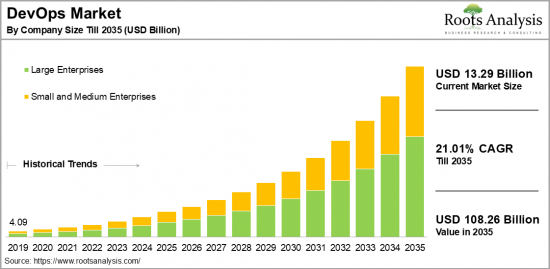
世界のDevOpsの市場規模は、現在の132億9,000万米ドルから、予測期間中はCAGR 21.01%で推移し、2035年には1,082億6,000万米ドルに成長すると予測されています。
DevOps市場の機会:分類
提供区分
- サービス
- ソリューション
展開モデル
- ハイブリッドクラウド
- プライベートクラウド
- パブリッククラウド
ツール
- 開発ツール
- 運用ツール
- テストツール
産業
- BFSI
- 政府・公共機関
- ヘルスケア
- 製造
- 小売
- 通信・情報技術サービス(ITES)
- その他
企業規模
- 大企業
- 中小企業
地域
- 北米
- 米国
- カナダ
- メキシコ
- その他の北米諸国
- 欧州
- オーストリア
- ベルギー
- デンマーク
- フランス
- ドイツ
- アイルランド
- イタリア
- オランダ
- ノルウェー
- ロシア
- スペイン
- スウェーデン
- スイス
- 英国
- その他の欧州諸国
- アジア
- 中国
- インド
- 日本
- シンガポール
- 韓国
- その他のアジア諸国
- ラテンアメリカ
- ブラジル
- チリ
- コロンビア
- ベネズエラ
- その他のラテンアメリカ諸国
- 中東・北アフリカ
- エジプト
- イラン
- イラク
- イスラエル
- クウェート
- サウジアラビア
- アラブ首長国連邦
- その他の中東・北アフリカ諸国
- 世界のその他の地域
- オーストラリア
- ニュージーランド
- その他の国
DevOps市場:成長と動向
DevOpsは、開発と運用の原則を組み合わせ、人材・プロセス・技術を統合するための統一フレームワークを確立する手法です。その主な目的は、従来の方法と比べてソフトウェアの開発および提供の速度・安全性・効率を向上させることにあります。アジャイルソフトウェア開発手法から派生したDevOpsは、部門横断型のアプローチを活用して、迅速かつ反復的なアプリケーションの展開を可能にします。これにより、継続的デリバリーを維持しつつ高品質なソフトウェアを確保しながら、システム開発ライフサイクルを短縮することを目指します。
世界のDevOps市場は、迅速なソフトウェア提供や組織内の運用効率向上に対する需要の高まりを背景に、大きく拡大しています。DevOpsは開発と運用を融合したもので、ソフトウェア開発チームとIT運用チームを統合するためのツールや実践方法の集合体であり、その結果、ソフトウェア開発ライフサイクルの速度と品質の双方を向上させます。これらの要因により、DevOps市場は予測期間中に大きな成長を遂げると見込まれます。
当レポートでは、世界のDevOpsの市場を調査し、 市場概要、背景、市場影響因子の分析、市場規模の推移・予測、各種区分・地域別の詳細分析、競合情勢、主要企業のプロファイルなどをまとめています。
目次
セクションI:レポート概要
第1章 序文
第2章 調査手法
第3章 市場力学
第4章 マクロ経済指標
セクションII:定性的洞察
第5章 エグゼクティブサマリー
第6章 イントロダクション
第7章 規制シナリオ
セクションIII:市場概要
第8章 主要企業の包括的データベース
第9章 競合情勢
第10章 ホワイトスペース分析
第11章 企業の競争力分析
第12章 DevOps市場におけるスタートアップエコシステム
セクションIV:企業プロファイル
第13章 企業プロファイル
- 章の概要
- Amazon Web Services
- Atlassian
- Broadcom
- CA Technologies
- Cisco Systems
- Cigniti Technologies
- Dell Technologies
- Docker
- EMC
- GitLab
- Hewlett Packard
- IBM
- Micro Focus International
- Microsoft
- Oracle
- Puppet
- Progress Chef Software
セクションV:市場動向
第14章 メガトレンド分析
第15章 アンメットニーズの分析
第16章 特許分析
第17章 最近の動向
セクションVI:市場機会の分析
第18章 世界のDevOps市場
第19章 提供区分別の市場機会
第20章 展開モデル別の市場機会
第21章 ツール別の市場機会
第22章 産業別の市場機会
第23章 DevOpsの市場機会:北米
第24章 DevOpsの市場機会:欧州
第25章 DevOpsの市場機会:アジア
第26章 DevOpsの市場機会:中東・北アフリカ
第27章 DevOpsの市場機会:ラテンアメリカ
第28章 DevOpsの市場機会:世界のその他の地域
第29章 市場集中分析:主要企業の分布
第30章 隣接市場分析
セクションVII:戦略ツール
第31章 勝利の鍵となる戦略
第32章 ポーターのファイブフォース分析
第33章 SWOT分析
第34章 バリューチェーン分析
第35章 ROOTSの戦略提言
セクションVIII:その他の独占的洞察
第36章 1次調査からの洞察
第37章 報告書の結論
セクションIX:付録
第38章 表形式データ
第39章 企業・団体一覧
第40章 カスタマイズの機会
第41章 ROOTSサブスクリプションサービス
第42章 著者詳細
DevOps Market Overview
As per Roots Analysis, the global DevOps market size is estimated to grow from USD 13.29 billion in the current year to USD 108.26 billion by 2035, at a CAGR of 21.01% during the forecast period, till 2035.
The opportunity for devOps market has been distributed across the following segments:
Type of Offering
- Services
- Solutions
Type of Deployment Model
- Hybrid Cloud
- Private Cloud
- Public Cloud
Type of Tools
- Development Tools
- Operation Tools
- Testing Tools
Type of Industry Vertical
- BFSI
- Government and Public Sector
- Healthcare
- Manufacturing
- Retail
- Telecommunications and Information Technology Enabled Services (ITES)
- Others
Company Size
- Large Enterprises
- Small and Medium Enterprises
Geographical Regions
- North America
- US
- Canada
- Mexico
- Other North American countries
- Europe
- Austria
- Belgium
- Denmark
- France
- Germany
- Ireland
- Italy
- Netherlands
- Norway
- Russia
- Spain
- Sweden
- Switzerland
- UK
- Other European countries
- Asia
- China
- India
- Japan
- Singapore
- South Korea
- Other Asian countries
- Latin America
- Brazil
- Chile
- Colombia
- Venezuela
- Other Latin American countries
- Middle East and North Africa
- Egypt
- Iran
- Iraq
- Israel
- Kuwait
- Saudi Arabia
- UAE
- Other MENA countries
- Rest of the World
- Australia
- New Zealand
- Other countries
DEVOPS MARKET: GROWTH AND TRENDS
DevOps combines the principles of development and operations to establish a unified framework that integrates individuals, processes, and technology. Its main objective is to improve the speed, security, and efficiency of software development and delivery in comparison to conventional methods. Emerging from an agile software development approach, DevOps leverages a cross-functional strategy to facilitate rapid and iterative application deployment. It aims to shorten the system development lifecycle while maintaining continuous delivery and ensuring high-quality software.
The global market for DevOps is experiencing considerable expansion, driven by the increasing need for rapid software delivery and enhanced operational efficiency within organizations. As a blend of development and operations, DevOps comprises a collection of tools and practices intended to bring together software development and IT operations teams, ultimately improving both the speed and quality of the software development lifecycle. As a result, owing to these factors, the DevOps market is expected to experience significant growth during the forecast period.
DEVOPS MARKET: KEY SEGMENTS
Market Share by Type of Offering
Based on type of offering, the global devOps market is segmented into services and solutions. According to our estimates, currently, the services segment captures the majority share of the market. This can be attributed to the rising complexity of software development and the necessity for organizations to implement best practices in devOps. As companies aim to enhance their operational efficiency and hasten their software delivery processes, they frequently seek expert assistance in applying DevOps methodologies, which drives market expansion.
However, the solutions segment is expected to grow at a relatively higher CAGR during the forecast period. This increase is due to the growing dependence on automation and cloud-based DevOps platforms in software development.
Market Share by Type of Deployment Model
Based on type of deployment model, the devOps market is segmented into hybrid cloud, private cloud and public cloud. According to our estimates, currently, the public cloud segment captures the majority of the market. This can be attributed to its affordability, scalability, and accessibility. Organizations are showing a preference for public cloud solutions as they enable quick application deployment without the requirement of significant initial infrastructure investment.
However, the hybrid cloud segment is expected to grow at a relatively higher CAGR during the forecast period. This can be attributed to its capability to allow companies to keep sensitive data in a private environment while utilizing the scalability and flexibility of public cloud resources for less critical workloads.
Market Share by Type of Tools
Based on type of tools, the devOps market is segmented into development tools, operation tools, and testing tools. According to our estimates, currently, the development tools segment captures the majority share of the market. This can be attributed to the rising focus on improving collaboration and productivity among development teams. These tools support continuous integration and delivery (CI/CD), allowing developers to automate their workflows, manage code repositories, and optimize application deployment processes.
However, the testing tools segment is expected to grow at a relatively higher CAGR during the forecast period. This can be attributed to the heightened emphasis on quality and efficiency in software testing.
Market Share by Type of Industry Vertical
Based on type of industry vertical, the devOps market is segmented into BFSI, government and public sector, healthcare, manufacturing, retail, telecommunications and information technology enabled services (ITES) and others. According to our estimates, currently, the BFSI segment captures the majority share of the market. This growth can be attributed to the sector's essential requirement for swift software development and deployment in order to comply with regulatory requirements and improve customer service.
However, the healthcare industry is expected to grow at a relatively higher CAGR during the forecast period. This can be attributed to the rising demand for digital transformation within healthcare, including the implementation of electronic health records (EHR), telemedicine, and patient management systems.
Market Share by Company Size
Based on company size, the devOps market is segmented into large and small and medium enterprise. According to our estimates, currently, the large enterprise segment captures the majority share of the market. On the other hand, the small and medium enterprise segments are anticipated to experience a higher growth rate during the forecast period. This growth can be attributed to the adoption of devOps in businesses, their agility, innovation, focus on specialized markets, and their capability to adjust to evolving customer preferences and market dynamics..
Market Share by Geographical Regions
Based on geographical regions, the devOps market is segmented into North America, Europe, Asia, Latin America, Middle East and North Africa, and the rest of the world. According to our estimates, currently, North America captures the majority share of the market. However, the market in Asia is expected to grow at a higher CAGR during the forecast period. This growth can be attributed to the presence of large enterprises and multinational companies across various industries such as technology, finance, healthcare, and manufacturing. These businesses often face intricate IT landscapes and struggle with the management of extensive software applications and infrastructure.
Example Players in DevOps Market
- Amazon Web Services
- Atlassian
- Broadcom
- CA Technologies
- Cisco Systems
- Cigniti Technologies
- Dell Technologies
- Docker
- EMC
- GitLab
- Hewlett Packard
- IBM
- Micro Focus International
- Microsoft
- Oracle
- Puppet
- Progress Chef Software
- RapidValue
- Red Hat
- Splunk sS
DEVOPS MARKET: RESEARCH COVERAGE
The report on the DevOps market features insights on various sections, including:
- Market Sizing and Opportunity Analysis: An in-depth analysis of the devOps market, focusing on key market segments, including [A] type of offering, [B] type of deployment model, [C] type of tools, [D] type of industry vertical, [E] company size, and [F] key geographical regions.
- Competitive Landscape: A comprehensive analysis of the companies engaged in the devOps market, based on several relevant parameters, such as [A] year of establishment, [B] company size, [C] location of headquarters and [D] ownership structure.
- Company Profiles: Elaborate profiles of prominent players engaged in the devOps market, providing details on [A] location of headquarters, [B] company size, [C] company mission, [D] company footprint, [E] management team, [F] contact details, [G] financial information, [H] operating business segments, [I] devOps portfolio, [J] moat analysis, [K] recent developments, and an informed future outlook.
- Megatrends: An evaluation of ongoing megatrends in devOps industry.
- Patent Analysis: An insightful analysis of patents filed / granted in the devOps domain, based on relevant parameters, including [A] type of patent, [B] patent publication year, [C] patent age and [D] leading players.
- Recent Developments: An overview of the recent developments made in the devOps market, along with analysis based on relevant parameters, including [A] year of initiative, [B] type of initiative, [C] geographical distribution and [D] most active players.
- Porter's Five Forces Analysis: An analysis of five competitive forces prevailing in the devOps market, including threats of new entrants, bargaining power of buyers, bargaining power of suppliers, threats of substitute products and rivalry among existing competitors.
- SWOT Analysis: An insightful SWOT framework, highlighting the strengths, weaknesses, opportunities and threats in the domain. Additionally, it provides Harvey ball analysis, highlighting the relative impact of each SWOT parameter.
- Value Chain Analysis: A comprehensive analysis of the value chain, providing information on the different phases and stakeholders involved in the devOps market.
KEY QUESTIONS ANSWERED IN THIS REPORT
- How many companies are currently engaged in devOps market?
- Which are the leading companies in this market?
- What factors are likely to influence the evolution of this market?
- What is the current and future market size?
- What is the CAGR of this market?
- How is the current and future market opportunity likely to be distributed across key market segments?
REASONS TO BUY THIS REPORT
- The report provides a comprehensive market analysis, offering detailed revenue projections of the overall market and its specific sub-segments. This information is valuable to both established market leaders and emerging entrants.
- Stakeholders can leverage the report to gain a deeper understanding of the competitive dynamics within the market. By analyzing the competitive landscape, businesses can make informed decisions to optimize their market positioning and develop effective go-to-market strategies.
- The report offers stakeholders a comprehensive overview of the market, including key drivers, barriers, opportunities, and challenges. This information empowers stakeholders to stay abreast of market trends and make data-driven decisions to capitalize on growth prospects.
ADDITIONAL BENEFITS
- Complimentary Excel Data Packs for all Analytical Modules in the Report
- 15% Free Content Customization
- Detailed Report Walkthrough Session with Research Team
- Free Updated report if the report is 6-12 months old or older
TABLE OF CONTENTS
SECTION I: REPORT OVERVIEW
1. PREFACE
- 1.1. Introduction
- 1.2. Market Share Insights
- 1.3. Key Market Insights
- 1.4. Report Coverage
- 1.5. Key Questions Answered
- 1.6. Chapter Outlines
2. RESEARCH METHODOLOGY
- 2.1. Chapter Overview
- 2.2. Research Assumptions
- 2.3. Database Building
- 2.3.1. Data Collection
- 2.3.2. Data Validation
- 2.3.3. Data Analysis
- 2.4. Project Methodology
- 2.4.1. Secondary Research
- 2.4.1.1. Annual Reports
- 2.4.1.2. Academic Research Papers
- 2.4.1.3. Company Websites
- 2.4.1.4. Investor Presentations
- 2.4.1.5. Regulatory Filings
- 2.4.1.6. White Papers
- 2.4.1.7. Industry Publications
- 2.4.1.8. Conferences and Seminars
- 2.4.1.9. Government Portals
- 2.4.1.10. Media and Press Releases
- 2.4.1.11. Newsletters
- 2.4.1.12. Industry Databases
- 2.4.1.13. Roots Proprietary Databases
- 2.4.1.14. Paid Databases and Sources
- 2.4.1.15. Social Media Portals
- 2.4.1.16. Other Secondary Sources
- 2.4.2. Primary Research
- 2.4.2.1. Introduction
- 2.4.2.2. Types
- 2.4.2.2.1. Qualitative
- 2.4.2.2.2. Quantitative
- 2.4.2.3. Advantages
- 2.4.2.4. Techniques
- 2.4.2.4.1. Interviews
- 2.4.2.4.2. Surveys
- 2.4.2.4.3. Focus Groups
- 2.4.2.4.4. Observational Research
- 2.4.2.4.5. Social Media Interactions
- 2.4.2.5. Stakeholders
- 2.4.2.5.1. Company Executives (CXOs)
- 2.4.2.5.2. Board of Directors
- 2.4.2.5.3. Company Presidents and Vice Presidents
- 2.4.2.5.4. Key Opinion Leaders
- 2.4.2.5.5. Research and Development Heads
- 2.4.2.5.6. Technical Experts
- 2.4.2.5.7. Subject Matter Experts
- 2.4.2.5.8. Scientists
- 2.4.2.5.9. Doctors and Other Healthcare Providers
- 2.4.2.6. Ethics and Integrity
- 2.4.2.6.1. Research Ethics
- 2.4.2.6.2. Data Integrity
- 2.4.3. Analytical Tools and Databases
- 2.4.1. Secondary Research
3. MARKET DYNAMICS
- 3.1. Forecast Methodology
- 3.1.1. Top-Down Approach
- 3.1.2. Bottom-Up Approach
- 3.1.3. Hybrid Approach
- 3.2. Market Assessment Framework
- 3.2.1. Total Addressable Market (TAM)
- 3.2.2. Serviceable Addressable Market (SAM)
- 3.2.3. Serviceable Obtainable Market (SOM)
- 3.2.4. Currently Acquired Market (CAM)
- 3.3. Forecasting Tools and Techniques
- 3.3.1. Qualitative Forecasting
- 3.3.2. Correlation
- 3.3.3. Regression
- 3.3.4. Time Series Analysis
- 3.3.5. Extrapolation
- 3.3.6. Convergence
- 3.3.7. Forecast Error Analysis
- 3.3.8. Data Visualization
- 3.3.9. Scenario Planning
- 3.3.10. Sensitivity Analysis
- 3.4. Key Considerations
- 3.4.1. Demographics
- 3.4.2. Market Access
- 3.4.3. Reimbursement Scenarios
- 3.4.4. Industry Consolidation
- 3.5. Robust Quality Control
- 3.6. Key Market Segmentations
- 3.7. Limitations
4. MACRO-ECONOMIC INDICATORS
- 4.1. Chapter Overview
- 4.2. Market Dynamics
- 4.2.1. Time Period
- 4.2.1.1. Historical Trends
- 4.2.1.2. Current and Forecasted Estimates
- 4.2.2. Currency Coverage
- 4.2.2.1. Overview of Major Currencies Affecting the Market
- 4.2.2.2. Impact of Currency Fluctuations on the Industry
- 4.2.3. Foreign Exchange Impact
- 4.2.3.1. Evaluation of Foreign Exchange Rates and Their Impact on Market
- 4.2.3.2. Strategies for Mitigating Foreign Exchange Risk
- 4.2.4. Recession
- 4.2.4.1. Historical Analysis of Past Recessions and Lessons Learnt
- 4.2.4.2. Assessment of Current Economic Conditions and Potential Impact on the Market
- 4.2.5. Inflation
- 4.2.5.1. Measurement and Analysis of Inflationary Pressures in the Economy
- 4.2.5.2. Potential Impact of Inflation on the Market Evolution
- 4.2.6. Interest Rates
- 4.2.6.1. Overview of Interest Rates and Their Impact on the Market
- 4.2.6.2. Strategies for Managing Interest Rate Risk
- 4.2.7. Commodity Flow Analysis
- 4.2.7.1. Type of Commodity
- 4.2.7.2. Origins and Destinations
- 4.2.7.3. Values and Weights
- 4.2.7.4. Modes of Transportation
- 4.2.8. Global Trade Dynamics
- 4.2.8.1. Import Scenario
- 4.2.8.2. Export Scenario
- 4.2.9. War Impact Analysis
- 4.2.9.1. Russian-Ukraine War
- 4.2.9.2. Israel-Hamas War
- 4.2.10. COVID Impact / Related Factors
- 4.2.10.1. Global Economic Impact
- 4.2.10.2. Industry-specific Impact
- 4.2.10.3. Government Response and Stimulus Measures
- 4.2.10.4. Future Outlook and Adaptation Strategies
- 4.2.11. Other Indicators
- 4.2.11.1. Fiscal Policy
- 4.2.11.2. Consumer Spending
- 4.2.11.3. Gross Domestic Product (GDP)
- 4.2.11.4. Employment
- 4.2.11.5. Taxes
- 4.2.11.6. R&D Innovation
- 4.2.11.7. Stock Market Performance
- 4.2.11.8. Supply Chain
- 4.2.11.9. Cross-Border Dynamics
- 4.2.1. Time Period
SECTION II: QUALITATIVE INSIGHTS
5. EXECUTIVE SUMMARY
6. INTRODUCTION
- 6.1. Chapter Overview
- 6.2. Overview of DevOps Market
- 6.2.1. Type of Offering
- 6.2.2. Type of Deployment Model
- 6.2.3. Type of Tools
- 6.2.4. Type of Industry Verticals
- 6.3. Future Perspective
7. REGULATORY SCENARIO
SECTION III: MARKET OVERVIEW
8. COMPREHENSIVE DATABASE OF LEADING PLAYERS
9. COMPETITIVE LANDSCAPE
- 9.1. Chapter Overview
- 9.2. DevOps: Overall Market Landscape
- 9.2.1. Analysis by Year of Establishment
- 9.2.2. Analysis by Company Size
- 9.2.3. Analysis by Location of Headquarters
- 9.2.4. Analysis by Ownership Structure
10. WHITE SPACE ANALYSIS
11. COMPANY COMPETITIVENESS ANALYSIS
12. STARTUP ECOSYSTEM IN THE DEVOPS MARKET
- 12.1. DevOps Market: Market Landscape of Startups
- 12.1.1. Analysis by Year of Establishment
- 12.1.2. Analysis by Company Size
- 12.1.3. Analysis by Company Size and Year of Establishment
- 12.1.4. Analysis by Location of Headquarters
- 12.1.5. Analysis by Company Size and Location of Headquarters
- 12.1.6. Analysis by Ownership Structure
- 12.2. Key Findings
SECTION IV: COMPANY PROFILES
13. COMPANY PROFILES
- 13.1. Chapter Overview
- 13.2. Amazon Web Services*
- 13.2.1. Company Overview
- 13.2.2. Company Mission
- 13.2.3. Company Footprint
- 13.2.4. Management Team
- 13.2.5. Contact Details
- 13.2.6. Financial Performance
- 13.2.7. Operating Business Segments
- 13.2.8. Service / Product Portfolio (project specific)
- 13.2.9. MOAT Analysis
- 13.2.10. Recent Developments and Future Outlook
- 13.3. Atlassian
- 13.4. Broadcom
- 13.5. CA Technologies
- 13.6. Cisco Systems
- 13.7. Cigniti Technologies
- 13.8. Dell Technologies
- 13.9. Docker
- 13.10. EMC
- 13.11. GitLab
- 13.12. Google
- 13.13. Hewlett Packard
- 13.14. IBM
- 13.15. Micro Focus International
- 13.16. Microsoft
- 13.17. Oracle
- 13.18. Puppet
- 13.19. Progress Chef Software
SECTION V: MARKET TRENDS
14. MEGA TRENDS ANALYSIS
15. UNMET NEED ANALYSIS
16. PATENT ANALYSIS
17. RECENT DEVELOPMENTS
- 17.1. Chapter Overview
- 17.2. Recent Funding
- 17.3. Recent Partnerships
- 17.4. Other Recent Initiatives
SECTION VI: MARKET OPPORTUNITY ANALYSIS
18. GLOBAL DEVOPS MARKET
- 18.1. Chapter Overview
- 18.2. Key Assumptions and Methodology
- 18.3. Trends Disruption Impacting Market
- 18.4. Demand Side Trends
- 18.5. Supply Side Trends
- 18.6. Global DevOps market, Historical Trends (Since 2019) and Forecasted Estimates (Till 2035)
- 18.7. Multivariate Scenario Analysis
- 18.7.1. Conservative Scenario
- 18.7.2. Optimistic Scenario
- 18.8. Investment Feasibility Index
- 18.9. Key Market Segmentations
19. MARKET OPPORTUNITIES BASED ON TYPE OF OFFERING
- 19.1. Chapter Overview
- 19.2. Key Assumptions and Methodology
- 19.3. Revenue Shift Analysis
- 19.4. Market Movement Analysis
- 19.5. Penetration-Growth (P-G) Matrix
- 19.6. DevOps Market for Services: Historical Trends (Since 2019) and Forecasted Estimates (Till 2035)
- 19.7. DevOps Market for Solutions: Historical Trends (Since 2019) and Forecasted Estimates (Till 2035)
- 19.8. Data Triangulation and Validation
- 19.8.1. Secondary Sources
- 19.8.2. Primary Sources
- 19.8.3. Statistical Modeling
20. MARKET OPPORTUNITIES BASED ON TYPE OF DEPLOYMENT MODEL
- 20.1. Chapter Overview
- 20.2. Key Assumptions and Methodology
- 20.3. Revenue Shift Analysis
- 20.4. Market Movement Analysis
- 20.5. Penetration-Growth (P-G) Matrix
- 20.6. DevOps Market for Hybrid Cloud: Historical Trends (Since 2019) and Forecasted Estimates (Till 2035)
- 20.7. DevOps Market for Private Cloud: Historical Trends (Since 2019) and Forecasted Estimates (Till 2035)
- 20.8. DevOps Market for Public Cloud: Historical Trends (Since 2019) and Forecasted Estimates (Till 2035)
- 20.9. Data Triangulation and Validation
- 20.9.1. Secondary Sources
- 20.9.2. Primary Sources
- 20.9.3. Statistical Modeling
21. MARKET OPPORTUNITIES BASED ON TYPE OF TOOLS
- 21.1. Chapter Overview
- 21.2. Key Assumptions and Methodology
- 21.3. Revenue Shift Analysis
- 21.4. Market Movement Analysis
- 21.5. Penetration-Growth (P-G) Matrix
- 21.6. DevOps Market for Development Tools: Historical Trends (Since 2019) and Forecasted Estimates (Till 2035)
- 21.7. DevOps Market for Operation Tools: Historical Trends (Since 2019) and Forecasted Estimates (Till 2035)
- 21.8. DevOps Market for Testing Tools: Historical Trends (Since 2019) and Forecasted Estimates (Till 2035)
- 21.9. Data Triangulation and Validation
- 21.9.1. Secondary Sources
- 21.9.2. Primary Sources
- 21.9.3. Statistical Modeling
22. MARKET OPPORTUNITIES BASED ON TYPE OF INUDUSTRY VERTICAL
- 22.1. Chapter Overview
- 22.2. Key Assumptions and Methodology
- 22.3. Revenue Shift Analysis
- 22.4. Market Movement Analysis
- 22.5. Penetration-Growth (P-G) Matrix
- 22.6. DevOps Market for BFSI: Historical Trends (Since 2019) and Forecasted Estimates (Till 2035)
- 22.7. DevOps Market for Government and Public Sector: Historical Trends (Since 2019) and Forecasted Estimates (Till 2035)
- 22.8. DevOps Market for Healthcare: Historical Trends (Since 2019) and Forecasted Estimates (Till 2035)
- 22.9. DevOps Market for Manufacturing: Historical Trends (Since 2019) and Forecasted Estimates (Till 2035)
- 22.10. DevOps Market for Retail: Historical Trends (Since 2019) and Forecasted Estimates (Till 2035)
- 22.11. DevOps Market for Telecommunications and Information Technology Enabled Services (ITES): Historical Trends (Since 2019) and Forecasted Estimates (Till 2035)
- 22.12. DevOps Market for Others: Historical Trends (Since 2019) and Forecasted Estimates (Till 2035)
- 22.13. Data Triangulation and Validation
- 22.13.1. Secondary Sources
- 22.13.2. Primary Sources
- 22.13.3. Statistical Modeling
23. MARKET OPPORTUNITIES FOR DEVOPS IN NORTH AMERICA
- 23.1. Chapter Overview
- 23.2. Key Assumptions and Methodology
- 23.3. Revenue Shift Analysis
- 23.4. Market Movement Analysis
- 23.5. Penetration-Growth (P-G) Matrix
- 23.6. DevOps Market in North America: Historical Trends (Since 2019) and Forecasted Estimates (Till 2035)
- 23.6.1. DevOps Market in the US: Historical Trends (Since 2019) and Forecasted Estimates (Till 2035)
- 23.6.2. DevOps Market in Canada: Historical Trends (Since 2019) and Forecasted Estimates (Till 2035)
- 23.6.3. DevOps Market in Mexico: Historical Trends (Since 2019) and Forecasted Estimates (Till 2035)
- 23.6.4. DevOps Market in Other North American Countries: Historical Trends (Since 2019) and Forecasted Estimates (Till 2035)
- 23.7. Data Triangulation and Validation
24. MARKET OPPORTUNITIES FOR DEVOPS IN EUROPE
- 24.1. Chapter Overview
- 24.2. Key Assumptions and Methodology
- 24.3. Revenue Shift Analysis
- 24.4. Market Movement Analysis
- 24.5. Penetration-Growth (P-G) Matrix
- 24.6. DevOps Market in Europe: Historical Trends (Since 2019) and Forecasted Estimates (Till 2035)
- 24.6.1. DevOps Market in Austria: Historical Trends (Since 2019) and Forecasted Estimates (Till 2035)
- 24.6.2. DevOps Market in Belgium: Historical Trends (Since 2019) and Forecasted Estimates (Till 2035)
- 24.6.3. DevOps Market in Denmark: Historical Trends (Since 2019) and Forecasted Estimates (Till 2035)
- 24.6.4. DevOps Market in France: Historical Trends (Since 2019) and Forecasted Estimates (Till 2035)
- 24.6.5. DevOps Market in Germany: Historical Trends (Since 2019) and Forecasted Estimates (Till 2035)
- 24.6.6. DevOps Market in Ireland: Historical Trends (Since 2019) and Forecasted Estimates (Till 2035)
- 24.6.7. DevOps Market in Italy: Historical Trends (Since 2019) and Forecasted Estimates (Till 2035)
- 24.6.8. DevOps Market in Netherlands: Historical Trends (Since 2019) and Forecasted Estimates (Till 2035)
- 24.6.9. DevOps Market in Norway: Historical Trends (Since 2019) and Forecasted Estimates (Till 2035)
- 24.6.10. DevOps Market in Russia: Historical Trends (Since 2019) and Forecasted Estimates (Till 2035)
- 24.6.11. DevOps Market in Spain: Historical Trends (Since 2019) and Forecasted Estimates (Till 2035)
- 24.6.12. DevOps Market in Sweden: Historical Trends (Since 2019) and Forecasted Estimates (Till 2035)
- 24.6.13. DevOps Market in Sweden: Historical Trends (Since 2019) and Forecasted Estimates (Till 2035)
- 24.6.14. DevOps Market in Switzerland: Historical Trends (Since 2019) and Forecasted Estimates (Till 2035)
- 24.6.15. DevOps Market in the UK: Historical Trends (Since 2019) and Forecasted Estimates (Till 2035)
- 24.6.16. DevOps Market in Other European Countries: Historical Trends (Since 2019) and Forecasted Estimates (Till 2035)
- 24.7. Data Triangulation and Validation
25. MARKET OPPORTUNITIES FOR DEVOPS IN ASIA
- 25.1. Chapter Overview
- 25.2. Key Assumptions and Methodology
- 25.3. Revenue Shift Analysis
- 25.4. Market Movement Analysis
- 25.5. Penetration-Growth (P-G) Matrix
- 25.6. DevOps Market in Asia: Historical Trends (Since 2019) and Forecasted Estimates (Till 2035)
- 25.6.1. DevOps Market in China: Historical Trends (Since 2019) and Forecasted Estimates (Till 2035)
- 25.6.2. DevOps Market in India: Historical Trends (Since 2019) and Forecasted Estimates (Till 2035)
- 25.6.3. DevOps Market in Japan: Historical Trends (Since 2019) and Forecasted Estimates (Till 2035)
- 25.6.4. DevOps Market in Singapore: Historical Trends (Since 2019) and Forecasted Estimates (Till 2035)
- 25.6.5. DevOps Market in South Korea: Historical Trends (Since 2019) and Forecasted Estimates (Till 2035)
- 25.6.6. DevOps Market in Other Asian Countries: Historical Trends (Since 2019) and Forecasted Estimates (Till 2035)
- 25.7. Data Triangulation and Validation
26. MARKET OPPORTUNITIES FOR DEVOPS IN MIDDLE EAST AND NORTH AFRICA (MENA)
- 26.1. Chapter Overview
- 26.2. Key Assumptions and Methodology
- 26.3. Revenue Shift Analysis
- 26.4. Market Movement Analysis
- 26.5. Penetration-Growth (P-G) Matrix
- 26.6. DevOps Market in Middle East and North Africa (MENA): Historical Trends (Since 2019) and Forecasted Estimates (Till 2035)
- 26.6.1. DevOps Market in Egypt: Historical Trends (Since 2019) and Forecasted Estimates (Till 205)
- 26.6.2. DevOps Market in Iran: Historical Trends (Since 2019) and Forecasted Estimates (Till 2035)
- 26.6.3. DevOps Market in Iraq: Historical Trends (Since 2019) and Forecasted Estimates (Till 2035)
- 26.6.4. DevOps Market in Israel: Historical Trends (Since 2019) and Forecasted Estimates (Till 2035)
- 26.6.5. DevOps Market in Kuwait: Historical Trends (Since 2019) and Forecasted Estimates (Till 2035)
- 26.6.6. DevOps Market in Saudi Arabia: Historical Trends (Since 2019) and Forecasted Estimates (Till 2035)
- 26.6.7. DevOps Market in United Arab Emirates (UAE): Historical Trends (Since 2019) and Forecasted Estimates (Till 2035)
- 26.6.8. DevOps Market in Other MENA Countries: Historical Trends (Since 2019) and Forecasted Estimates (Till 2035)
- 26.7. Data Triangulation and Validation
27. MARKET OPPORTUNITIES FOR DEVOPS IN LATIN AMERICA
- 27.1. Chapter Overview
- 27.2. Key Assumptions and Methodology
- 27.3. Revenue Shift Analysis
- 27.4. Market Movement Analysis
- 27.5. Penetration-Growth (P-G) Matrix
- 27.6. DevOps Market in Latin America: Historical Trends (Since 2019) and Forecasted Estimates (Till 2035)
- 27.6.1. DevOps Market in Argentina: Historical Trends (Since 2019) and Forecasted Estimates (Till 2035)
- 27.6.2. DevOps Market in Brazil: Historical Trends (Since 2019) and Forecasted Estimates (Till 2035)
- 27.6.3. DevOps Market in Chile: Historical Trends (Since 2019) and Forecasted Estimates (Till 2035)
- 27.6.4. DevOps Market in Colombia Historical Trends (Since 2019) and Forecasted Estimates (Till 2035)
- 27.6.5. DevOps Market in Venezuela: Historical Trends (Since 2019) and Forecasted Estimates (Till 2035)
- 27.6.6. DevOps Market in Other Latin American Countries: Historical Trends (Since 2019) and Forecasted Estimates (Till 2035)
- 27.7. Data Triangulation and Validation
28. MARKET OPPORTUNITIES FOR DEVOPS IN REST OF THE WORLD
- 28.1. Chapter Overview
- 28.2. Key Assumptions and Methodology
- 28.3. Revenue Shift Analysis
- 28.4. Market Movement Analysis
- 28.5. Penetration-Growth (P-G) Matrix
- 28.6. DevOps Market in Rest of the World: Historical Trends (Since 2019) and Forecasted Estimates (Till 2035)
- 28.6.1. DevOps Market in Australia: Historical Trends (Since 2019) and Forecasted Estimates (Till 2035)
- 28.6.2. DevOps Market in New Zealand: Historical Trends (Since 2019) and Forecasted Estimates (Till 2035)
- 28.6.3. DevOps Market in Other Countries
- 28.7. Data Triangulation and Validation
29. MARKET CONCENTRATION ANALYSIS: DISTRIBUTION BY LEADING PLAYERS
- 29.1. Leading Player 1
- 29.2. Leading Player 2
- 29.3. Leading Player 3
- 29.4. Leading Player 4
- 29.5. Leading Player 5
- 29.6. Leading Player 6
- 29.7. Leading Player 7
- 29.8. Leading Player 8
30. ADJACENT MARKET ANALYSIS
SECTION VII: STRATEGIC TOOLS
31. KEY WINNING STRATEGIES
32. PORTER'S FIVE FORCES ANALYSIS
33. SWOT ANALYSIS
34. VALUE CHAIN ANALYSIS
35. ROOTS STRATEGIC RECOMMENDATIONS
- 35.1. Chapter Overview
- 35.2. Key Business-related Strategies
- 35.2.1. Research & Development
- 35.2.2. Product Manufacturing
- 35.2.3. Commercialization / Go-to-Market
- 35.2.4. Sales and Marketing
- 35.3. Key Operations-related Strategies
- 35.3.1. Risk Management
- 35.3.2. Workforce
- 35.3.3. Finance
- 35.3.4. Others
