
|
市場調査レポート
商品コード
1771419
ホログラフィックディスプレイ市場:産業動向・世界の予測 (~2035年):提供タイプ・用途・技術タイプ・企業タイプ・主要地域別Holographic Display Market Till 2035: Industry Trends and Global Forecasts: Distribution by Type of Offering, Areas of Application, Type of Technology, Type of Enterprise and Key Geographical Regions |
||||||
カスタマイズ可能
|
|||||||
| ホログラフィックディスプレイ市場:産業動向・世界の予測 (~2035年):提供タイプ・用途・技術タイプ・企業タイプ・主要地域別 |
|
出版日: 2025年07月15日
発行: Roots Analysis
ページ情報: 英文 175 Pages
納期: 7~10営業日
|

全表示
- 概要
- 目次
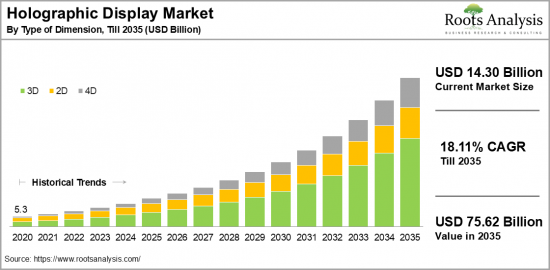
世界のホログラフィックディスプレイの市場規模は、2035年までの予測期間中にCAGR 18.11%で推移し、現在の143億米ドルから、2035年には756億2,000万米ドルに成長すると予測されています。
ホログラフィックディスプレイの市場機会:セグメント別
コンポーネントタイプ別
- デジタルマイクロメーター
- レンズ
- 光変調器
- モニター
- プロジェクター&カメラ
- スキャナー
- その他
技術タイプ別
- 電子ホログラフィック
- レーザープラズマディスプレイ
- ピストン
- 半透明
- タッチ可能
次元タイプ別
- 2D
- 3D
- 4D
用途別
- 商業
- 消費者
- 防衛
- 産業
- 医療
- その他
地域別
- 北米
- 米国
- カナダ
- メキシコ
- その他の北米諸国
- 欧州
- オーストリア
- ベルギー
- デンマーク
- フランス
- ドイツ
- アイルランド
- イタリア
- オランダ
- ノルウェー
- ロシア
- スペイン
- スウェーデン
- スイス
- 英国
- その他の欧州諸国
- アジア
- 中国
- インド
- 日本
- シンガポール
- 韓国
- その他のアジア諸国
- ラテンアメリカ
- ブラジル
- チリ
- コロンビア
- ベネズエラ
- その他のラテンアメリカ諸国
- 中東・北アフリカ
- エジプト
- イラン
- イラク
- イスラエル
- クウェート
- サウジアラビア
- アラブ首長国連邦
- その他の中東・北アフリカ諸国
- 世界のその他の地域
- オーストラリア
- ニュージーランド
- その他の国
ホログラフィックディスプレイ市場:成長と動向
ホログラフィックディスプレイとは、光を制御することで立体的な3D映像やビジュアルを生成し、あたかも実際に空間内に存在しているかのように見せる高度なタイプのスクリーン技術を指します。この技術により、視聴者は特別なメガネや装置を使用することなく、さまざまな角度から3Dコンテンツを観察・体験することが可能になります。
市場には、反射型、透過型、インタラクティブ型など多様な種類のディスプレイが存在し、それぞれ特定のニーズに対応しながら用途の幅を広げています。没入感のあるビジュアル体験、広い視野角、インタラクティブ性の向上といった顕著な利点により、ホログラフィックディスプレイはさまざまな業界で需要が高まっています。そのため、消費者とのインタラクションにおける影響力も大きく、企業はホログラフィを活用して印象的なブランド体験を創出し、競争が激化する市場の中で差別化を図っています。中でも、医療画像分野はこの技術の発展を牽引する最も重要な用途として位置づけられています。
また、今後のビジュアルディスプレイ技術のトレンドとして、ホログラフィは急速な進化を続けると予想されています。AIや拡張現実 (AR) といった先進技術と組み合わせた高度な応用に向けて、業界の多くの関係者が研究開発に積極的に取り組んでおり、ユーザー体験のさらなる向上が期待されています。以上の要因により、ホログラフィックディスプレイ市場は、予測期間中に大幅な成長を遂げると見込まれています。
当レポートでは、世界のホログラフィックディスプレイの市場を調査し、 市場概要、背景、市場影響因子の分析、市場規模の推移・予測、各種区分・地域別の詳細分析、競合情勢、主要企業のプロファイルなどをまとめています。
目次
セクションI:レポート概要
第1章 序文
第2章 調査手法
第3章 市場力学
第4章 マクロ経済指標
セクションII:定性的洞察
第5章 エグゼクティブサマリー
第6章 イントロダクション
第7章 規制シナリオ
セクションIII:市場概要
第8章 主要企業の包括的データベース
第9章 競合情勢
第10章 ホワイトスペース分析
第11章 企業の競争力分析
第12章 ホログラフィックディスプレイ市場におけるスタートアップエコシステム
セクションIV:企業プロファイル
第13章 企業プロファイル
- 章の概要
- AFC Technology
- AV Concepts
- DisplAir
- Envisics
- EON Reality
- Holotech
- Holoxica
- HYPERVSN
- Konica Minolta
- Microsoft
- NICE System
- Leia Display System
- MDH Hologram
- NITTO DENKO
- Provision Holdings
- Qualcomm
- RealView Imaging
- ViewSonic
- VividQ
- Zebra Imaging
セクションV:市場動向
第14章 メガトレンド分析
第15章 アンメットニーズ分析
第16章 特許分析
第17章 最近の動向
セクションVI:市場機会の分析
第18章 世界のホログラフィックディスプレイ市場
第19章 コンポーネントタイプ別の市場機会
第20章 技術タイプ別の市場機会
第21章 次元タイプ別の市場機会
第22章 用途別の市場機会
第23章 北米におけるホログラフィックディスプレイの市場機会
第24章 欧州におけるホログラフィックディスプレイの市場機会
第25章 アジアにおけるホログラフィックディスプレイの市場機会
第26章 中東・北アフリカにおけるホログラフィックディスプレイの市場機会
第27章 ラテンアメリカにおけるホログラフィックディスプレイの市場機会
第28章 隣接市場分析
セクションVII:戦略ツール
第29章 勝利の鍵となる戦略
第30章 ポーターのファイブフォース分析
第31章 SWOT分析
第32章 バリューチェーン分析
第33章 ROOTSの戦略提言
セクションVIII:その他の独占的洞察
第34章 1次調査からの洞察
第35章 報告書の結論
セクションIX:付録
第36章 表形式データ
第37章 企業・団体一覧
第38章 カスタマイズの機会
第39章 ROOTSサブスクリプションサービス
第40章 著者詳細
Holographic Display Market Overview
As per Roots Analysis, the global holographic display market size is estimated to grow from USD 14.30 billion in the current year to USD 75.62 billion by 2035, at a CAGR of 18.11% during the forecast period, till 2035.
The opportunity for holographic display market has been distributed across the following segments:
Type of Component
- Digital Micrometer
- Lens
- Light Modulator
- Monitor
- Projectors & Camera
- Scanner
- Others
Type of Technology
- Electro-Holographic
- Laser Plasma Displays
- Piston
- Semi-Transparent
- Touchable
Type of Dimension
- 2D
- 3D
- 4D
Type of Application
- Commercial
- Consumer
- Defense
- Industrial Application
- Medical
- Other
Geographical Regions
- North America
- US
- Canada
- Mexico
- Other North American countries
- Europe
- Austria
- Belgium
- Denmark
- France
- Germany
- Ireland
- Italy
- Netherlands
- Norway
- Russia
- Spain
- Sweden
- Switzerland
- UK
- Other European countries
- Asia
- China
- India
- Japan
- Singapore
- South Korea
- Other Asian countries
- Latin America
- Brazil
- Chile
- Colombia
- Venezuela
- Other Latin American countries
- Middle East and North Africa
- Egypt
- Iran
- Iraq
- Israel
- Kuwait
- Saudi Arabia
- UAE
- Other MENA countries
- Rest of the World
- Australia
- New Zealand
- Other countries
HOLOGRAPHIC DISPLAY MARKET: GROWTH AND TRENDS
A holographic display refers to a sophisticated type of screen that generates three-dimensional (3D) images or visuals by controlling light to make them appear as if they occupy real space. This technology enables viewers to observe and engage with 3D content from various angles without the need for special glasses or devices.
The market features a range of displays, including reflection-based, transmission-based, and interactive options that cater to specific needs and broaden their usability. Further, their remarkable benefits in immersive visualization, expansive viewing angles, and improved interactivity are driving demand across various sectors. Consequently, the influence of holographic displays on consumer interaction is significant, and businesses are utilizing holography to create unforgettable brand experiences that differentiate them in an increasingly saturated market. Nevertheless, medical imaging remains the foremost application propelling the industry forward.
It is worth highlighting that future trends in visual display technology indicate that holography will continue to advance swiftly. An increasing number of industry stakeholders are committing to research and development for more advanced applications that involve artificial intelligence and augmented reality, further enhancing user experiences. Owing to above-mentioned factors, the holographic displays market is projected to experience significant growth during the forecast period.
HOLOGRAPHIC DISPLAY MARKET: KEY SEGMENTS
Market Share by Type of Component
Based on type of component, the global holographic display market is segmented into digital micrometers, lenses, light modulators, monitors, projectors & cameras, scanners, and others. According to our estimates, currently, lens segment captures the majority share of the market. This can be attributed to its ability to deliver image clarity and focus, ensuring accurate image formation in holographic displays.
However, the light modulator segment is anticipated to experience a relatively higher CAGR during the forecast period. This growth can be attributed to the crucial function of light modulators in manipulating light waves to generate holographic images, making them a fundamental component of holographic display technology.
Market Share by Type of Technology
Based on type of technology, the holographic display market is segmented into electro-holographic, laser plasma displays, piston, semi-transparent, and touchable. According to our estimates, currently, electro-holographic segment captures the majority of the market. This can be attributed to its superior 3D visualization, which offers enhanced depth, clarity, and resolution when compared to alternative technologies.
On the other hand, laser plasma displays are becoming more popular in the market and are expected to witness significant CAGR during the forecast period, owing to its capability to create authentic 3D images and its growing application in medical and scientific visualizations.
Market Share by Type of Dimension
Based on type of dimension, the holographic display market is segmented into 2D, 3D, and 4D. According to our estimates, currently, 3D segment captures the majority share of the market. The realistic and lifelike visualizations offered by 3D holographic displays make them more captivating and effective for use in entertainment, healthcare, and retail sectors. Consequently, the increasing demand for immersive experiences with holographic displays is likely to support the expansion of 3D displays.
Market Share by Type of Application
Based on type of application, the holographic display market is segmented into commercial, consumer, defense, industrial applications, medical, and others. According to our estimates, currently, medical applications segment captures the majority share of the market. This can be attributed to the increasing applications of holographic displays within the healthcare industry. The rising use of advanced technology has heightened the demand for state-of-the-art imaging equipment, such as holographic displays. These displays provide detailed, real-time 3D representations of organs, tissues, and surgical procedures. Their enhanced capabilities in improving diagnostics, surgical accuracy, and patient outcomes are likely to continue driving market demand.
However, the commercial sector is projected to grow at a higher compound annual growth rate (CAGR) during this forecast period. This can be attributed to the utilization of these displays in a variety of applications, including digital signage, product showcases, and immersive brand storytelling in stores and malls.
Market Share by Geographical Regions
Based on geographical regions, the holographic display market is segmented into North America, Europe, Asia, Latin America, Middle East and North Africa, and the rest of the world. According to our estimates, currently, North America captures the majority share of the market. This can be attributed to the robust consumer electronics sector and the well-established media and entertainment industry.
Meanwhile, Asia is projected to achieve the highest compound annual growth rate (CAGR) during this forecast period. This can be attributed to the consumer electronics centers in China, Japan, and South Korea. The highest levels of production and consumption of consumer electronics, particularly through the integration of holographic technologies in smartphones, tablets, and wearables, are fueling the growth of this market in Asia.
Example Players in Holographic Display Market
- AFC Technology
- AV Concepts
- DisplAir
- Envisics
- EON Reality
- Holotech
- Holoxica
- HYPERVSN
- Konica Minolta
- Leia Display System
- MDH Hologram
- NITTO DENKO
- Provision Holdings
- Qualcomm
- Realfiction
- RealView Imaging
- ViewSonic
- VividQ
- Zebra Imaging
HOLOGRAPHIC DISPLAY MARKET: RESEARCH COVERAGE
The report on the holographic display market features insights on various sections, including:
- Market Sizing and Opportunity Analysis: An in-depth analysis of the holographic display market, focusing on key market segments, including [A] type of offering, [B] areas of application, [C] type of technology, [D] type of enterprise and [E] key geographical regions
- Competitive Landscape: A comprehensive analysis of the companies engaged in the holographic display market, based on several relevant parameters, such as [A] year of establishment, [B] company size, [C] location of headquarters and [D] ownership structure.
- Company Profiles: Elaborate profiles of prominent players engaged in the holographic display market, providing details on [A] location of headquarters, [B] company size, [C] company mission, [D] company footprint, [E] management team, [F] contact details, [G] financial information, [H] operating business segments, [I] service / product portfolio, [J] moat analysis, [K] recent developments, and an informed future outlook.
- Megatrends: An evaluation of ongoing megatrends in the holographic display industry.
- Patent Analysis: An insightful analysis of patents filed / granted in the holographic display domain, based on relevant parameters, including [A] type of patent, [B] patent publication year, [C] patent age and [D] leading players.
- Recent Developments: An overview of the recent developments made in the holographic display market, along with analysis based on relevant parameters, including [A] year of initiative, [B] type of initiative, [C] geographical distribution and [D] most active players.
- Porter's Five Forces Analysis: An analysis of five competitive forces prevailing in the holographic display market, including threats of new entrants, bargaining power of buyers, bargaining power of suppliers, threats of substitute products and rivalry among existing competitors.
- SWOT Analysis: An insightful SWOT framework, highlighting the strengths, weaknesses, opportunities and threats in the domain. Additionally, it provides Harvey ball analysis, highlighting the relative impact of each SWOT parameter.
KEY QUESTIONS ANSWERED IN THIS REPORT
- How many companies are currently engaged in holographic display market?
- Which are the leading companies in this market?
- What factors are likely to influence the evolution of this market?
- What is the current and future market size?
- What is the CAGR of this market?
- How is the current and future market opportunity likely to be distributed across key market segments?
REASONS TO BUY THIS REPORT
- The report provides a comprehensive market analysis, offering detailed revenue projections of the overall market and its specific sub-segments. This information is valuable to both established market leaders and emerging entrants.
- Stakeholders can leverage the report to gain a deeper understanding of the competitive dynamics within the market. By analyzing the competitive landscape, businesses can make informed decisions to optimize their market positioning and develop effective go-to-market strategies.
- The report offers stakeholders a comprehensive overview of the market, including key drivers, barriers, opportunities, and challenges. This information empowers stakeholders to stay abreast of market trends and make data-driven decisions to capitalize on growth prospects.
ADDITIONAL BENEFITS
- Complimentary Excel Data Packs for all Analytical Modules in the Report
- 15% Free Content Customization
- Detailed Report Walkthrough Session with Research Team
- Free Updated report if the report is 6-12 months old or older
TABLE OF CONTENTS
SECTION I: REPORT OVERVIEW
1. PREFACE
- 1.1. Introduction
- 1.2. Market Share Insights
- 1.3. Key Market Insights
- 1.4. Report Coverage
- 1.5. Key Questions Answered
- 1.6. Chapter Outlines
2. RESEARCH METHODOLOGY
- 2.1. Chapter Overview
- 2.2. Research Assumptions
- 2.3. Database Building
- 2.3.1. Data Collection
- 2.3.2. Data Validation
- 2.3.3. Data Analysis
- 2.4. Project Methodology
- 2.4.1. Secondary Research
- 2.4.1.1. Annual Reports
- 2.4.1.2. Academic Research Papers
- 2.4.1.3. Company Websites
- 2.4.1.4. Investor Presentations
- 2.4.1.5. Regulatory Filings
- 2.4.1.6. White Papers
- 2.4.1.7. Industry Publications
- 2.4.1.8. Conferences and Seminars
- 2.4.1.9. Government Portals
- 2.4.1.10. Media and Press Releases
- 2.4.1.11. Newsletters
- 2.4.1.12. Industry Databases
- 2.4.1.13. Roots Proprietary Databases
- 2.4.1.14. Paid Databases and Sources
- 2.4.1.15. Social Media Portals
- 2.4.1.16. Other Secondary Sources
- 2.4.2. Primary Research
- 2.4.2.1. Introduction
- 2.4.2.2. Types
- 2.4.2.2.1. Qualitative
- 2.4.2.2.2. Quantitative
- 2.4.2.3. Advantages
- 2.4.2.4. Techniques
- 2.4.2.4.1. Interviews
- 2.4.2.4.2. Surveys
- 2.4.2.4.3. Focus Groups
- 2.4.2.4.4. Observational Research
- 2.4.2.4.5. Social Media Interactions
- 2.4.2.5. Stakeholders
- 2.4.2.5.1. Company Executives (CXOs)
- 2.4.2.5.2. Board of Directors
- 2.4.2.5.3. Company Presidents and Vice Presidents
- 2.4.2.5.4. Key Opinion Leaders
- 2.4.2.5.5. Research and Development Heads
- 2.4.2.5.6. Technical Experts
- 2.4.2.5.7. Subject Matter Experts
- 2.4.2.5.8. Scientists
- 2.4.2.5.9. Doctors and Other Healthcare Providers
- 2.4.2.6. Ethics and Integrity
- 2.4.2.6.1. Research Ethics
- 2.4.2.6.2. Data Integrity
- 2.4.3. Analytical Tools and Databases
- 2.4.1. Secondary Research
3. MARKET DYNAMICS
- 3.1. Forecast Methodology
- 3.1.1. Top-Down Approach
- 3.1.2. Bottom-Up Approach
- 3.1.3. Hybrid Approach
- 3.2. Market Assessment Framework
- 3.2.1. Total Addressable Market (TAM)
- 3.2.2. Serviceable Addressable Market (SAM)
- 3.2.3. Serviceable Obtainable Market (SOM)
- 3.2.4. Currently Acquired Market (CAM)
- 3.3. Forecasting Tools and Techniques
- 3.3.1. Qualitative Forecasting
- 3.3.2. Correlation
- 3.3.3. Regression
- 3.3.4. Time Series Analysis
- 3.3.5. Extrapolation
- 3.3.6. Convergence
- 3.3.7. Forecast Error Analysis
- 3.3.8. Data Visualization
- 3.3.9. Scenario Planning
- 3.3.10. Sensitivity Analysis
- 3.4. Key Considerations
- 3.4.1. Demographics
- 3.4.2. Market Access
- 3.4.3. Reimbursement Scenarios
- 3.4.4. Industry Consolidation
- 3.5. Robust Quality Control
- 3.6. Key Market Segmentations
- 3.7. Limitations
4. MACRO-ECONOMIC INDICATORS
- 4.1. Chapter Overview
- 4.2. Market Dynamics
- 4.2.1. Time Period
- 4.2.1.1. Historical Trends
- 4.2.1.2. Current and Forecasted Estimates
- 4.2.2. Currency Coverage
- 4.2.2.1. Overview of Major Currencies Affecting the Market
- 4.2.2.2. Impact of Currency Fluctuations on the Industry
- 4.2.3. Foreign Exchange Impact
- 4.2.3.1. Evaluation of Foreign Exchange Rates and Their Impact on Market
- 4.2.3.2. Strategies for Mitigating Foreign Exchange Risk
- 4.2.4. Recession
- 4.2.4.1. Historical Analysis of Past Recessions and Lessons Learnt
- 4.2.4.2. Assessment of Current Economic Conditions and Potential Impact on the Market
- 4.2.5. Inflation
- 4.2.5.1. Measurement and Analysis of Inflationary Pressures in the Economy
- 4.2.5.2. Potential Impact of Inflation on the Market Evolution
- 4.2.6. Interest Rates
- 4.2.6.1. Overview of Interest Rates and Their Impact on the Market
- 4.2.6.2. Strategies for Managing Interest Rate Risk
- 4.2.7. Commodity Flow Analysis
- 4.2.7.1. Type of Commodity
- 4.2.7.2. Origins and Destinations
- 4.2.7.3. Values and Weights
- 4.2.7.4. Modes of Transportation
- 4.2.8. Global Trade Dynamics
- 4.2.8.1. Import Scenario
- 4.2.8.2. Export Scenario
- 4.2.9. War Impact Analysis
- 4.2.9.1. Russian-Ukraine War
- 4.2.9.2. Israel-Hamas War
- 4.2.10. COVID Impact / Related Factors
- 4.2.10.1. Global Economic Impact
- 4.2.10.2. Industry-specific Impact
- 4.2.10.3. Government Response and Stimulus Measures
- 4.2.10.4. Future Outlook and Adaptation Strategies
- 4.2.11. Other Indicators
- 4.2.11.1. Fiscal Policy
- 4.2.11.2. Consumer Spending
- 4.2.11.3. Gross Domestic Product (GDP)
- 4.2.11.4. Employment
- 4.2.11.5. Taxes
- 4.2.11.6. R&D Innovation
- 4.2.11.7. Stock Market Performance
- 4.2.11.8. Supply Chain
- 4.2.11.9. Cross-Border Dynamics
- 4.2.1. Time Period
SECTION II: QUALITATIVE INSIGHTS
5. EXECUTIVE SUMMARY
6. INTRODUCTION
- 6.1. Chapter Overview
- 6.2. Overview of Holographic Display Market
- 6.2.1. Type of Component
- 6.2.2. Type of Technology
- 6.2.3. Type of Dimension
- 6.2.4. Type of Application
- 6.3. Future Perspective
7. REGULATORY SCENARIO
SECTION III: MARKET OVERVIEW
8. COMPREHENSIVE DATABASE OF LEADING PLAYERS
9. COMPETITIVE LANDSCAPE
- 9.1. Chapter Overview
- 9.2. Holographic Display: Overall Market Landscape
- 9.2.1. Analysis by Year of Establishment
- 9.2.2. Analysis by Company Size
- 9.2.3. Analysis by Location of Headquarters
- 9.2.4. Analysis by Ownership Structure
10. WHITE SPACE ANALYSIS
11. COMPANY COMPETITIVENESS ANALYSIS
12. STARTUP ECOSYSTEM IN THE HOLOGRAPHIC DISPLAY MARKET
- 12.1. Holographic Display: Market Landscape of Startups
- 12.1.1. Analysis by Year of Establishment
- 12.1.2. Analysis by Company Size
- 12.1.3. Analysis by Company Size and Year of Establishment
- 12.1.4. Analysis by Location of Headquarters
- 12.1.5. Analysis by Company Size and Location of Headquarters
- 12.1.6. Analysis by Ownership Structure
- 12.2. Key Findings
SECTION IV: COMPANY PROFILES
13. COMPANY PROFILES
- 13.1. Chapter Overview
- 13.2. AFC Technology*
- 13.2.1. Company Overview
- 13.2.2. Company Mission
- 13.2.3. Company Footprint
- 13.2.4. Management Team
- 13.2.5. Contact Details
- 13.2.6. Financial Performance
- 13.2.7. Operating Business Segments
- 13.2.8. Service / Product Portfolio (project specific)
- 13.2.9. MOAT Analysis
- 13.2.10. Recent Developments and Future Outlook
- 13.3. AV Concepts
- 13.4. DisplAir
- 13.5. Envisics
- 13.6. EON Reality
- 13.7. Holotech
- 13.8. Holoxica
- 13.9. HYPERVSN
- 13.10. Konica Minolta
- 13.11. Microsoft
- 13.12. NICE System
- 13.13. Leia Display System
- 13.14. MDH Hologram
- 13.15. NITTO DENKO
- 13.16. Provision Holdings
- 13.17. Qualcomm
- 13.18. RealView Imaging
- 13.19. ViewSonic
- 13.20. VividQ
- 13.21. Zebra Imaging
SECTION V: MARKET TRENDS
14. MEGA TRENDS ANALYSIS
15. UNMET NEED ANALYSIS
16. PATENT ANALYSIS
17. RECENT DEVELOPMENTS
- 17.1. Chapter Overview
- 17.2. Recent Funding
- 17.3. Recent Partnerships
- 17.4. Other Recent Initiatives
SECTION VI: MARKET OPPORTUNITY ANALYSIS
18. GLOBAL HOLOGRAPHIC DISPLAY MARKET
- 18.1. Chapter Overview
- 18.2. Key Assumptions and Methodology
- 18.3. Trends Disruption Impacting Market
- 18.4. Demand Side Trends
- 18.5. Supply Side Trends
- 18.6. Global Holographic Display Market, Historical Trends (Since 2020) and Forecasted Estimates (Till 2035)
- 18.7. Multivariate Scenario Analysis
- 18.7.1. Conservative Scenario
- 18.7.2. Optimistic Scenario
- 18.8. Investment Feasibility Index
- 18.9. Key Market Segmentations
19. MARKET OPPORTUNITIES BASED ON TYPE OF COMPONENT
- 19.1. Chapter Overview
- 19.2. Key Assumptions and Methodology
- 19.3. Revenue Shift Analysis
- 19.4. Market Movement Analysis
- 19.5. Penetration-Growth (P-G) Matrix
- 19.6. Holographic Display Market for Digital Micrometer: Historical Trends (Since 2020) and Forecasted Estimates (Till 2035)
- 19.7. Holographic Display Market for Lense: Historical Trends (Since 2020) and Forecasted Estimates (Till 2035)
- 19.8. Holographic Display Market for Light Modulators: Historical Trends (Since 2020) and Forecasted Estimates (Till 2035)
- 19.9. Holographic Display Market for Monitor: Historical Trends (Since 2020) and Forecasted Estimates (Till 2035)
- 19.10. Holographic Display Market for Projectors & Camera: Historical Trends (Since 2020) and Forecasted Estimates (Till 2035)
- 19.11. Holographic Display Market for Scanner: Historical Trends (Since 2020) and Forecasted Estimates (Till 2035)
- 19.12. Holographic Display Market for Other: Historical Trends (Since 2020) and Forecasted Estimates (Till 2035)
- 19.13. Data Triangulation and Validation
- 19.13.1. Secondary Sources
- 19.13.2. Primary Sources
- 19.13.3. Statistical Modeling
20. MARKET OPPORTUNITIES BASED ON TYPE OF TECHNOLOGY
- 20.1. Chapter Overview
- 20.2. Key Assumptions and Methodology
- 20.3. Revenue Shift Analysis
- 20.4. Market Movement Analysis
- 20.5. Penetration-Growth (P-G) Matrix
- 20.6. Holographic Display Market for Electro-Holographic: Historical Trends (Since 2020) and Forecasted Estimates (Till 2035)
- 20.7. Holographic Display Market for Laser Plasma Displays: Historical Trends (Since 2020) and Forecasted Estimates (Till 2035)
- 20.8. Holographic Display Market for Piston: Historical Trends (Since 2020) and Forecasted Estimates (Till 2035)
- 20.9. Holographic Display Market for Semi-Transparent: Historical Trends (Since 2020) and Forecasted Estimates (Till 2035)
- 20.10. Holographic Display Market for Touchable: Historical Trends (Since 2020) and Forecasted Estimates (Till 2035)
- 20.11. Data Triangulation and Validation
- 20.11.1. Secondary Sources
- 20.11.2. Primary Sources
- 20.11.3. Statistical Modeling
21. MARKET OPPORTUNITIES BASED ON TYPE OF DIMENSION
- 21.1. Chapter Overview
- 21.2. Key Assumptions and Methodology
- 21.3. Revenue Shift Analysis
- 21.4. Market Movement Analysis
- 21.5. Penetration-Growth (P-G) Matrix
- 21.6. Holographic Display Market for 2D: Historical Trends (Since 2020) and Forecasted Estimates (Till 2035)
- 21.7. Holographic Display Market for 3D: Historical Trends (Since 2020) and Forecasted Estimates (Till 2035)
- 21.8. Holographic Display Market for 4D: Historical Trends (Since 2020) and Forecasted Estimates (Till 2035)
- 21.9. Data Triangulation and Validation
- 21.9.1. Secondary Sources
- 21.9.2. Primary Sources
- 21.9.3. Statistical Modeling
22. MARKET OPPORTUNITIES BASED ON TYPE OF APPLICATION
- 22.1. Chapter Overview
- 22.2. Key Assumptions and Methodology
- 22.3. Revenue Shift Analysis
- 22.4. Market Movement Analysis
- 22.5. Penetration-Growth (P-G) Matrix
- 22.6. Holographic Display Market for Commercial: Historical Trends (Since 2020) and Forecasted Estimates (Till 2035)
- 22.7. Holographic Display Market for Consumer: Historical Trends (Since 2020) and Forecasted Estimates (Till 2035)
- 22.8. Holographic Display Market for Defense: Historical Trends (Since 2020) and Forecasted Estimates (Till 2035)
- 22.9. Holographic Display Market for Industrial Application: Historical Trends (Since 2020) and Forecasted Estimates (Till 2035)
- 22.10. Holographic Display Market for Medical: Historical Trends (Since 2020) and Forecasted Estimates (Till 2035)
- 22.11. Holographic Display Market for Other: Historical Trends (Since 2020) and Forecasted Estimates (Till 2035)
- 22.12. Data Triangulation and Validation
- 22.12.1. Secondary Sources
- 22.12.2. Primary Sources
- 22.12.3. Statistical Modeling
23. MARKET OPPORTUNITIES FOR HOLOGRAPHIC DISPLAY IN NORTH AMERICA
- 23.1. Chapter Overview
- 23.2. Key Assumptions and Methodology
- 23.3. Revenue Shift Analysis
- 23.4. Market Movement Analysis
- 23.5. Penetration-Growth (P-G) Matrix
- 23.6. Holographic Display Market in North America: Historical Trends (Since 2020) and Forecasted Estimates (Till 2035)
- 23.6.1. Holographic Display Market in the US: Historical Trends (Since 2020) and Forecasted Estimates (Till 2035)
- 23.6.2. Holographic Display Market in Canada: Historical Trends (Since 2020) and Forecasted Estimates (Till 2035)
- 23.6.3. Holographic Display Market in Mexico: Historical Trends (Since 2020) and Forecasted Estimates (Till 2035)
- 23.6.4. Holographic Display Market in Other North American Countries: Historical Trends (Since 2020) and Forecasted Estimates (Till 2035)
- 23.7. Data Triangulation and Validation
24. MARKET OPPORTUNITIES FOR HOLOGRAPHIC DISPLAY IN EUROPE
- 24.1. Chapter Overview
- 24.2. Key Assumptions and Methodology
- 24.3. Revenue Shift Analysis
- 24.4. Market Movement Analysis
- 24.5. Penetration-Growth (P-G) Matrix
- 24.6. Holographic Display Market in Europe: Historical Trends (Since 2020) and Forecasted Estimates (Till 2035)
- 24.6.1. Holographic Display Market in Austria: Historical Trends (Since 2020) and Forecasted Estimates (Till 2035)
- 24.6.2. Holographic Display Market in Belgium: Historical Trends (Since 2020) and Forecasted Estimates (Till 2035)
- 24.6.3. Holographic Display Market in Denmark: Historical Trends (Since 2020) and Forecasted Estimates (Till 2035)
- 24.6.4. Holographic Display Market in France: Historical Trends (Since 2020) and Forecasted Estimates (Till 2035)
- 24.6.5. Holographic Display Market in Germany: Historical Trends (Since 2020) and Forecasted Estimates (Till 2035)
- 24.6.6. Holographic Display Market in Ireland: Historical Trends (Since 2020) and Forecasted Estimates (Till 2035)
- 24.6.7. Holographic Display Market in Italy: Historical Trends (Since 2020) and Forecasted Estimates (Till 2035)
- 24.6.8. Holographic Display Market in Netherlands: Historical Trends (Since 2020) and Forecasted Estimates (Till 2035)
- 24.6.9. Holographic Display Market in Norway: Historical Trends (Since 2020) and Forecasted Estimates (Till 2035)
- 24.6.10. Holographic Display Market in Russia: Historical Trends (Since 2020) and Forecasted Estimates (Till 2035)
- 24.6.11. Holographic Display Market in Spain: Historical Trends (Since 2020) and Forecasted Estimates (Till 2035)
- 24.6.12. Holographic Display Market in Sweden: Historical Trends (Since 2020) and Forecasted Estimates (Till 2035)
- 24.6.13. Holographic Display Market in Sweden: Historical Trends (Since 2020) and Forecasted Estimates (Till 2035)
- 24.6.14. Holographic Display Market in Switzerland: Historical Trends (Since 2020) and Forecasted Estimates (Till 2035)
- 24.6.15. Holographic Display Market in the UK: Historical Trends (Since 2020) and Forecasted Estimates (Till 2035)
- 24.6.16. Holographic Display Market in Other European Countries: Historical Trends (Since 2020) and Forecasted Estimates (Till 2035)
- 24.7. Data Triangulation and Validation
25. MARKET OPPORTUNITIES FOR HOLOGRAPHIC DISPLAY IN ASIA
- 25.1. Chapter Overview
- 25.2. Key Assumptions and Methodology
- 25.3. Revenue Shift Analysis
- 25.4. Market Movement Analysis
- 25.5. Penetration-Growth (P-G) Matrix
- 25.6. Holographic Display Market in Asia: Historical Trends (Since 2020) and Forecasted Estimates (Till 2035)
- 25.6.1. Holographic Display Market in China: Historical Trends (Since 2020) and Forecasted Estimates (Till 2035)
- 25.6.2. Holographic Display Market in India: Historical Trends (Since 2020) and Forecasted Estimates (Till 2035)
- 25.6.3. Holographic Display Market in Japan: Historical Trends (Since 2020) and Forecasted Estimates (Till 2035)
- 25.6.4. Holographic Display Market in Singapore: Historical Trends (Since 2020) and Forecasted Estimates (Till 2035)
- 25.6.5. Holographic Display Market in South Korea: Historical Trends (Since 2020) and Forecasted Estimates (Till 2035)
- 25.6.6. Holographic Display Market in Other Asian Countries: Historical Trends (Since 2020) and Forecasted Estimates (Till 2035)
- 25.7. Data Triangulation and Validation
26. MARKET OPPORTUNITIES FOR HOLOGRAPHIC DISPLAY IN MIDDLE EAST AND NORTH AFRICA (MENA)
- 26.1. Chapter Overview
- 26.2. Key Assumptions and Methodology
- 26.3. Revenue Shift Analysis
- 26.4. Market Movement Analysis
- 26.5. Penetration-Growth (P-G) Matrix
- 26.6. Holographic Display Market in Middle East and North Africa (MENA): Historical Trends (Since 2020) and Forecasted Estimates (Till 2035)
- 26.6.1. Holographic Display Market in Egypt: Historical Trends (Since 2020) and Forecasted Estimates (Till 205)
- 26.6.2. Holographic Display Market in Iran: Historical Trends (Since 2020) and Forecasted Estimates (Till 2035)
- 26.6.3. Holographic Display Market in Iraq: Historical Trends (Since 2020) and Forecasted Estimates (Till 2035)
- 26.6.4. Holographic Display Market in Israel: Historical Trends (Since 2020) and Forecasted Estimates (Till 2035)
- 26.6.5. Holographic Display Market in Kuwait: Historical Trends (Since 2020) and Forecasted Estimates (Till 2035)
- 26.6.6. Holographic Display Market in Saudi Arabia: Historical Trends (Since 2020) and Forecasted Estimates (Till 2035)
- 26.6.7. Neuromorphic Computing Marke in United Arab Emirates (UAE): Historical Trends (Since 2020) and Forecasted Estimates (Till 2035)
- 26.6.8. Holographic Display Market in Other MENA Countries: Historical Trends (Since 2020) and Forecasted Estimates (Till 2035)
- 26.7. Data Triangulation and Validation
27. MARKET OPPORTUNITIES FOR HOLOGRAPHIC DISPLAY IN LATIN AMERICA
- 27.1. Chapter Overview
- 27.2. Key Assumptions and Methodology
- 27.3. Revenue Shift Analysis
- 27.4. Market Movement Analysis
- 27.5. Penetration-Growth (P-G) Matrix
- 27.6. Holographic Display Market in Latin America: Historical Trends (Since 2020) and Forecasted Estimates (Till 2035)
- 27.6.1. Holographic Display Market in Argentina: Historical Trends (Since 2020) and Forecasted Estimates (Till 2035)
- 27.6.2. Holographic Display Market in Brazil: Historical Trends (Since 2020) and Forecasted Estimates (Till 2035)
- 27.6.3. Holographic Display Market in Chile: Historical Trends (Since 2020) and Forecasted Estimates (Till 2035)
- 27.6.4. Holographic Display Market in Colombia Historical Trends (Since 2020) and Forecasted Estimates (Till 2035)
- 27.6.5. Holographic Display Market in Venezuela: Historical Trends (Since 2020) and Forecasted Estimates (Till 2035)
- 27.6.6. Holographic Display Market in Other Latin American Countries: Historical Trends (Since 2020) and Forecasted Estimates (Till 2035)
- 27.7. Data Triangulation and Validation
